

jetcityimage/iStock Editorial via Getty Images
AT&T Inc. (NYSE:T) has represented something of a “value trap” over a number of years, with a low P/E and high dividend yield attracting investor attention. Nevertheless, ever rising debt levels to maintain the dividend, a lack of business growth from the mismanagement of assets, alongside a need to competitively spend extra money on wireless infrastructure (67% of company Q3 revenue) have continually pushed underlying company worth in the wrong direction.
My concern is the U.S. wireless pot of potential subscribers will not grow in a recession (it might even decline in a severe macro downturn). Already, smartphone user counts of 307 million in Q3 2022 in America are projected to only increase to 339 million by 2030 (from 190 million eight years ago in 2014).
In the case of backpedaling wireless user totals, other major carriers like Verizon (VZ) and T-Mobile US (TMUS) may be forced to slash prices to keep customers, and AT&T will have to follow suit to maintain its leading 44% market share. In the end, this basic commodity-like business model could see cash flow knocked down a peg, making it incredibly difficult for the company to hold the dividend payout steady, while also repaying past debts/interest and reinvesting mega-dollars into its CAPEX-heavy network infrastructure.
Recent Performance Worse Than You Think
In my May 2017 article here, I argued the Time Warner merger with AT&T created one of the most expensive companies to own at the time, with the share price above $30 (pre-spinoff). When you include Warner Bros. Discovery, Inc. (WBD) values adjusted on the April 11th spinoff/restructuring, plus the exceptional dividend payout over five years, AT&T’s total return for long-term shareholders has been slightly NEGATIVE. I have drawn a chart below outlining this total return idea, adjusted to the current quote. And, if you continue to hold WBD shares, your net loss has been even greater. [I wrote a bearish momentum article on WBD in August here.]
StockCharts.com – AT&T, Daily Price and Volume Changes with Author Reference Point, Since May 2017 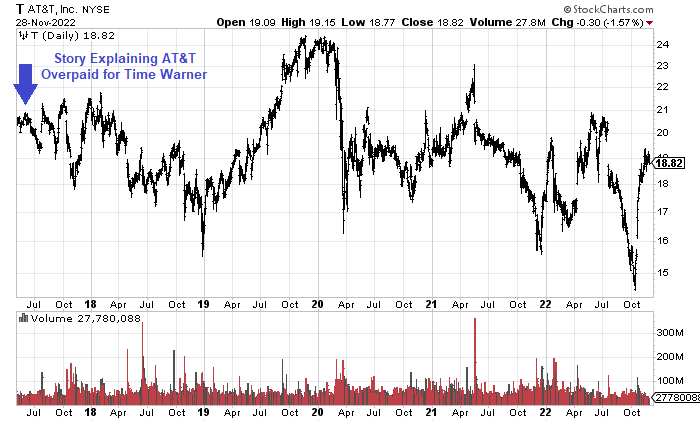
Much like its sibling Baby-Bell incarnation Verizon, too much debt and a stagnating wireless market size are bad news for future profitability and sales growth. In fact, a recession does not mix well with excessive levels of debt (in a rising interest rate) historically for any zero-growth company. Just like my cautionary suggestion for Verizon shareholders in June here has proven out as a smart avoid in your portfolio (written when price was $51 per VZ share), AT&T has not been able to rebound at all in 2022, post spinoff.
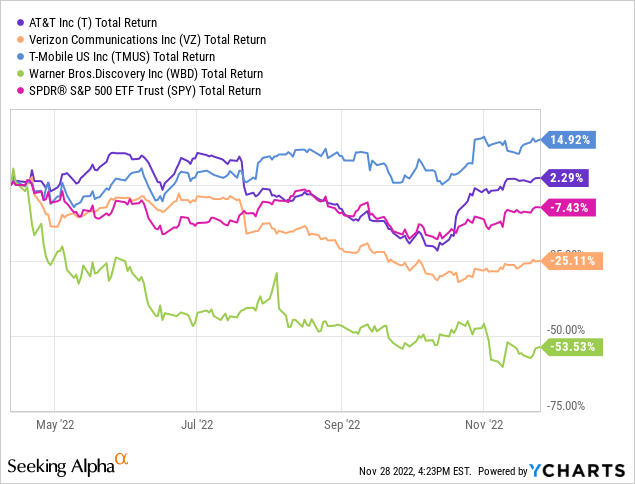
To illustrate this point, I have drawn two charts. One starts after February 1st, the date the Warner Media + Discovery merger terms were finalized. And, another begins after April 11th, the first day you could trade out of the new WBD creation with your AT&T allotted shares. AT&T total returns are compared to Verizon, T-Mobile US, Warner Bros. Discovery, and the large-cap indexed SPDR S&P 500 ETF (SPY).
YCharts – Wireless Carrier Total Returns vs. S&P 500, Since February 2nd, 2022 YCharts – Wireless Carrier Total Returns vs. S&P 500, Since April 12th, 2022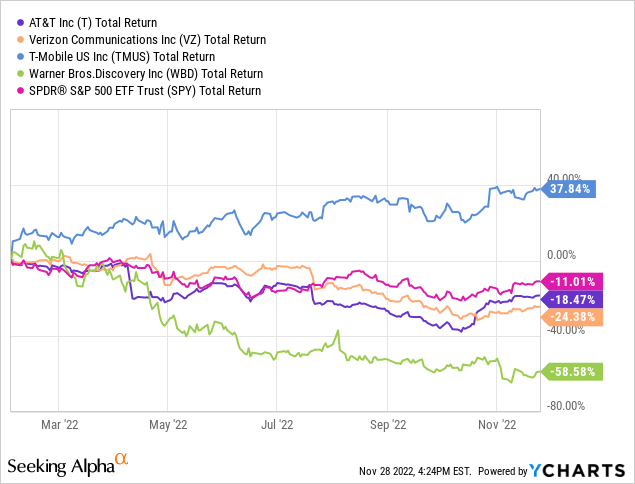
2022 Dividend Cut
Can AT&T cut its dividend? Many analysts and pundits did not think a dividend cut was possible several years ago. Yet, part of the breakup with Warner Media involved slashing the dividend payout for the remaining phone operations. So, sure, if a deep recession hits in 2023, another dividend cut will enter the investment discussion. Below is a chart of the prevailing dividend yield for AT&T income investors over the past 12 months, before and after the WBD spinoff/restructuring effort. Notice, although price for both equities is the same or lower combined over time, the trailing dividend yield has tanked from 12% to 7.1% currently.
With the companion Verizon quote tanking since early summer and AT&T’s operating mess still a pile of tangles, both wireless giants are now generating about the same yield. Not coincidentally, both may be holding too much debt if an economic downturn is next, a result of decades of intensive capital spending.
The forward dividend payout rate is indicated $1.11 annually, which works out to a respectable 5.9%, representing about 45% coverage by estimated EPS next year. If the economy holds up in 2023, AT&T should be able to afford the new lowered rate. However, if a recession and wireless price war undercuts EPS over the coming 12 months, the dividend will again be pressured.
YCharts – Wireless Carrier Trailing Dividend Yields vs. S&P 500, Past 12 Months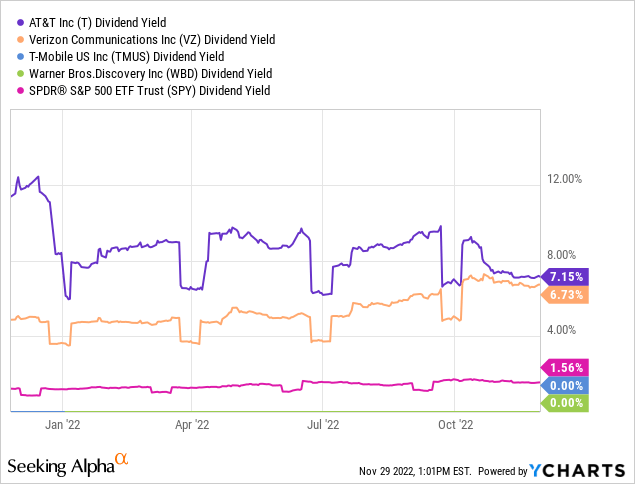
How Much Debt?
No doubt, AT&T is sitting in a better leverage position than a year ago, a function of offloading a mountain of debt (around $50 billion in total debt, building leases, and tax liabilities in the transaction) onto the new Warner Bros. Discovery. Yet, the company remains more leveraged than either of its main competitors, Verizon and T-Mobile.
Below are graphs highlighting the debt problem today, holding back stock gains. The company now holds about $133 billion in combined balance sheet debt (not much different than Verizon) vs. $136 billion in equity capitalization at $19 a share.
YCharts – Wireless Carrier Net Financial Debt (Quarterly), Past 12 Months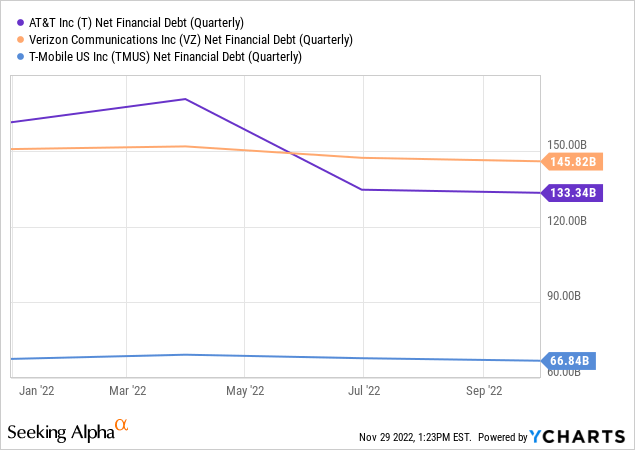
Yet, as a function of shareholder equity, AT&T has considerably higher net debt vs. competitors.
YCharts – Wireless Carrier Financial Debt to Equity (Quarterly), Past 12 Months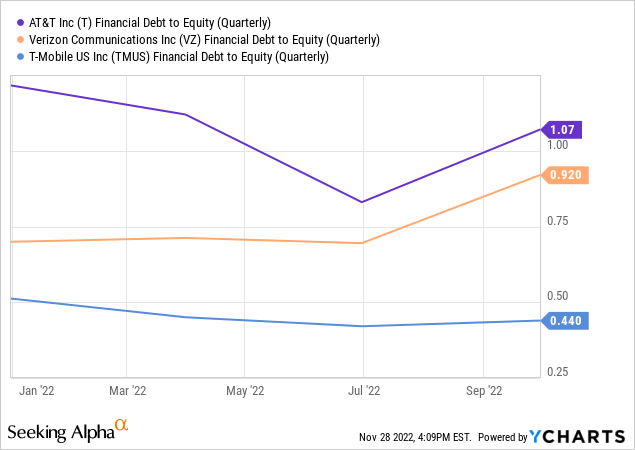
Total interest expense is higher on the debt (especially vs. Verizon’s mostly locked-in, ultra-cheap rates), which could begin to rise sharply during 2023-24 if interest rates in America do not come down soon.
YCharts – Wireless Carrier Interest Expense (Quarterly), Past 3 Years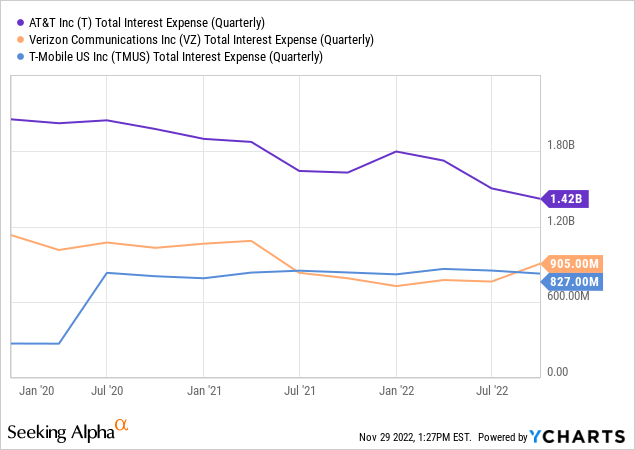
Lastly, trailing 12-month cash flow to debt numbers are starting to improve (as the positive effect of its restructuring will take another six months to be fully represented), but should remain a lower/weaker ratio than either Verizon or T-Mobile.
YCharts – Wireless Carrier Cash Flow to Debt (Rolling Annual Rate), Past 12 Months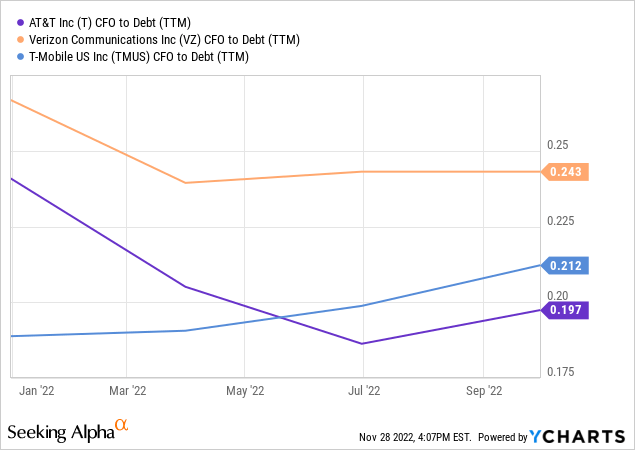
Today, trailing free cash is running at its lowest rate since 2015, partly the result of its restructuring, partly from heightened levels of spend on 5G network buildout. With still excessive debt levels on reduced business size (post WBD spinoff), the ratio of free cash flow to interest expense is the lowest since the 2001-02 recession.
YCharts – AT&T Free Cash Flow Comparison to Interest Expense, Since 1993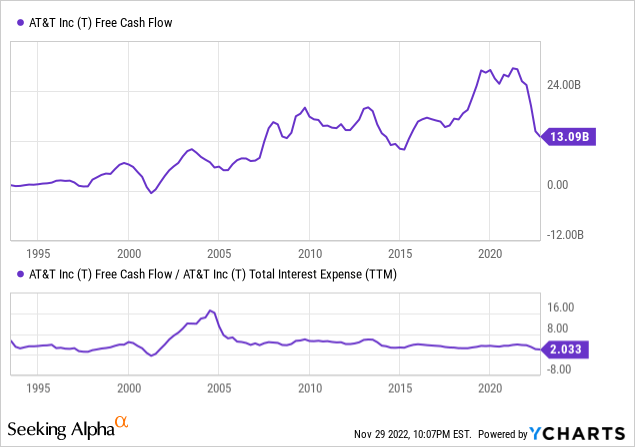
Punk Growth Estimates Before Recession Hits
Falling around -25% on the spinoff in 2022, EPS and sales are not expected to grow at all in 2023-24. The current assumption by Wall Street analysts is the economy will survive just fine next year, which may prove on the optimistic side of reality.
Seeking Alpha Table – AT&T Analyst Consensus Estimates, November 28th, 2022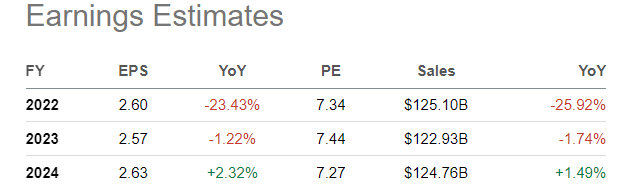
This stagnant EPS projection is the same as Verizon’s forecast, both widely underperforming strong expected income growth at T-Mobile in future years.
YCharts – Wireless Carrier EPS Growth Rates, Analyst Consensus Estimates for 2022-24, November 29th, 2022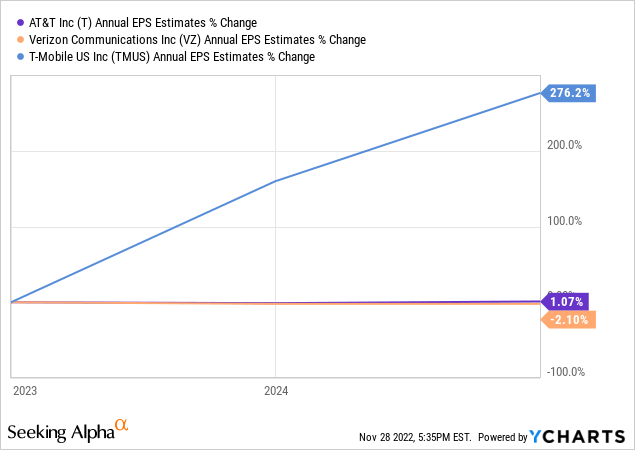
The main reason T-Mobile’s income should increase is its 5G network investment is further along nationally, and slight profit margins to attract customers (charging lower monthly usage fees) leave room for higher selling prices at less expense. Of course, if a major price war erupts, today’s estimated T-Mobile operating profitability spike will prove on the high side, just like AT&T and Verizon.
YCharts – Wireless Carrier Trailing 12-Month Net Profit Margin, Since December 2021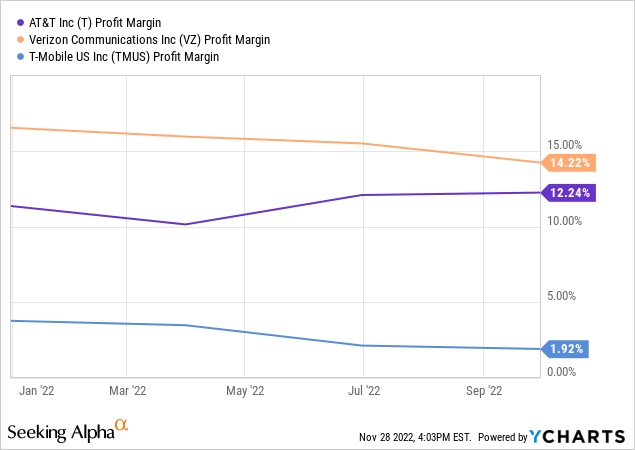
Trading Chart Pattern
I have a Neutral rating on the momentum chart for AT&T. The share quote and dividend payouts in combination have outlined a small net loss for investors over the last 18 months, pictured below with daily price and volume stats. The total return loss (historical prices have been reduced to reflect each dividend payment) is about the same as the S&P 500 over this span.
There are some positive indicators (like the Negative Volume Index, not pictured), but most of the ones I track are neutral to bearish. I have included the blah performance in the Accumulation/Distribution Line and On Balance Volume creations on the chart.
For me to get excited about owning a Neutral chart setup, a truly positive growth story needs to be present, easily understood and proved out with logic. For AT&T a stagnant business future, at best, is not remotely desirable, when hundreds of stronger charts and business prospects are available for investment in late November.
Looking into year’s end, a price drop under $18 (the 200-day moving average) would be a bearish momentum development. If you own the company, placing a stop-loss order under the 200-day MA might be a productive idea to prevent larger investment losses in a recession scenario (which would have saved plenty of money for traders in 3 previous instances on the chart, July 2021, January 2022, and July 2022).
StockCharts.com – AT&T, Daily Price and Volume Changes, 18 Months
During recent economic downturns, AT&T has not been its usual self, namely a superb defensive name to conserve capital. Too much debt has dragged on share performance during the original Dotcom Technology bust of 2000-03, Great Recession of 2007-09, and COVID-19 pandemic closure period of early 2020. All three spans are drawn below. Total returns largely mimicked the S&P 500 during the early century bust, followed the S&P 500 and Invesco NASDAQ 100 ETF (QQQ) during the Great Recession, then cratered relative to alternatives under COVID-19 pressure.
YCharts – Wireless Carriers vs. S&P 500 and NASDAQ 100 ETF Total Return Performance, November 2000 to July 2002, Recession Shaded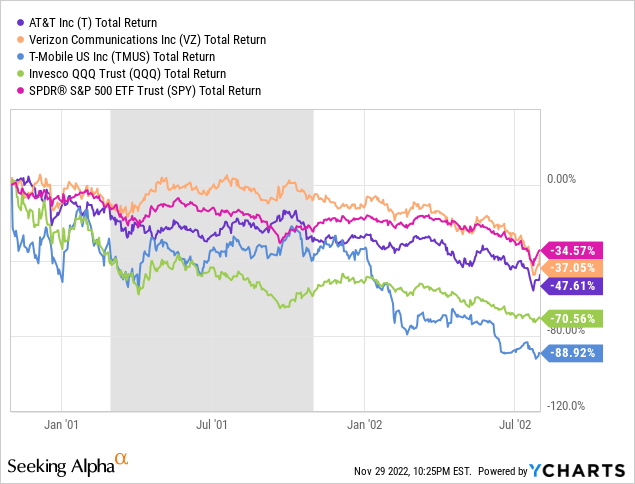
YCharts – Wireless Carriers vs. S&P 500 and NASDAQ 100 ETF Total Return Performance, June 2007 to June 2009, Recession Shaded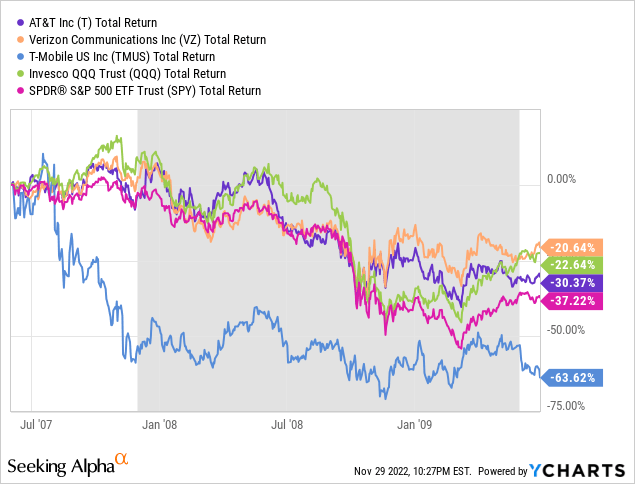
YCharts – Wireless Carrier vs. S&P 500 and NASDAQ 100 ETF Total Return Performance, October 2019 to October 2020, Recession Shaded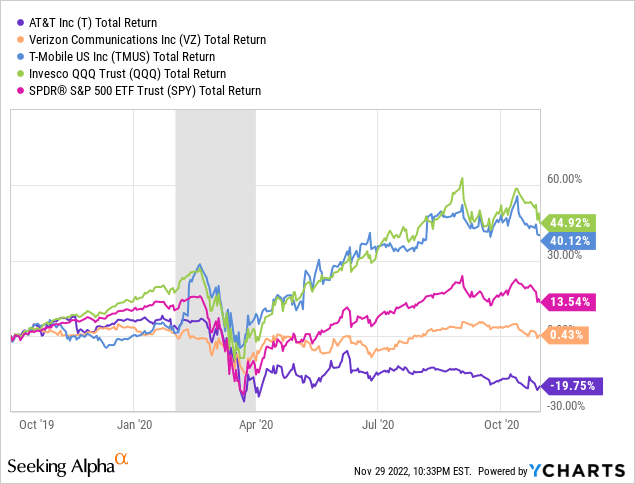
Final Thoughts
I will say I do like the AT&T 1 GIG+ Fiber service for internet access. I am using it right now to send this article to Seeking Alpha. Google Fiber is in my neighborhood for the same price and speed, but I have never had any qualms over AT&T reliability. If it ain’t broke, why fix it? My family pays T-Mobile for 5G phone service as a company cell tower is just down the street from our house and the cost per line/phone is somewhat cheaper than AT&T offerings.
AT&T Homepage – Christmas Deals, November 29th, 2022
Those wildly bullish on AT&T, don’t have real data or history to back up their enthusiasm. Could I be wrong, and the economy actually grow next year? Perhaps. For example, an abrupt end of Russia’s war in Ukraine with a related collapse in oil/gas prices would help consumer/business confidence, while injecting new disposable income into everyone’s pocket (plus create disinflationary forces to drop interest rates). So, there are potential bullish scenarios for the U.S. economy and equity market in 2023, absolutely benefiting AT&T’s valuation and business income future.
Still, if a positive economic outcome fools everyone, other stocks like the Big Tech names will surely rebound faster than AT&T. The bad news to contemplate is sizable downside “risk” is part of the current Ma-Bell investment puzzle. What if consumer spending craters and a wireless price war decimates operating profitability soon, with another dividend cut hotly debated in 6-12 months?
The odds of some sort of recession are nearing 100% in 2023, based on the successful forecasting history of the Treasury market inversion in yields (where short-term rates are higher than longer-duration ones at the greatest spread in 40-years during November). If you want more logic and a deeper explanation of the yield curve inversion problem, I have written three articles since late October on the subject. The inversion could be a reason for bullishness on long bonds here, while projecting a lower Dow Jones Industrial Average in early 2023 here and S&P 500 Index over time here.
When you calmly weigh all the pros and cons, the highest rating I can give AT&T is a Hold/Neutral setting. I would definitely not add (buy) shares around $19. My best-case scenario over the next 12 months is AT&T outlines a total return of +30% with price as high as $23. Under worst-case estimates including a deep recession and halving of income levels, AT&T could decline -50% in price and generate a total return around -45%. The most likely zigzag is a relatively flat total return (including a slight price decline) in 2023, similar to trading results for many years running. I personally have not owned AT&T over the last six years. I have no inclination to pull the trigger and buy AT&T anytime soon.
Thanks for reading. Please consider this article a first step in your due diligence process. Consulting with a registered and experienced investment advisor is recommended before making any trade.
Be the first to comment