

Dzmitry Dzemidovich/iStock via Getty Images
Thesis
Benjamin Graham’s classic, The Intelligent Investor, has transformed buying stocks from speculation into disciplined decision-making. The transformation is enabled by a set of simple, yet effective and timeless, criteria for stock selection. And with all the current uncertainties surrounding AT&T (NYSE:T), it is especially important and timely that we revisit these first principles. In particular, here are the key “rules” that Graham developed for defensive investors:
- Each company selected should be large, prominent, and conservatively financed. The specific metrics to look for are stable financial strength, consistent capital structure, and a long record of continuous dividend payments.
- Especially the dividend record. Graham emphasized countless times the importance of dividend records – for good reasons. In his own words,
“… one of the most persuasive tests of high quality is an uninterrupted record of dividend payments going back over many years. We think that a record of continuous dividend payments for the last 20 years or more is an important plus factor in the company’s quality rating. Indeed the defensive investor might be justified in limiting his purchases to those meeting this test.”
- An adequate level of Earnings Growth. For defensive investors, growth is not the key and “adequate” is enough. In Graham’s mind, a minimum increase of at least one-third in per-share earnings in the past ten years is adequate enough.
- Finally, moderate valuation multiples. As a value investor to the core, he also recommended a series of methods for investors to gauge the price they should pay. And also being fully aware of the uncertainties in his own method, he emphasized that you should always leave a safe margin of safety.
The goal of this article is to examine T against each and every one of these rules. And you will see that T checks off all the boxes. In particular, as you can see from the table below, its current market price is less than half of the Graham number (51% discount to be exact). And its current PE is also less than half of the Graham PE (discounted by 53%).
Source: Author based on Seeking Alpha data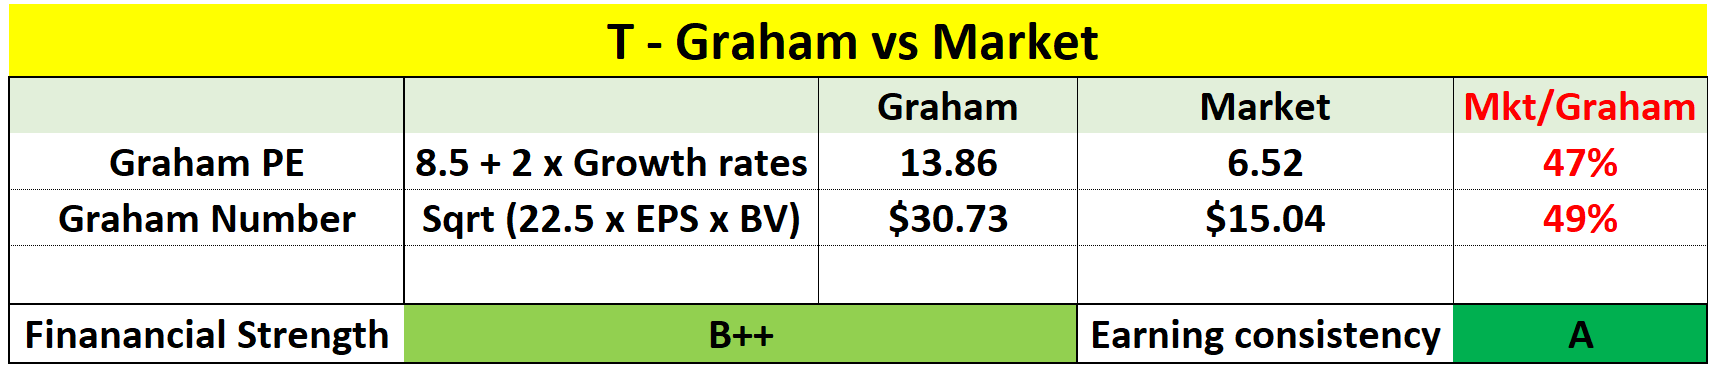
A large and prominent company that is conservatively financed
There is little need to justify T’s size and prominence. It is one of the world’s largest telecom carriers and the largest one in the U.S. by revenue. By market cap, it is slightly lower than Verizon ($113.52B vs 165.47B). But by revenue, it is larger ($156.60B in 2021 vs VZ’s $134.33B).
Although many potential investors may have a concern about its financial strength. Admittedly, T has been bearing a large debt load in the past. Shortly before the WarnerMedia spinoff, its long-term debt exceeded $200 billion as you can see from the following chart. However, when put under perspective, its current leverage ratio is totally within the normal range as seen in the bottom panel of the chart. Its debt/EBITDA ratio varied from as low as 1.52x to as high as 4.93x over the years with an average of 2.87x. Its current leverage ratio of 3.1x is quite close to the average and squarely within the range of fluctuation.
Source: Seeking Alpha data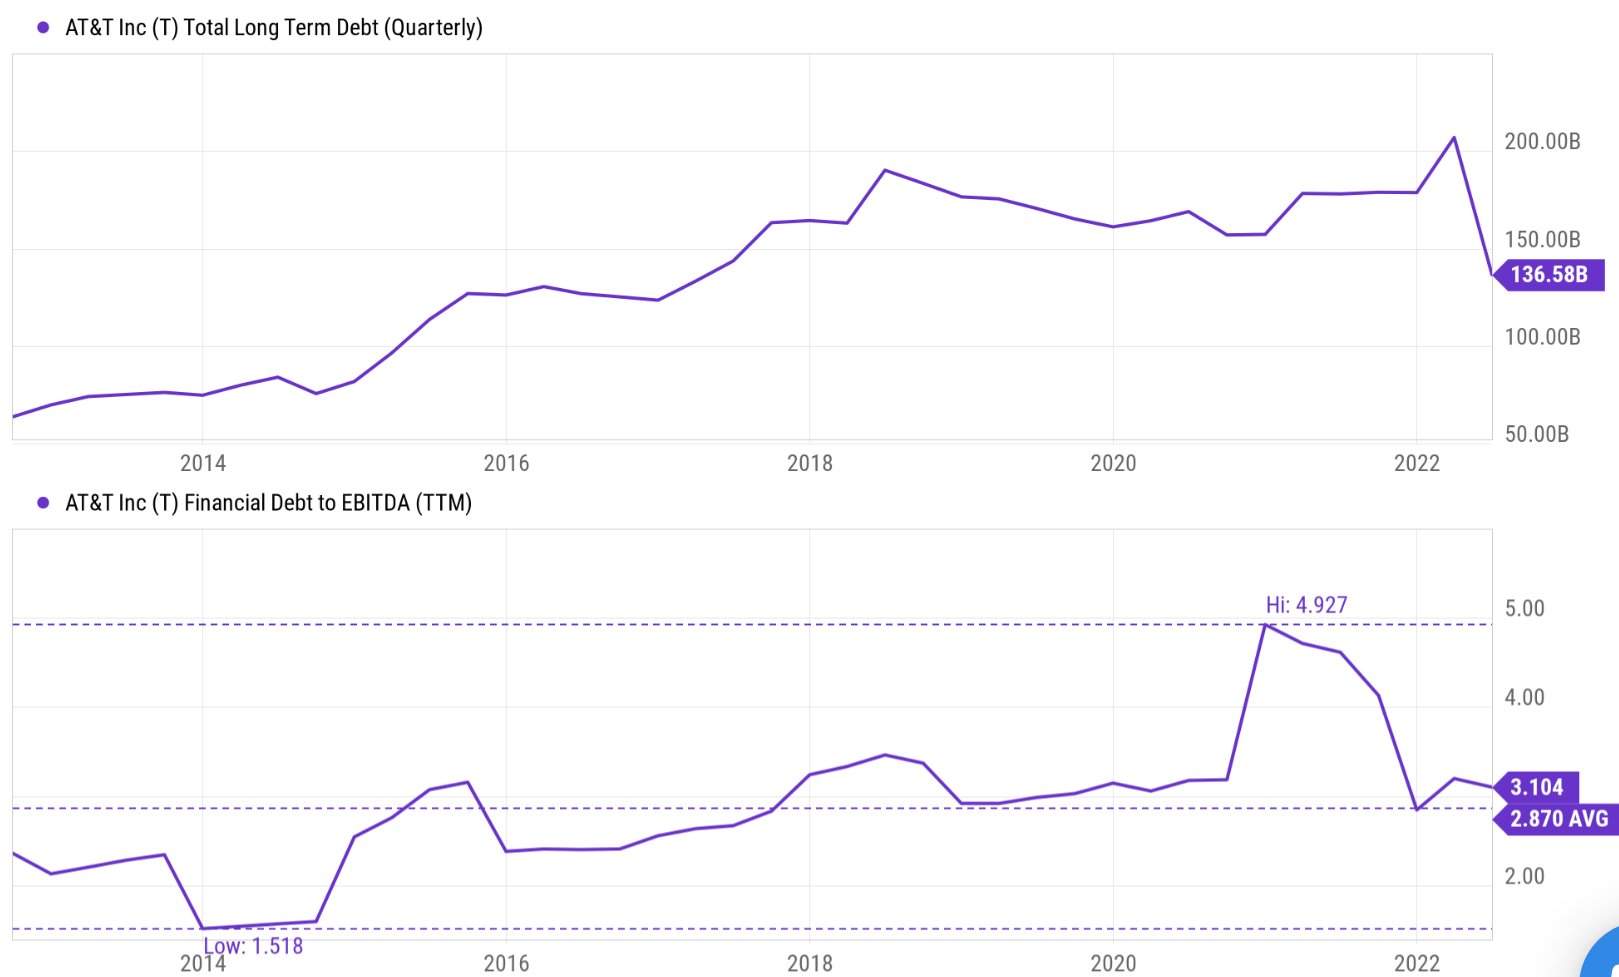
The Warner spinoff further strengthened its financial position. As detailed in my earlier analysis,
T received roughly $43 billion (a mix of cash, debt securities, and WarnerMedia’s retention of debt) in the transaction and used most of it to pay down debt. The company also repaid $10 billion in short-term bank loans earlier this year. Such deleveraging alone can cut enough interest expense and expand the margin by about 115 bps. At the same time, it will also allow T to better focus on its core areas such as 5G and fiber. And it indeed has earmarked $24B in Capital Investment in 20022 and 2023. At the same time, management aims at reducing the debt-to-EBITDA to the 2.5x range by end of 2023, which is a very feasible goal in my view.
Source: T earnings report slides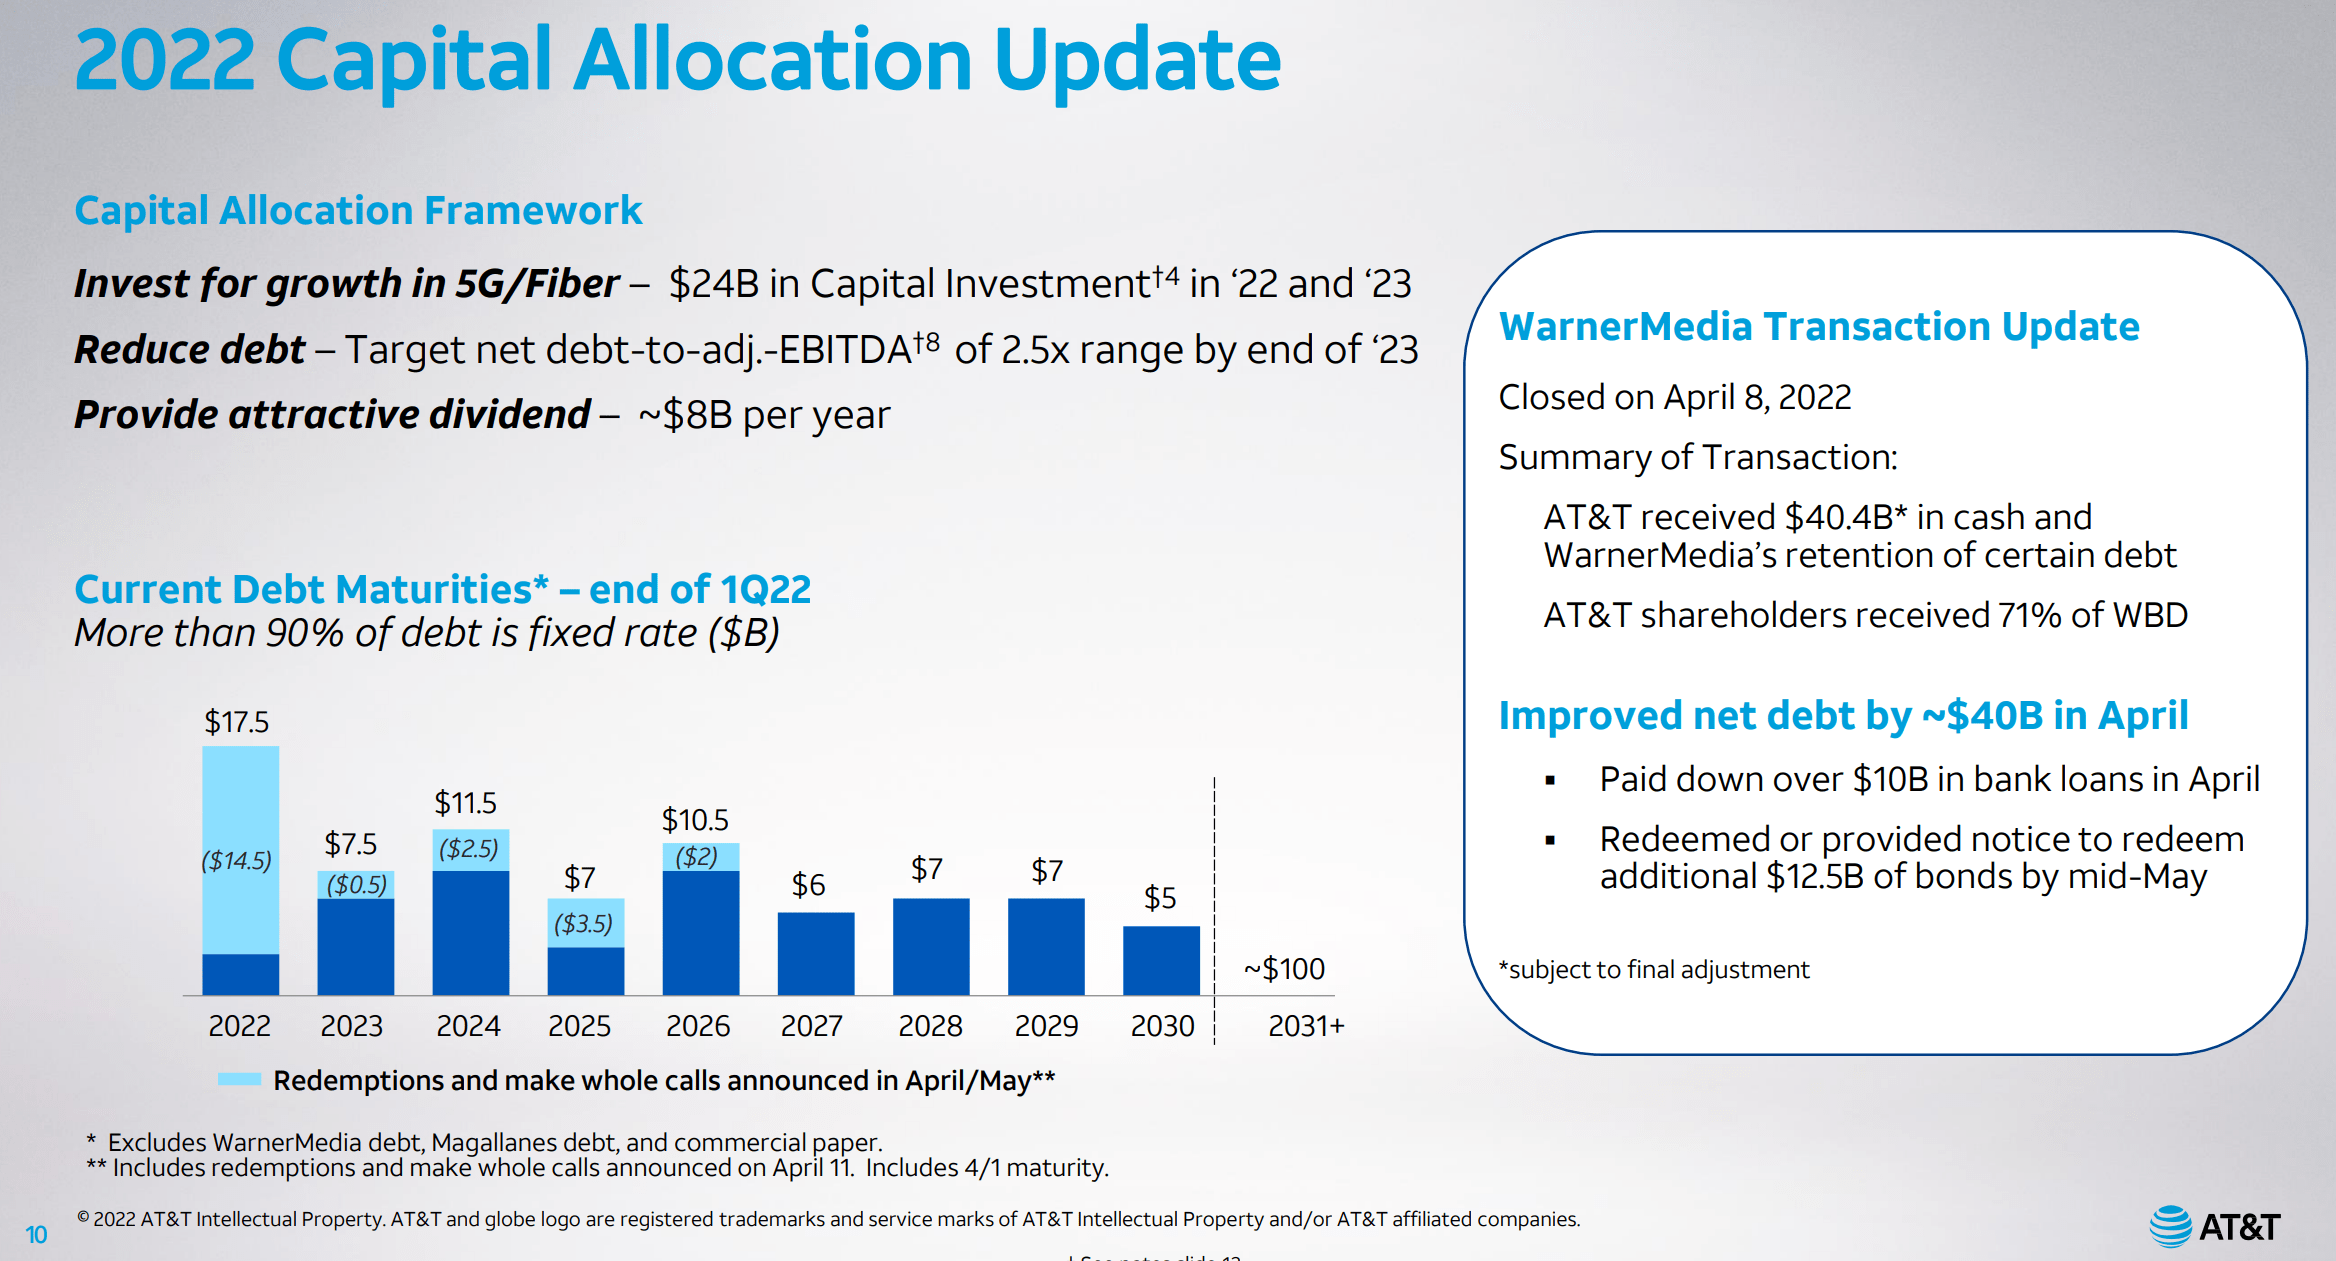
A strong dividend record
This is another easy box to check off. Graham views a record of continuous dividend payments for the last 20 years as a huge plus. In T’s case, the record is much stronger than 20 years of continuous dividend payments. AT&T was (or still is – depending on your point of view) a dividend aristocrat with an incredible 34 consecutive years of dividend hikes behind itself. The hike paused recently as you can see from the following chart only because of the WarnerMedia spinoff.
Source: Author based on Seeking Alpha data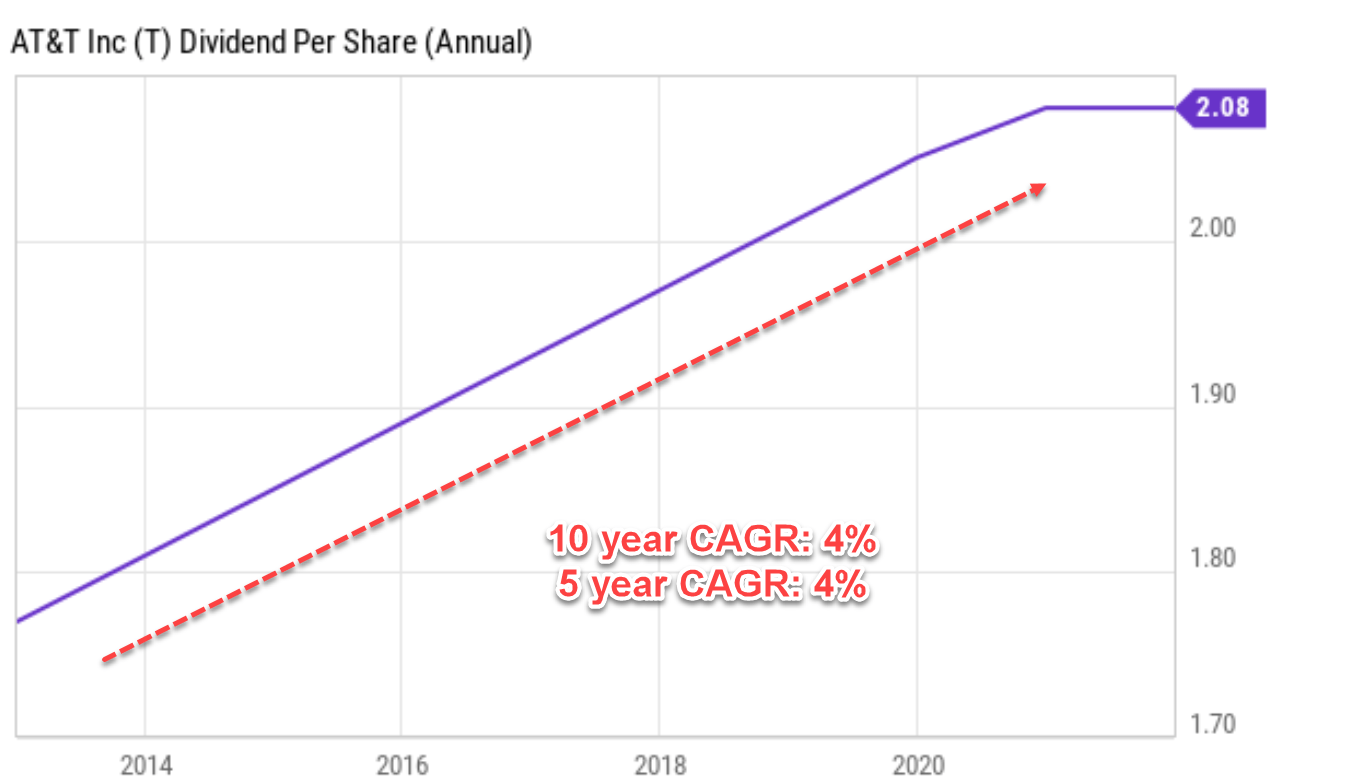
An adequate level of earnings growth
As aforementioned, Graham’s definition of adequate growth is simply an increase of at least one-third in EPS in the past ten years, which translates into about 2.89% CAGR. And T again meets this requirement with no problem. As seen from the chart above, using its dividend as an earning metric, it has been growing in the past five years and also ten years at a 4% CAGR, far exceeding Graham’s requirement of 2.89%. And in my mind, the dividend is the most reliable metric for earning power because it has the least amount of ambiguity and is totally free from subjective interpretation.
A moderate valuation
Finally, as a value investor to the core, Graham recommended a series of methods for investors to gauge the price they should pay. Here we will examine two of them (the other methods he recommended essentially paint the same picture).
First, he recommended the PE for a defensive stock should be around 8.5 plus twice the expected annual growth rate, which I call the Graham PE. So in his mind, a business that completely stagnates should be worth about 8.5x PE. And in T’s case, consensus estimates project its earnings growth rates of 2.68% in the next 5 years as seen from the chart below. Based on this growth rate, the Graham PE would be 13.68x (which equals 8.5 + 2 * 2.68). Compared to its actual PE of 6.25x, its market valuation is less than half (only 47% to be more exact) of the Graham PE.
Source: Author based on Seeking Alpha data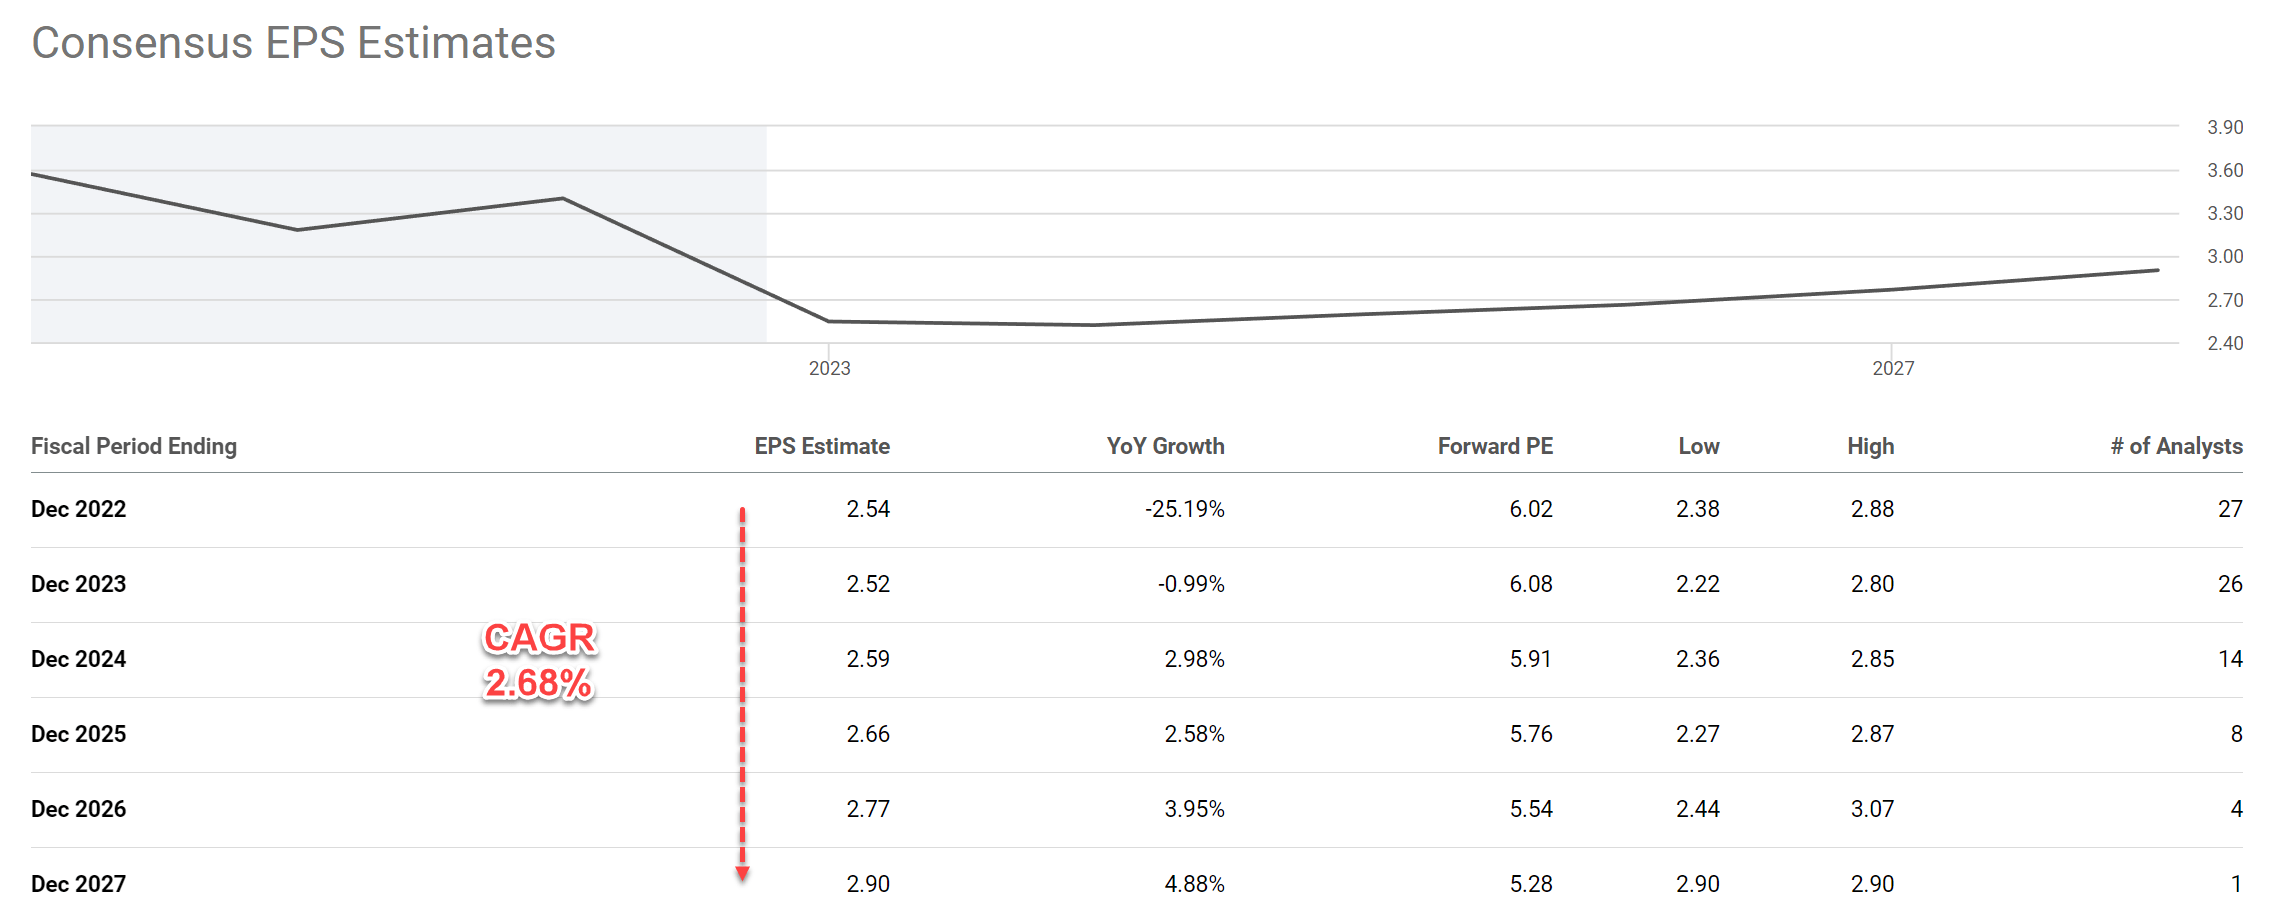
Graham of course is fully aware of the uncertainties in his own methods. That is why he developed several methods for cross-checking purposes.
For example, he is fully aware that for businesses with considerable assets (like T), the PE metric might be partial and misguiding. That is why we will also check the so-called Graham Number. In general, Graham cautions against paying a price of more than 15x earnings or more than 1.5x the book value (“BV”). However, a PE multiple above 15x could be justified if the P/BV ratio is lower than 1.5x. And vice versa. And as a result, the Graham number considers both the 15x PE limit and the 1.5x P/BV limit. More specifically, the Graham number is the square root of A) 22.5 (which equals 15 times 1.5), B) the EPS, and C) the book value.
The inputs and results of the Graham number are listed in the table below. All the financial and price information was taken from Seeking Alpha as of Oct 7. As seen, the Graham number worked out to be $30.73 for T. At its current market price of $15.04, the stock is for sale at a 51% discount.
Source: Author based on Seeking Alpha data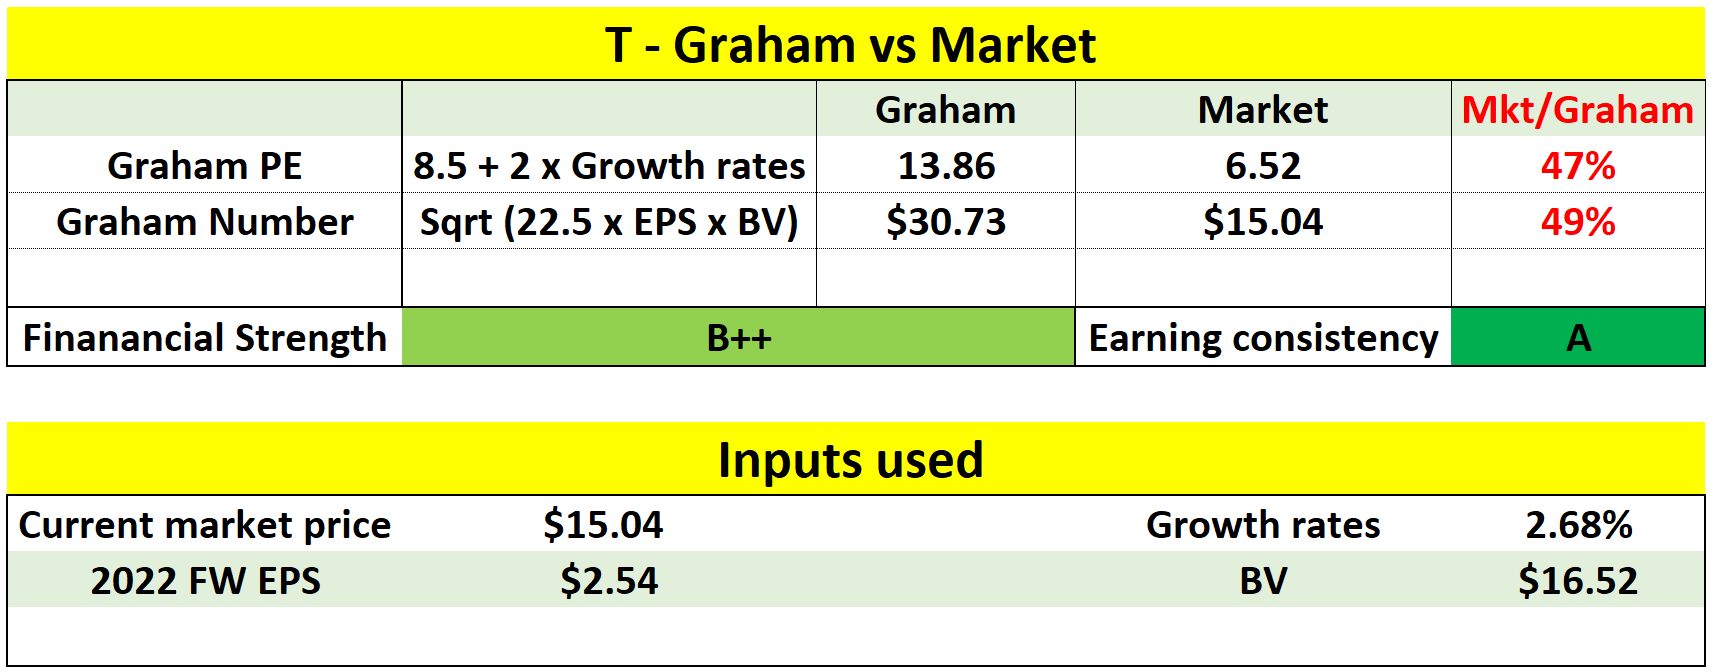
Risks and final thoughts
To reiterate, there is no lack of uncertainties for T in the near term – both in terms of macroscopic risks and risks particular to T. Macroeconomic risks include geopolitical tensions, inflation, interest rates, or full-scale recession. Specifically for T, its nonrecurring charges such as debt repayment, restructuring, and asset impairments are expected to persist into the near future. Its 5G and fiber CAPEX requirement will remain high for a while and its free cash flow will be under pressure in the meantime. All of these uncertainties translate into extreme volatilities – both in terms of its stock prices and its valuation metrics over the recent past. Take its price/cash flow ratio as an example. It has plunged from a peak of 6.2x to the current 2.9x, a swing of more than 200% in less than 5 years.
However, with uncertainties like these, it is especially important and timely that we go back to check the basics. An examination against the timeless principles Benjamin Graham developed helps us to gain a better perspective. And in T’s case, it checks off all the key Graham requirements for defensive stocks. Surely there could be surprises, and there are aspects uncovered by the Graham criteria examined. That is where the margin of safety comes in. With a 50%+ margin of safety, there is less room for surprises, and if surprises do occur, they do not hurt much.
Be the first to comment