

Ronald Martinez/Getty Images News
Thesis and Background
The current valuation of AT&T (T) has become too attractive to ignore. With its projected earnings in the range of $3.10 to $3.15, its current valuation is only about 7.8x FW PE. Such a valuation essentially views it as a terminally stagnating business. Yet shareholders will be starting to reap the benefits from many positive catalysts, such as the rollout of 5G, the asset from the Discovery ownership, and our secular growth of data use.
Considering these factors, our estimate is that it would be worth about $45 in about two years. Our estimation is based on an operating cash flow of around $6.5 per share and a valuation of 7x cash flow.
However, in the near term, you should be rightfully concerned about its challenges ahead, especially the implications of its recent decision to cut dividends by almost a half and its capital allocation flexibility after the WarnerMedia Brothers spinoff. Therefore, this article focuses on these issues to help you decide if it fits your risk tolerance.
Dividend cut and capital flexibility
To put its recent dividend cut into perspective, let’s first look at its past historical record. Even after the dividend cut, AT&T would still be offering an attractive dividend yield of about 4.6% at its current price. The following chart shows AT&T’s payout ratio in terms of earnings and cash flow. As seen, AT&T has been doing a consistent job of managing its dividend payout in the past. The payout ratios have been on average 87% and 31%, respectively, in terms of earnings and cash flow – a relatively safe and comfortable range for a utility-type stock. The dividend cut following the WarnerMedia spin-off is aimed at maintaining the same historical payout ratios, and we will see later whether T can actually achieve this goal or not.
Author based on Seeking Alpha data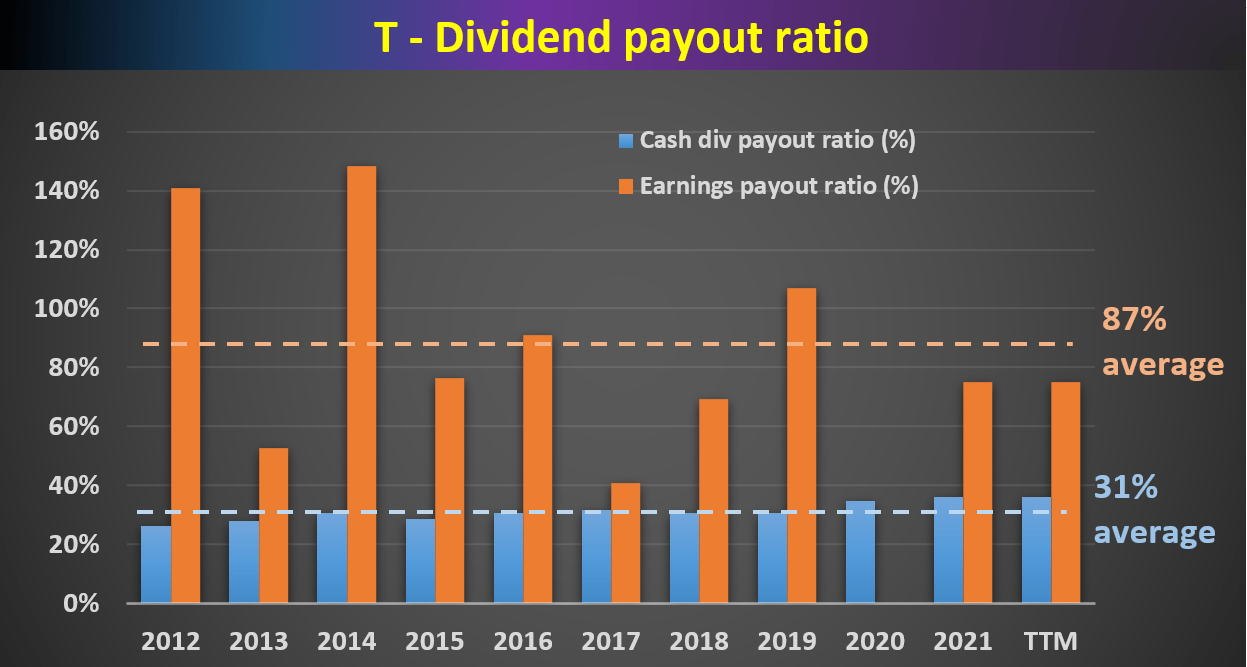
The above payout ratios we commonly quote enjoy simplicity, and we also like to go a step further for a more comprehensive assessment, especially for a stock like AT&T whose debt burden is high and who is also going through a transaction. As detailed in my AGNC article here, the major limitations of the above simple payout ratios are twofold:
- The simple payout ratio ignores the current asset that a firm has on its balance sheet. Obviously, for two firms with the same earning power, the one with more cash sitting on its balance sheet should have a higher level of dividend safety.
- The simple payout ratio also ignores the upcoming financial obligations. Again, obviously, for two firms with the same earning power, the one with a lower level of obligations (pension, debt, CAPEX expenses, et al) should have a higher level of dividend safety.
The above simple payout ratios ignore all these important pieces. For a more advanced analysis of dividends stocks, we find the so-called dividend cushion ratio an effective tool. A detailed description of the concept can be found in Brian M. Nelson’s book entitled Value Trap. And a brief summary is quoted below:
The Dividend Cushion measure is a ratio that sums the existing net cash (total cash less total long-term debt) a company has on hand (on its balance sheet) plus its expected future free cash flows (cash from operations less all capital expenditures) over the next five years and divides that sum by future expected cash dividends (including expected growth in them, where applicable) over the same time period. If the ratio is significantly above 1, the company generally has sufficient financial capacity to pay out its expected future dividends, by our estimates. The higher the ratio, the better, all else equal.
Note that our following analysis made one revision to the above method. Instead of subtracting the total long-term debt, we subtracted the total interest expenses over a past five-year period. The reason for this revision is to adjust for the unique capital structure of a utility business such as AT&T. A mature utility business probably will never have the need to repay all of its debt at once. But it does need to have enough earnings to service its debt (i.e., cover the interest expenses). With this background, the dividend cushion ratio for AT&T is calculated and shown below.
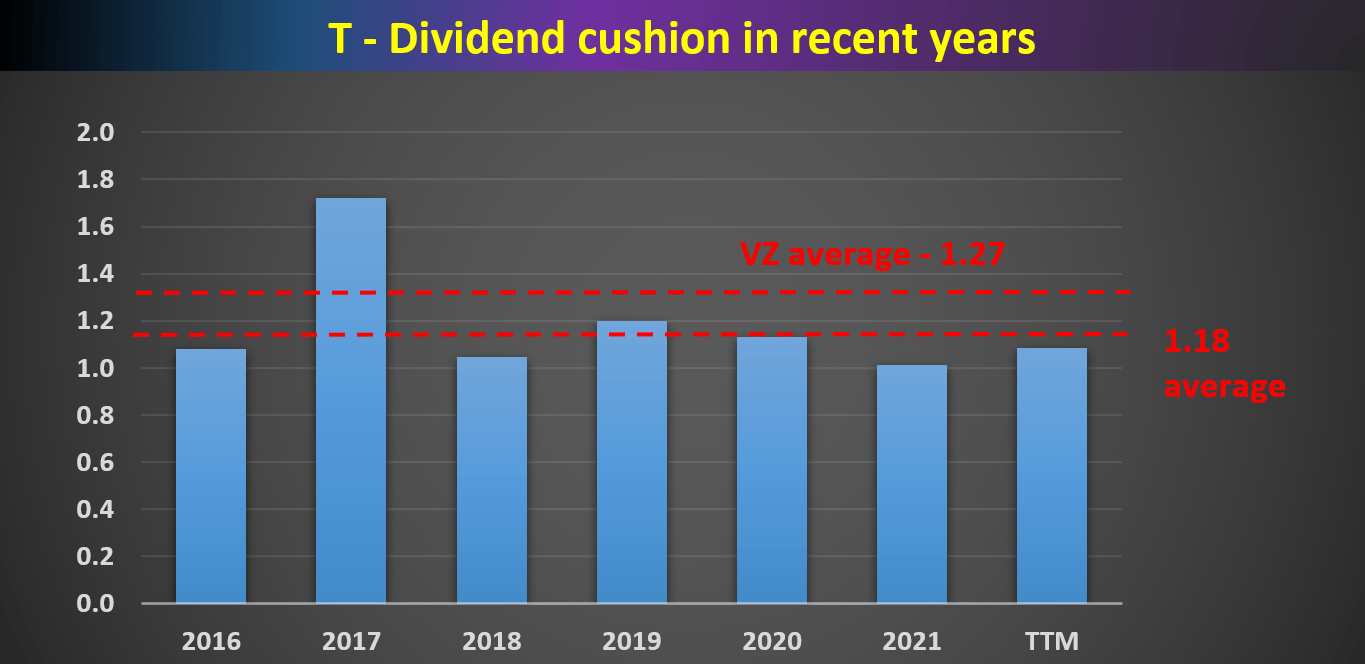
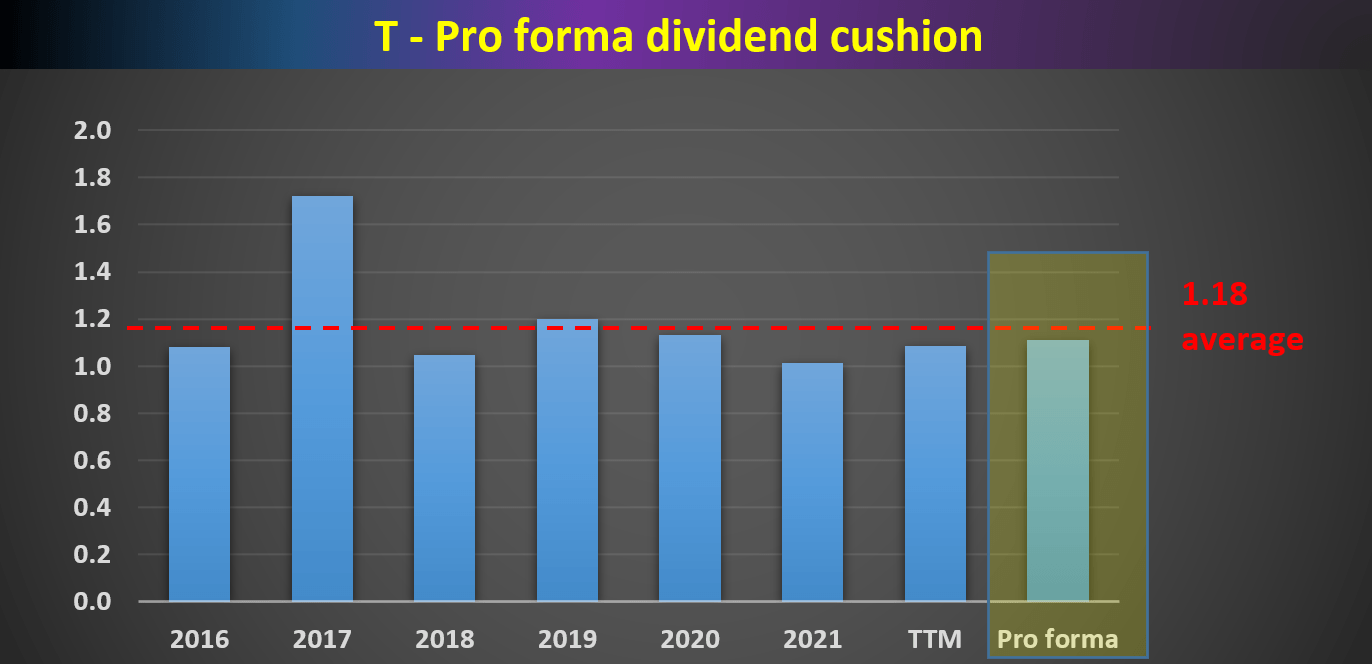
The analyses are shown in the table below and also the chart below for more visual-oriented readers. As can be seen, AT&T has been maintaining an average dividend cushion ratio of 1.18. It is significantly above 1, confirming its safe dividend payout in the past. And to put things under perspective, the dividend cushion ratio for Verizon (VZ) has been averaging 1.27, higher than AT&T by a good margin. Also, you can see that the dividend cushion ratio is currently 1.09, slightly below its historical average level.
Author based on Seeking Alpha data Author based on Seeking Alpha data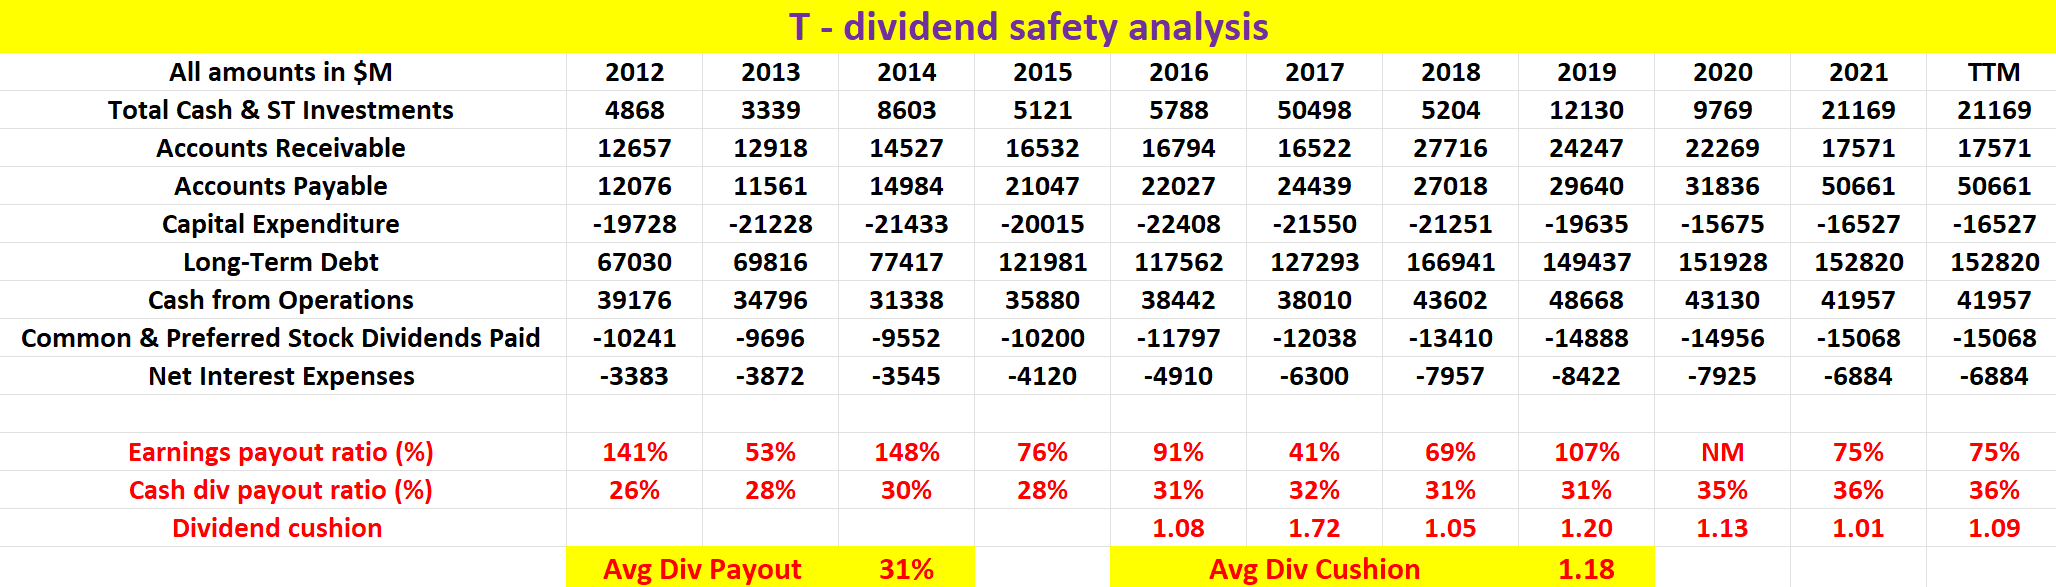
Pro forma analysis post-WarnerMedia spinoff
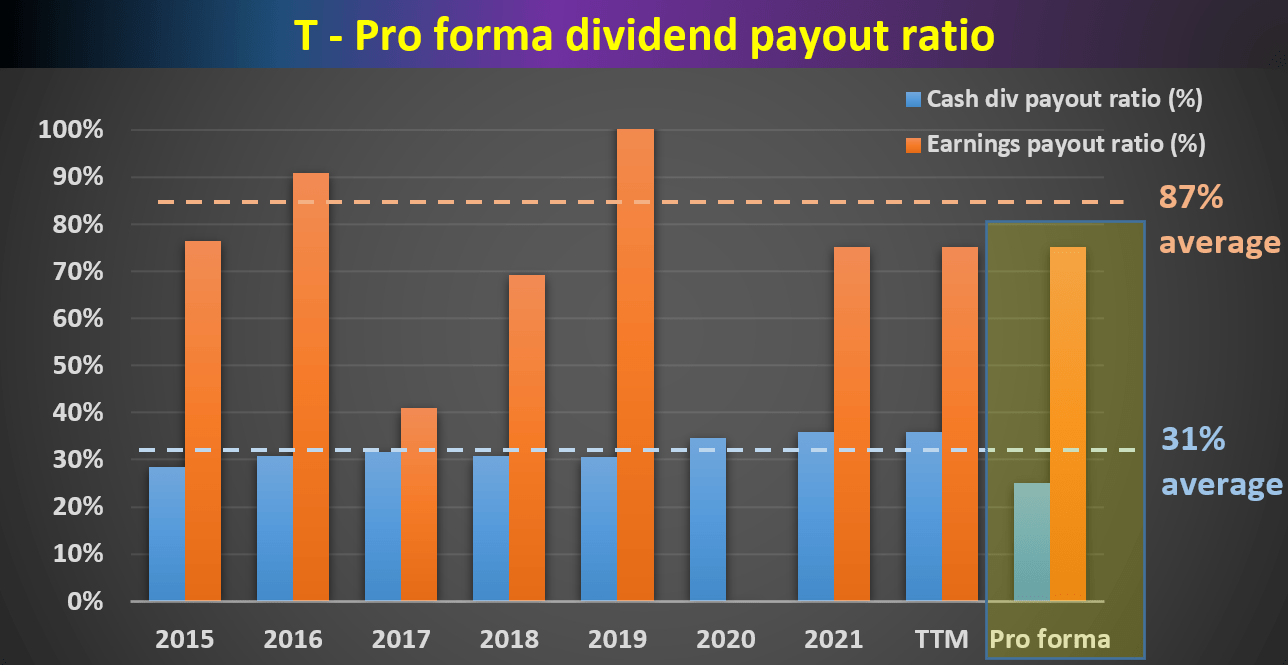
Now looking forward, what are the implications of the dividend cut and WarnerMedia Spinoff on AT&T’s future dividend safety and capital allocation? The following table shows our pro forma analysis. This analysis relied on the following three key inputs:
- The post-spinoff annual dividends are $1.11 per share, translating into a total of $8 billion a year on dividend payouts.
- The WarnerMedia transaction will bring in cash proceeds of about $43 billion (as a side note, this is about half of the $85.4 billion in cash and stock AT&T paid in 2018 to acquire the former Time WarnerMedia Inc.). And we assume AT&T applies the proceeds to pay down debt.
- WarnerMedia contributed $9.87 billion or 24.1% of AT&T’s operating revenues in 2021. And we will assume that AT&T’s operating cash flow will decrease by about 24% after the spinoff.
Under these inputs, as you can see, AT&T will be able to slightly improve its dividend cushion ratio, from the current level of 1.09 to a pro forma level of 1.11. However, such an improvement is too small. It is still far below VZ’s level for example. The dividend cut can help to stabilize its finances, but it still needs to improve its profitability, find other revenues sources to fund its capital projects, and stay competitive among peers, as elaborated next.
Author based on Seeking Alpha data Author Author
Risks and other considerations
1. Capital spending. The telecom space is notorious for its intensive capital spending. For example, AT&T spent almost $13 billion in capital expenditures in the first 9 months of 2021, which helps to put its post-deal dividends of $8 billion per year in perspective. However, even this level of capital expenditure won’t be enough to keep AT&T competitive. AT&T currently spends about 10% of its operating revenue on capital expenditures. In contrast, over the same period, Verizon spent about 14% of its revenue on CAPEX, while T-Mobile (TMUS) allocated a whopping 22% of revenues to property and equipment.
2. Competition landscape. After the spinoff, AT&T competes directly with other major players like Verizon and T-Mobile. The next chart provides an overview of the basic profitability metrics. When compared to its peers, AT&T is reasonably profitable in recent quarters. For the 5G rollout, rival carriers, especially T-Mobile, have a lead in terms of deployment of new spectrum and technology to add coverage and capacity. It remains uncertain whether its profitability can substantially improve after the spinoff, the merger, and the rollout of 5G.
Author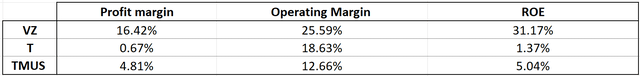
3. Interest rates risks. Interest rate risk. AT&T relies on debt financing to a substantial degree and its current long-term debt is about $155B. Even assuming it uses all $43 billion proceeds from the WarnerMedia spinoff to reduce debt, its debt would still be about $112 billion. Hence, a 1% increase in its interest rate would translate into $1.12B of additional interest expenses. Its net earnings are projected to be about $22.5B after the spinoff. Therefore, the additional interest expenses are about 5% of its net earnings, a relatively small but non-negligible risk given the Fed’s hawkish plan.
Conclusion and final thoughts
The current valuation of AT&T is too attractive to ignore. At only about 7.8x FW PE, the market essentially views it as a terminally stagnating business. Yet several positive catalysts can help it to grow, such as the rollout of 5G, the asset from the Discovery ownership, and our secular growth of data use.
We think all the negatives have been priced in, and investment here has favorable odds for a sizable return. Our target price is about $45 in about two years based on an operating cash flow of around $6.5 per share and a valuation of 7x cash flow. However, investors do need to be aware of the challenges ahead:
- Contrary to the common belief that the dividend reduction can help AT&T to better fund its capital projects such as network improvements, our analysis shows that it can really only help to stabilize dividend safety.
- After the dividend cut, its pro forma dividend cushion ratio would be 1.11, only a small improvement from its current level of 1.09. The pro forma cushion ratio would be still below its historical average level of 1.18, and lower than VZ’s average of 1.27 by a good margin. Spinning off WarnerMedia and cutting dividends are only the first steps in the right direction.
- Now is a good time to buy into the telecom sector in general. Their valuations are all at cyclical lows but business prospects are at a cyclical high. More conservative investors (like ourselves) could consider VZ for its stronger financial safety, low leverage, and more stable operation.
Be the first to comment