

Online education company Chegg, Inc. (NYSE:CHGG) is set to release earnings after the closing bell on Monday, and analysts expect the company to report earnings of $0.15 per share on revenue of $122.73 million. The EPS estimate, if accurate, would match the $0.15 the company earned in the first quarter of 2019. Based on the company’s history, I expect the company will beat that EPS estimate since it has beaten estimates for 10 straight quarters.
I wrote about Chegg ahead of its fourth quarter earnings release in February as well, and the fundamentals for the company are just as strong now as they were then. Earnings have grown by an average of 98% per year over the last three years, and they grew by 40% in the fourth quarter. Analysts do expect earnings growth to slow in 2020 with estimates for overall growth of 10%.
Revenue has increased by an average of 19% per year over the last three years, and it was up 31% in the fourth quarter. The revenue estimate for the first quarter would represent an increase of 26% over last year’s figure, and analysts expect overall revenue growth of 26.2% for the year.
The company’s management efficiency measurements are above average with a return on equity of 26% and a profit margin of 29.4%. The stock is trading with a trailing P/E of 45, and the forward P/E is just below 35. Those valuations are a little higher than average currently, but not to the point that they are scary.
One thing in particular that I am looking forward to hearing from the earnings report is how the company is doing now and how the outlook changes. The company could be benefiting from all of the distance learning that is going on around the U.S. due to the COVID-19 crisis. Most schools around the country are hosting classes remotely, and students could be looking for additional help with their classes and with their education. Chegg could be one of the beneficiaries if that is the case.
Potential Resistance Looms Just Overhead
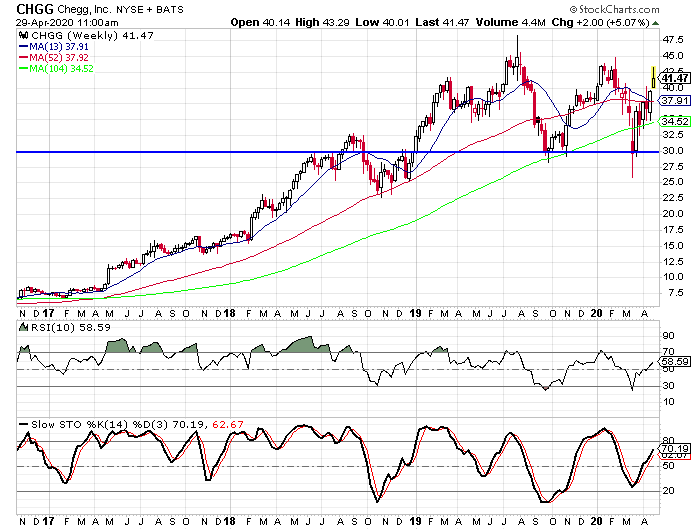
When I wrote the article in February, I was bullish for the long term, but was cautious for the period right after earnings. There has been a pattern in the stock over the last few years where the stock is lower a week or two after earnings. I was also concerned with the fact that the stock was overbought based on the 10-week RSI and the weekly stochastic indicators.
The cautious stance turned out to be warranted, as the pattern played out once again. After closing at $44.61 on February 10, the stock fell to the $36 area on February 27. The stock would bounce a little before the overall market went in to its meltdown, and then the stock fell all the way down to the $26 level. The stock closed the week of March 16 just below the $30 level and has since rallied sharply. The $30 level acted as support back in September when the stock fell below that level but didn’t close the week below it.
After the big drop, the RSI was in oversold territory and is now nearing the 60 area, but has a way to go to hit the overbought area. The stochastic indicators didn’t quite reach oversold territory in March, and they are now approaching overbought territory. These indicators have been known to remain in overbought territory for extended periods, so it isn’t a major concern.
I find it encouraging that the stock has moved back above all three of the moving averages on the chart. The S&P has moved above its 13-week and 104-week, but it hasn’t moved back above the 52-week yet. Chegg is a little ahead of the overall market in this regard.
The $45 area marked the high in February, and the stock had trouble closing above that level last July. This area could mark a key resistance point, but a break of that price could allow the stock to break out.
The Short Interest Ratio Is Still Really High
Turning our attention to the sentiment analysis, one of the things I liked about Chegg back in February was the high short interest ratio. As a contrarian, I find it encouraging when there is some form of pessimism displayed toward a stock. It means that not everyone is already bullish, and there is still room for the stock to move higher.
The short interest ratio was at 14.9 in February, and it is at 8.5 currently. Like most stocks, the short interest ratio is down over the last few months, but for Chegg, the ratio is still extremely high compared to other stocks. There were 18.83 million shares sold short back then, and there are 17.47 million shares of short interest now. The average daily trading volume has jumped from 1.26 million to 2.05 million.
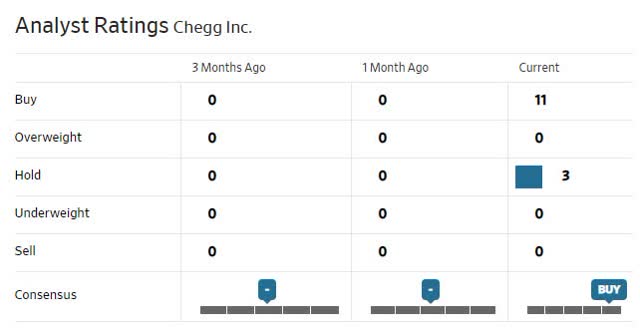
Analysts are skewed to the bullish camp at this time with 11 out of 14 analysts rating the stock as a “buy”. The other three have the stock rated as a “hold”. This gives us an overall buy percentage of 78.6%, and that is slightly higher than average. The buy percentage is slightly lower than it was in February when 12 out of the 14 analysts had the stock rated as a “buy”.
The put/call ratio is extremely low at 0.374. There are 5,757 puts open and 15,382 calls open at this time. All told, the open interest for all of these contracts only represents about a day’s worth of average trading volume. Chegg’s put/call ratio is far lower than the average stock’s ratio, but the low overall open interest diminishes the importance of that reading to some degree.
My Current Take On Chegg
The fundamentals for Chegg are too good not to be bullish for the long term, but the pattern after earnings makes me think you would be better off waiting a week or two after the report to buy the stock.
With the stock back above its moving averages and with the pattern in the stock, I think targeting the 52-week moving average for a possible entry seems to make sense. It would mean a pullback of approximately 10% from where the stock is now. Of course, there is the timing aspect as well where the stock has moved lower for a week to two weeks before turning higher.
If the stock does what I expect, it will also help keep the oscillators from reaching overbought territory. A small move lower over a few weeks will slow their ascent a little. If you already own the stock, I don’t expect enough of a dip to warrant taking any action to hedge or protect gains. If you are looking to buy the stock, wait a week or so and then take action. Of course, watching the moving averages for support can help also.
The $45 area has acted as a peak both in July of last year and again in February. If the stock breaks through that resistance level, I can see it moving to the $60 area in the next six to nine months.
If you would like to learn more about protecting and growing your portfolio in all market environments, please consider joining The Hedged Alpha Strategy.
One new intermediate to long-term stock or ETF recommendation per week
One or two option recommendations per month
Bullish and bearish recommendations to help you weather different market conditions
A weekly update with my views on the market, events to keep an eye on, and updates on active recommendations
Disclosure: I/we have no positions in any stocks mentioned, and no plans to initiate any positions within the next 72 hours. I wrote this article myself, and it expresses my own opinions. I am not receiving compensation for it (other than from Seeking Alpha). I have no business relationship with any company whose stock is mentioned in this article.
Be the first to comment