

Xiaolu Chu
Remembering a comment following May’s article (the weight of evidence is building for a significant drop in Tesla) that “$176 target was such a strange number I mean, why would you pick that number”. The reality is that I didn’t pick the number, the three wave theory did.
Obviously, the arrival at this target was aided by a Tesla (NASDAQ:TSLA) stock split in previous months but it is interesting to see that Tesla has completed its original bearish third wave so far at exactly that number. Just because equity transitions through a stock split the skeleton of the structure still remains the same as the original wave one, two and three will still look to complete at its original mapped target.
So, the big question remains for investors, what will Tesla do next?
No, we will examine the latest earnings news that has moved Tesla to this price point and also look at this week’s CPI data that showed before moving to the technical analysis to see if we can gauge any future price movement.
According to CNBC, Tesla’s automotive revenue came in at $18.69 billion, an increase of 55% from a year ago. Cost of revenue for the company’s core automotive business rose to $13.48 billion during the quarter, up from $10.52 billion during the second quarter, in line with the increase in automotive sales. Tesla’s automotive regulatory credits made up 1.5% of automotive revenues at $286 million for the quarter.
Tesla reiterated previous guidance in its shareholder deck on Wednesday, saying: “Over a multi-year horizon, we expect to achieve 50% annual growth in vehicle deliveries.”
The company reiterated that deliveries of its Semi electric heavy duty truck will begin in December and confirmed that it is producing the Semi in Nevada, where it produces battery packs for its vehicles in the US. The Semi was first announced in Dec. 2017.
Tesla offered no firm timeline for the start of production of its Cybertruck pickup, saying only that it would be produced in Texas after the ramp-up of Model Y production there.
Technical analysis:
Moving onto the monthly chart, we will now start from the top of the bearish third wave before trying to work our way upwards from $176.
The three wave theory states that for a financial market to make a significant move in price, it must make waves. As seen here in the chart below in bearish form, topping out at $1,242, Tesla made its wave one to $709.
Tesla monthly (C Trader)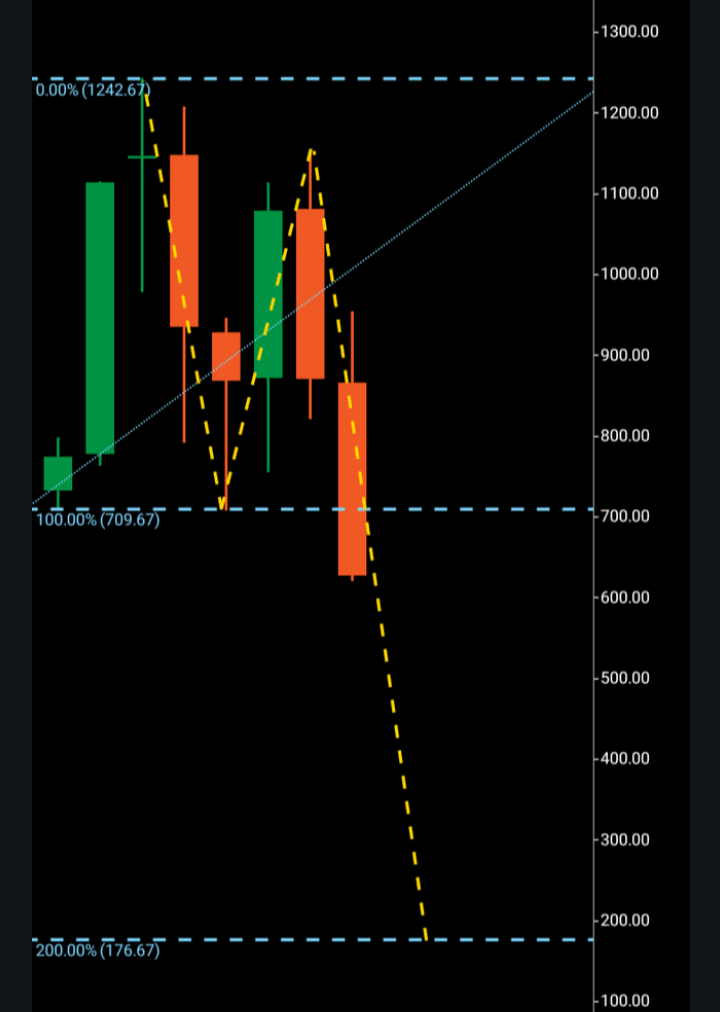
From there, this equity formed a bullish candle towards $1,200. At the time, this could have been perceived as a wave one two, but not confirmed until the break below $709 with a target of $176 should Tesla look to numerically replicate its previous path set out.
In order for a market to form a wave pattern in any direction, it must have a rejection candle. In a bullish direction, the wave two must have a bearish rejection candle that doesn’t exceed the bottoming of the wave one and in a bearish formation, the wave two must contain a bullish candle. This rejection candle is printed so that when price is carried over or below the wave one including the wave two rejection, we have a target from those preceding waves. The third wave should look to continue to print exactly the same number as the wave one/two high low, the reason we have evidence of this is that we can see the length of the wave one before it was rejected enough to pause and form the wave two thus leading to the third wave which will look to continue the exact same number before it finds a significant pause. Of course, the wave three can continue further but we have no actual printed evidence of this other than that of the former two price points between the low high/ high low of the first two waves.
Now, we can move to the weekly chart which gives further insight into what is taking place behind the monthly macro picture.
Tesla weekly (C Trader)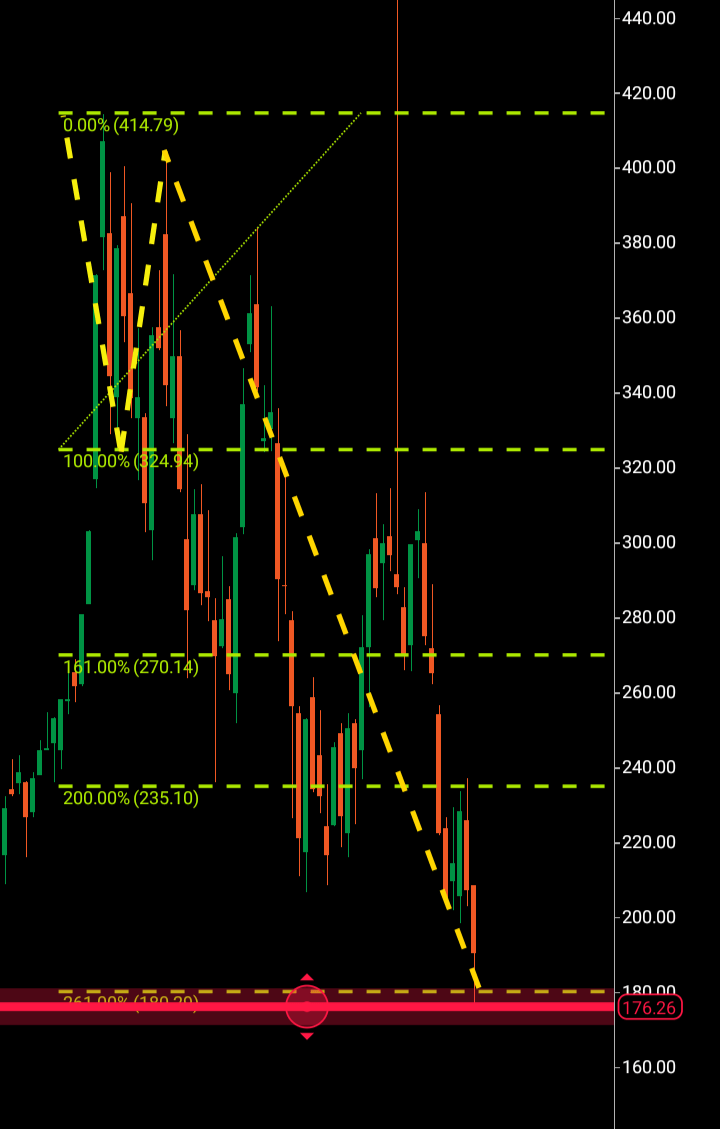
It may appear complex but this weekly structure is simply condensed from the original picture before Tesla’s stock split, so it is transferred to replicate what patterns Tesla was printing before the split. We can see once the structure was moved that the Fibonacci 261 provided confluence with the monthly structure by lying at $180. So far, we can see Tesla has dipped its toe just below that number and bounced off $176.
So, what’s next for Tesla? For the moment, I am recommending a hold until there is a clearer picture of what direction this stock would like to move in next. It is entirely plausible that Tesla has not bottomed at this number and I will be looking for wave patterns forming in the imminent future as to what lies next. It is also entirely possible that Tesla has bottomed being the second scenario and if this is the case, three wave patterns will begin to form on the lower timeframes eventually leading to the monthly. It is only when the latter happens, we will have any sort of certainty of future targets. A bullish turnaround could develop and print within the next 45-90 days. If you wish to read May’s original article, here is the link.
Be the first to comment