

Photo Italia LLC
Earnings of Arrow Financial Corporation (NASDAQ:AROW) will likely dip this year before trending upwards in 2023. Higher provision expense will likely be the chief contributor to an earnings decline this year. Strong loan growth and margin expansion will likely lift earnings next year. Overall, I’m expecting Arrow Financial to report earnings of $3.0 per share for 2022, down 3% year-over-year, and $3.35 per share for 2023, up 12% year-over-year. Compared to my last report on the company, I’ve barely changed my earnings estimate. The year-end target price suggests a small upside from the current market price. Therefore, I’m downgrading Arrow Financial to a hold rating.
Loan Growth to Decelerate to a Normal Level
Arrow’s loan book grew by a remarkable 4.0% in the second quarter of 2022 (15.8% annualized), which is by far the strongest loan growth since the second quarter of 2020. The last quarter’s performance has raised hopes that loan growth will return to the historical range of high-single-digits to low-double-digits.
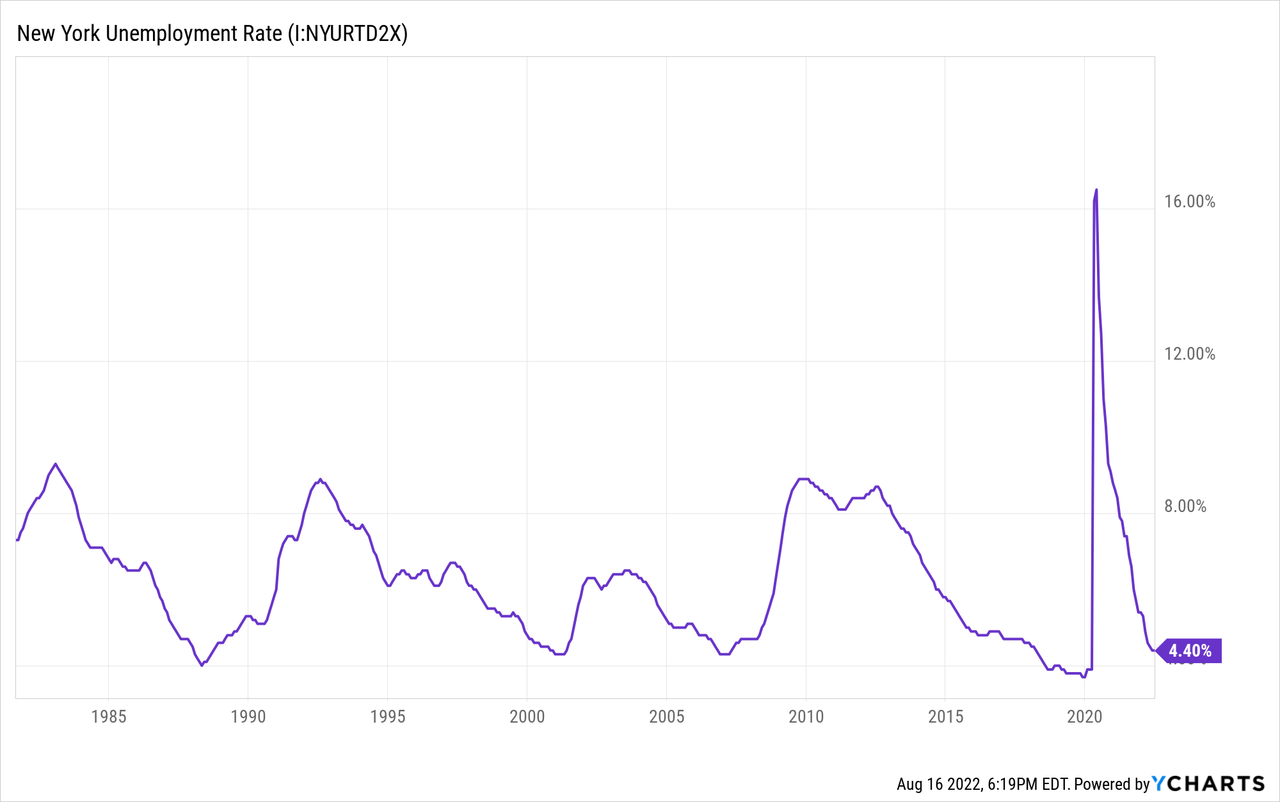
Due to economic factors, I’m expecting loan growth to slow down in the second half of the year from the second quarter’s level but remain much higher than a year ago period. Arrow operates in the state of New York, where the economy is recovering slowly. The state’s unemployment rate is worse than the national average and the trend of the coincident index isn’t as steep as before.
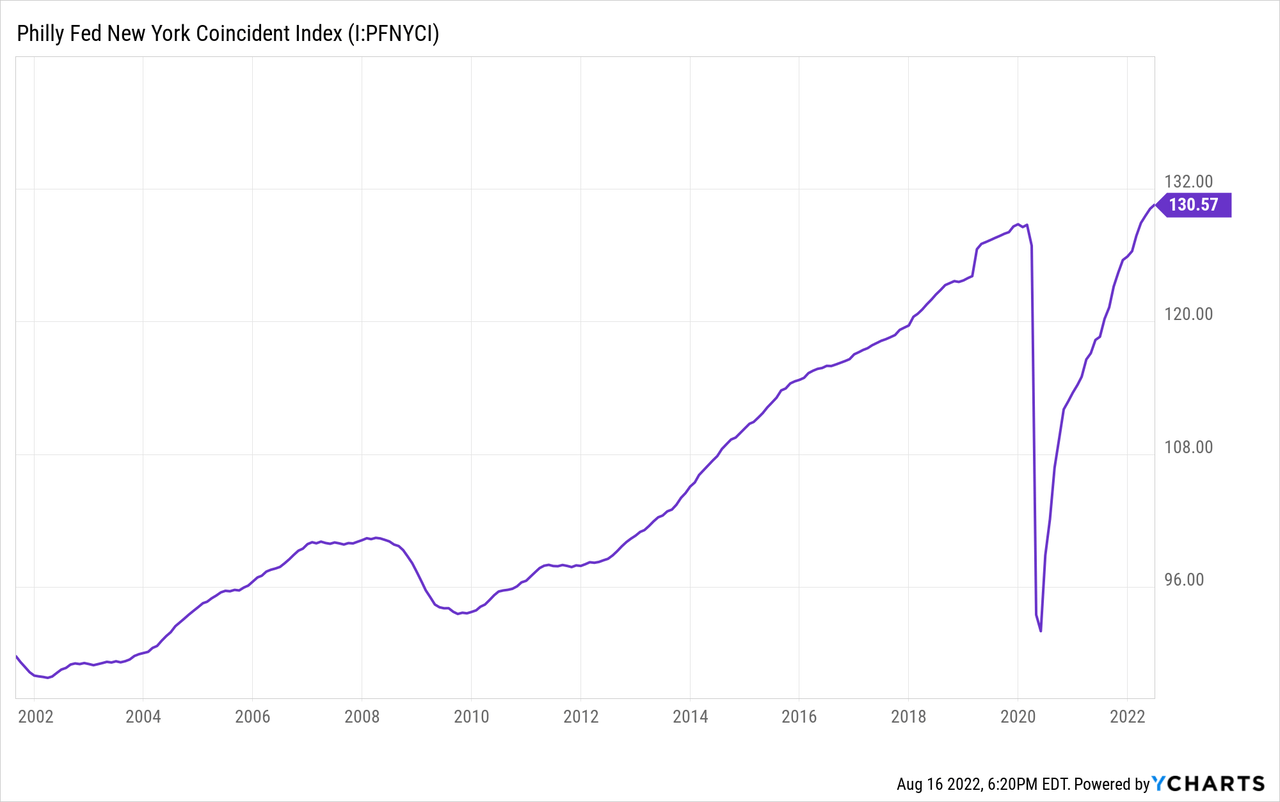
Nevertheless, New York’s economy seems to be on the right track, with the unemployment rate close to historic lows.
Considering these factors, I’m expecting the loan book to grow by 9.9% in 2022. Due to the second quarter’s surprisingly good performance, I’ve tweaked upwards my loan growth estimate from my previous estimate of 7.3% mentioned in my last report on the company. For 2023, I’m expecting loans to grow at a rate of 8.2%, which is close to the historical trend. Meanwhile, I’m expecting the growth of other balance sheet items to trail loan growth. The following table shows my balance sheet estimates.
| FY18 | FY19 | FY20 | FY21 | FY22E | FY23E | |||||
| Financial Position | ||||||||||
| Net Loans | 2,176 | 2,365 | 2,566 | 2,641 | 2,902 | 3,141 | ||||
| Growth of Net Loans | 12.6% | 8.7% | 8.5% | 2.9% | 9.9% | 8.2% | ||||
| Other Earning Assets | 646 | 638 | 930 | 1,194 | 947 | 985 | ||||
| Deposits | 2,346 | 2,616 | 3,235 | 3,550 | 3,653 | 3,954 | ||||
| Borrowings and Sub-Debt | 354 | 231 | 88 | 70 | 49 | 51 | ||||
| Common equity | 270 | 302 | 334 | 371 | 371 | 408 | ||||
| Book Value Per Share ($) | 18.1 | 20.1 | 21.6 | 23.1 | 23.1 | 25.4 | ||||
| Tangible BVPS ($) | 16.5 | 18.6 | 20.1 | 21.6 | 21.7 | 23.9 | ||||
|
Source: SEC Filings, Author’s Estimates (In USD million unless otherwise specified) |
||||||||||
Margin to Take a Hit This Year, Rise Next Year
As more than half the loan book is comprised of real-estate loans, the loan portfolio is slow to re-price. At the same time, the deposit book is quick to re-price as it is heavy on interest-bearing checking and savings accounts.
2Q 10-Q Filing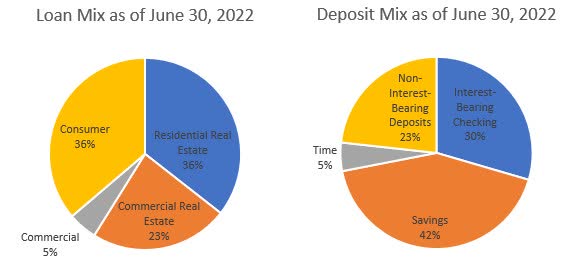
Therefore, an increase in interest rates initially hurts Arrow’s revenues. In the second year, the net interest income stands to benefit from previous rate hikes as more and more loans start re-pricing with a lag. The results of the management’s interest rate simulation model given in the 10-Q filing show that a 200-basis points hike in interest rates can reduce the net interest income by 1.9% in the first year of the rate hikes. In the second year of the rate hikes, the net interest income can increase by 7.32%.
2Q 2022 10-Q Filing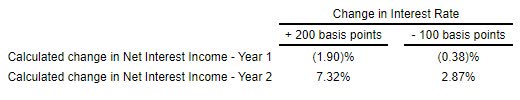
Despite the inverse relationship between interest rates and margin in the short term, Arrow was able to expand its margin by 12 basis points in the second quarter of 2022. This expansion was partly attributable to a shift in the asset mix. Arrow successfully deployed its excess liquidity into higher-yielding loans during the quarter. As liquidity is almost back to normal, I don’t think it presents an opportunity for margin growth anymore. Nevertheless, the anticipated loan growth can continue to lift the margin in the quarters ahead.
SEC Filings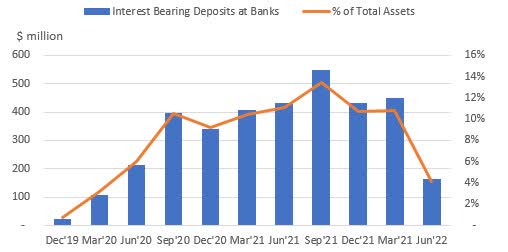
Overall, I’m expecting the margin to remain mostly unchanged in the second half of 2022 before trending upwards in 2023.
Provisioning to Return to a Normal Level
Arrow reported almost zero net provision expense for 2021, which is unlikely to be repeated this year. Allowances were 289.08% of non-performing loans at the end of June 2022, which seems like a comfortable level compared to both the historical and peer norms. Going forward, anticipated loan growth will likely require additional provisioning. Further, the management may want to increase its provisioning cushion because high interest rates, inflation, and the possibility of a recession can lead to financial stress for borrowers.
Overall, I’m expecting the net provision expense to make up around 0.12% (annualized) of total loans in the last two quarters of 2022 and full-year 2023. The provision expense also averaged 0.12% of total loans from 2017 to 2019.
Earnings to Dip by 3%
Higher provision expenses will undermine the effect of strong loan growth on earnings this year. As a result, I’m expecting earnings to dip by 3% to $3.0 per share in 2022. For 2023, I’m expecting loan additions to result in earnings growth of 12% to $3.35 per share. The following table shows my income statement estimates.
| FY18 | FY19 | FY20 | FY21 | FY22E | FY23E | |||||
| Income Statement | ||||||||||
| Net interest income | 84 | 88 | 99 | 110 | 115 | 126 | ||||
| Provision for loan losses | 3 | 2 | 9 | 0 | 3 | 4 | ||||
| Non-interest income | 29 | 29 | 33 | 32 | 32 | 32 | ||||
| Non-interest expense | 65 | 67 | 71 | 78 | 81 | 85 | ||||
| Net income – Common Sh. | 36 | 37 | 41 | 50 | 48 | 54 | ||||
| EPS – Diluted ($) | 2.43 | 2.50 | 2.64 | 3.10 | 3.00 | 3.35 | ||||
|
Source: SEC Filings, Author’s Estimates (In USD million unless otherwise specified) |
||||||||||
In my last report as well, I estimated earnings of $3.0 per share for 2022. Not only have I revised upwards the loan growth estimate, but I’ve also revised downwards the estimate for other earning assets. These revisions cancel each other out; therefore, my earnings estimate is barely changed.
Actual earnings may differ materially from estimates because of the risks and uncertainties related to inflation, and consequently the timing and magnitude of interest rate hikes. Further, a stronger or longer-than-anticipated recession can increase the provisioning for expected loan losses beyond my estimates.
Downgrading to a Hold Rating
Arrow Financial is offering a dividend yield of 3.0% at the current quarterly dividend rate of $0.27 per share. The earnings and dividend estimates suggest a payout ratio of 32% for 2023, which is below the five-year average of 41%. Therefore, there is room for a dividend hike. Nevertheless, I’m not assuming any change in the dividend for my investment thesis to remain on the safe side.
I’m using the historical price-to-tangible book (“P/TB”) and price-to-earnings (“P/E”) multiples to value Arrow Financial. The stock has traded at an average P/TB ratio of 1.73 in the past, as shown below.
| FY18 | FY19 | FY20 | FY21 | Average | ||
| T. Book Value per Share ($) | 16.5 | 18.6 | 20.1 | 21.6 | ||
| Average Market Price ($) | 34.0 | 33.3 | 29.3 | 34.9 | ||
| Historical P/TB | 2.06x | 1.79x | 1.46x | 1.61x | 1.73x | |
| Source: Company Financials, Yahoo Finance, Author’s Estimates | ||||||
Multiplying the average P/TB multiple with the forecast tangible book value per share of $21.7 gives a target price of $37.5 for the end of 2022. This price target implies a 5.2% upside from the August 16 closing price. The following table shows the sensitivity of the target price to the P/TB ratio.
| P/TB Multiple | 1.53x | 1.63x | 1.73x | 1.83x | 1.93x |
| TBVPS – Dec 2022 ($) | 21.7 | 21.7 | 21.7 | 21.7 | 21.7 |
| Target Price ($) | 33.2 | 35.4 | 37.5 | 39.7 | 41.9 |
| Market Price ($) | 35.7 | 35.7 | 35.7 | 35.7 | 35.7 |
| Upside/(Downside) | (7.0)% | (0.9)% | 5.2% | 11.2% | 17.3% |
| Source: Author’s Estimates |
The stock has traded at an average P/E ratio of around 12.4x in the past, as shown below.
| FY18 | FY19 | FY20 | FY21 | Average | ||
| Earnings per Share ($) | 2.43 | 2.50 | 2.64 | 3.10 | ||
| Average Market Price ($) | 34.0 | 33.3 | 29.3 | 34.9 | ||
| Historical P/E | 14.0x | 13.3x | 11.1x | 11.3x | 12.4x | |
| Source: Company Financials, Yahoo Finance, Author’s Estimates | ||||||
Multiplying the average P/E multiple with the forecast earnings per share of $3.0 gives a target price of $37.2 for the end of 2022. This price target implies a 4.2% upside from the August 16 closing price. The following table shows the sensitivity of the target price to the P/E ratio.
| P/E Multiple | 10.4x | 11.4x | 12.4x | 13.4x | 14.4x |
| EPS 2022 ($) | 3.00 | 3.00 | 3.00 | 3.00 | 3.00 |
| Target Price ($) | 31.2 | 34.2 | 37.2 | 40.2 | 43.2 |
| Market Price ($) | 35.7 | 35.7 | 35.7 | 35.7 | 35.7 |
| Upside/(Downside) | (12.6)% | (4.2)% | 4.2% | 12.6% | 21.0% |
| Source: Author’s Estimates |
Equally weighting the target prices from the two valuation methods gives a combined target price of $37.4, which implies a 4.7% upside from the current market price. Adding the forward dividend yield gives a total expected return of 7.7%.
In my last report, I adopted a buy rating with a target price of $37.8 for December 2022, which implied a 13.6% price upside. Since then, the market price has rallied leaving small room for further upside. Therefore, I’m now downgrading Arrow Financial to a hold rating.
Be the first to comment