

Kwarkot
The big-picture case against investing in Armada Hoffler (NYSE:AHH) stock has two parts. The first part is that they are a Diversified REIT in the NAREIT categorization.
While it seems superficially that being diversified into multiple economic sectors ought to be a strength, Diversified REITs on average have underperformed over time.
My view of that has been that the advantages of specialization on one property type have been larger than those coming from diversification. One can find the data on REIT gains by sector from NAREIT in their REITwatch series.
The second part of the negative case is that Armada Hoffler is geographically localized. Most of their properties are in Virginia. The rest are in nearby states on the Atlantic Coast. This makes them subject to potential regional economic malaise to a degree that REITs with more widely distributed portfolios are not.
A while back, the leader of High Yield Landlord, Jussi Askola, began thinking about investing in AHH. We had an intermittent discussion that went on for perhaps a year.
Jussi’s main counter to those negative arguments was that perhaps detailed local knowledge could provide advantages that more than offset those risks. The management team at Armada Hoffler has been at it for 40 years, investing in that region. Jussi eventually did buy shares, and later shared that fact publicly.
More recently, another of our authors, Austin Rogers, published a favorable article. It led to a discussion with management that was shared with our members. Management was quite impressive.
Meanwhile, my own recent thinking about my personal circumstances has increased my interest in owning REITs with higher dividend yields. At the moment, the yield on AHH stock is near 7%.
All of the above led me to finally take a closer look at Armada Hoffler. I began to apply the deep quantitative analysis that my followers have seen in many articles by now.
What I found shocked me.
For once, though, the shock was strongly positive. Let me share my results.
A Brief Introduction
Armada Hoffler owns nearly 60 properties. They group these into Office, Retail, and Residential. In the present era, they are seeking to grow the fraction that is Residential by focusing new activity in that sector.
Armada Hoffler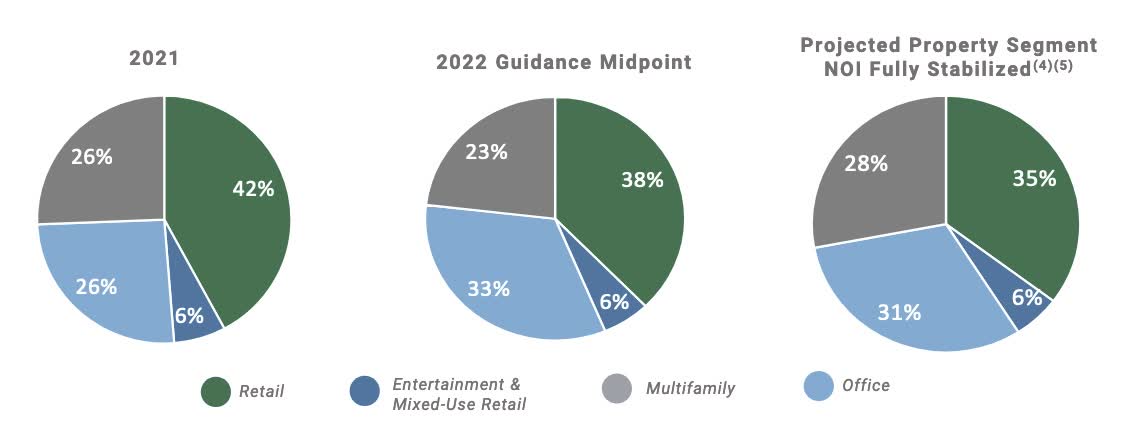
They also make some mezzanine loans and do some development for others. But these two businesses don’t really move the needle.
What’s more, they have no interest in growing either one, rather the reverse. So I will ignore them here.
Their debt is mostly secured debt at present, but is nicely laddered over time. Their present goal is to move toward using much more unsecured debt, a process they have just begun.
But the above aspects do not capture the soul of Armada Hoffler. It appears to me that two things do.
First, they are a developer at their core. Buying and operating properties is part of what they do but is not their self-identity. In this respect, they remind me strongly of AvalonBay (AVB). Over recent decades, AvalonBay can boast of the largest rate of growth of FFO/share of any large-cap REIT. (FFO is Funds from Operations, about which more later.)
Second, they seek to own only trophy, Class-A properties. They argue that this helps insulate them from economic ebbs and flows. In this respect, they remind me of office REIT Boston Properties (BXP).
Digging In
These days my approach to understanding a REIT I am serious about is to seek first to understand how they grow and how they fund their growth. This took a couple days, on and off, doing that just to get a feel for them. I share details below.
The next question is how that growth pays off for shareholders. Armada Hoffler management has very serious skin in the game, much of it held in operating-partnership, or “OP” units.
These OP units also are an active element in their property management. The number evolves over time. We will skip further details about that.
What matters is that dividends and earnings are distributed across both the OP units and the common stock. Technically the shares of common stock, or “LP units,” represent ownership of Limited Partner interests.
The computers often miss OP units, as does TIKR in this case. So you have to dig a bit to accurately know the FFO per share over time.
Here is what you get after doing that:
RP Drake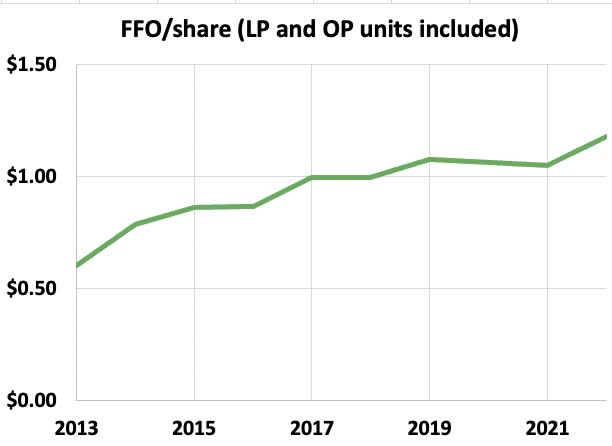
This is a shocking plot. Over the interval shown, Armada Hoffler grew FFO/share at a 7.7% CAGR. This is one of the best growth rates amongst all REITs, and especially amongst REITs in the three sectors they work in.
Combine this with a dividend yield of 6.3% or more and you have a projected total economic return of 14%. This is stellar, truly. I would suggest that Armada Hoffler start including the above plot in their supplementals.
So what we want to know next is how they do that and what the prospects are going forward. Let’s take a look.
Tracking the Money
It is good to start with a check for funny business in the financials. This usually would be caused by GAAP rules. One way to see is to compare FFO (derived from GAAP numbers) with Cash from Operations (“CfO”).
RP Drake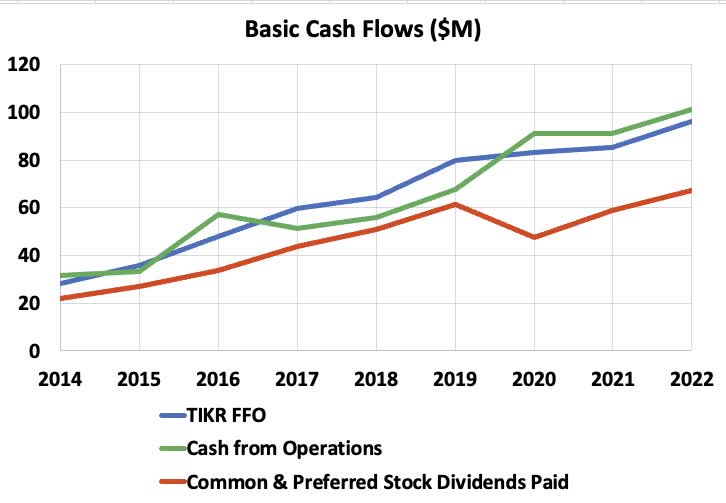
These track pretty closely, which indicates that FFO is a pretty good measure of cash earnings before capital expenditures. It is also good to see that the dividends are well covered.
The recent dividend increase is not reflected here. It moves the payout ratio closer to its pre-pandemic value.
Next we might ask what happens to the funds represented by FFO. In this case that is easy:
RP Drake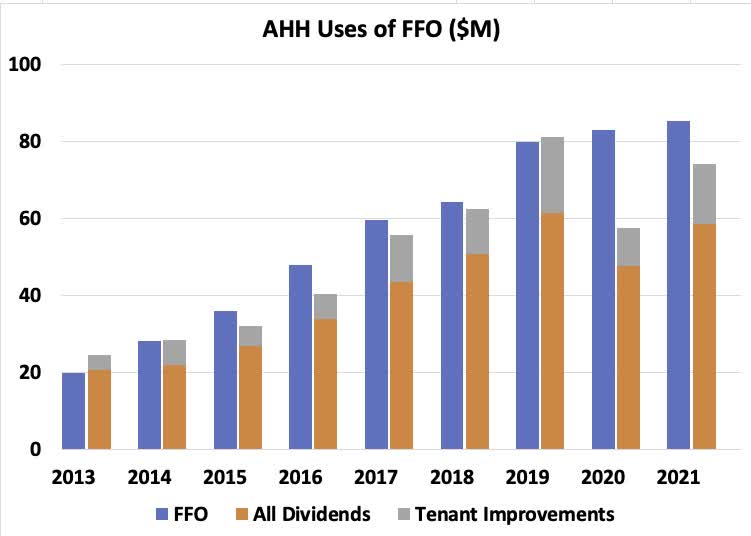
We see that pretty much all of FFO is used for dividends and for Tenant Improvements, which represent recurring capex. An implication is that substantially all of Adjusted FFO, or AFFO, is paid out as dividends. I discuss AFFO at length here.
Notably, retained earnings are minimal for Armada Hoffler. The average fraction of FFO retained from 2014 through 2021 is 9%, but if you drop 2020 that is halved. Retained earnings are not a source of growth for them.
Yet Armada Hoffler has grown, quadrupling their gross property over the past 9 years. This next plot shows how this was funded and how the money was spent.
RP Drake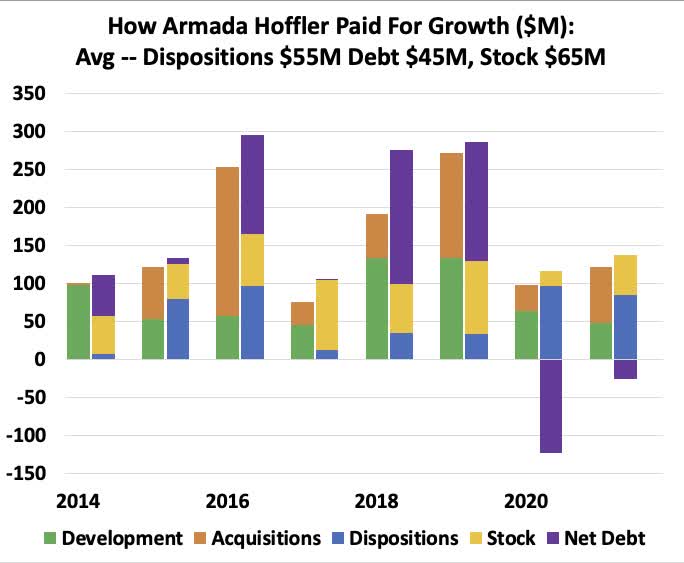
This plot is complex but merits your attention. The development activity that is their core (green) has run an average of $79M per year from 2014.
Dispositions (blue) can be viewed as supporting about 70% of that. Stock issuance (gold) and new debt (purple) can be viewed as funding the rest of the development and all of the acquisitions (orange) at a 40% Debt Ratio.
Sell and Develop
What is key here is that, if you are capable developers, then disposing of properties and using the funds for new development can be highly profitable. Selling a property at a 4% cap rate and developing a new one that comes in at 6% gives you a 50% increase in value over a two-year development cycle.
The ability to do this is not guaranteed but has been sustainable. Here is a relevant plot borrowed from AvalonBay:
Avalon Bay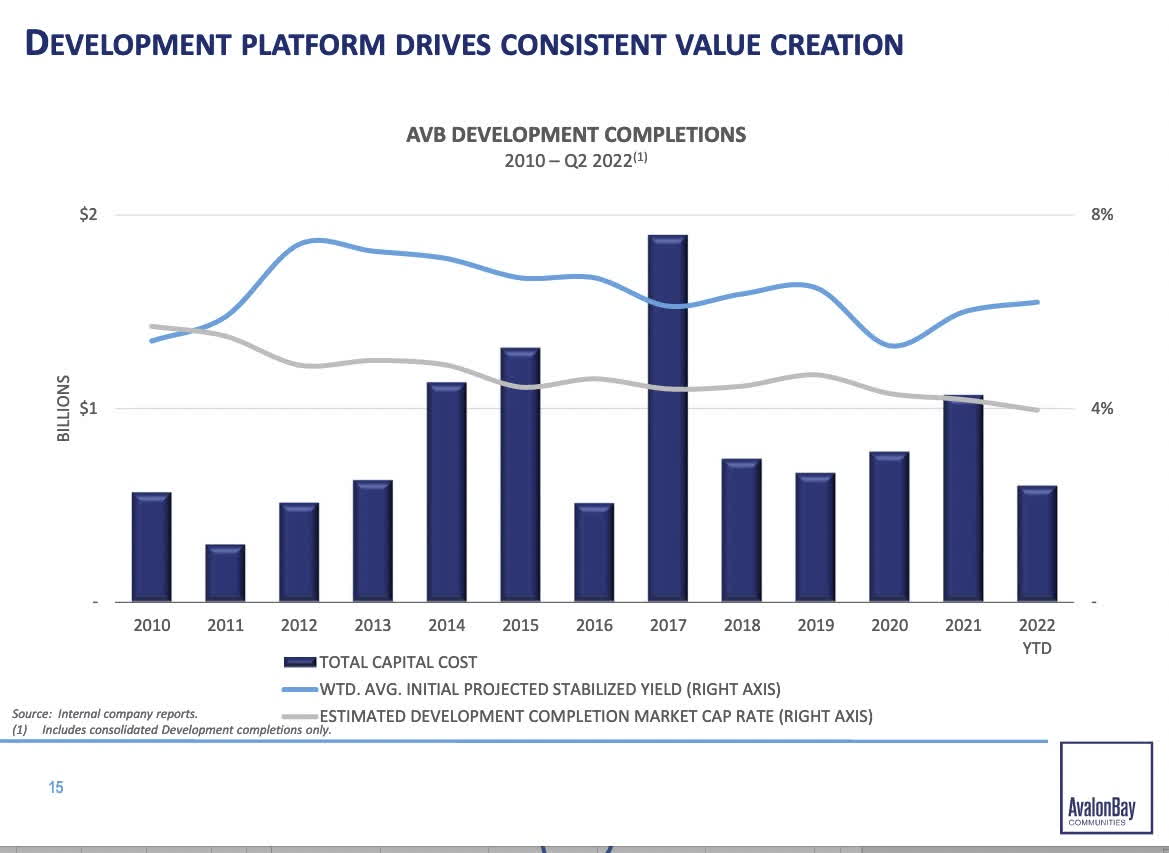
Consider further the development aspect. One can view the $79M average as supported by $55M of dispositions, $10M from debt, and $14M from stock sales. This costs $2.2M a year of NOI and generates $4.7M, so the $24M of debt and stock nets $2.5M, a 10% rate of return to NOI.
Now look toward FFO from this. The interest expense is a small fraction of this, say 15%, and G&A runs something like 13% for them, so the net growth of FFO is in the ballpark of $1.8M.
This $1.8M is a 13% return on the funds from sale of stock. It covers the dividend on the new stock with lots of room to spare, even with today’s suppressed stock price. Alternatively, to sustain their rate of development without selling any stock at low prices, Armada Hoffler would only have to increase their rate of dispositions from $55M to $79M.
What’s more, the $1.8M increase in FFO is in the ballpark of 3% of the FFO per year during the period of interest. The required sale of stock is small; nearly all of this flows through to FFO/share.
For reference, we can compare with Boston Properties (BXP), who also sees themselves primarily as a developer but is better known and more loved by the markets (with good reason). From their current development pipeline, they anticipate a 3.8% growth rate of per share Net Operating Income, which should be the ballpark of the increase to FFO/share.
However, during the past decade, Boston Properties has produced a much slower rate of growth of AFFO/share than Armada Hoffler has. One difference is that Boston Properties has a much larger fractional rate of recurring capex while Armada Hoffler has a higher fractional rate of dispositions. Perhaps this is explanatory.
Acquire?
As an adjunct activity, Armada Hoffler can acquire properties when the opportunities look good and cash is available. Here is how they placed that in context on the Q2 2022 earnings call:
… any excess funds over that of the equity requirements in our development pipeline will be deployed surgically in the highest and most advantageous places. Adding high quality tenants in prime locations through opportunistic acquisitions will supplement our portfolio and steadily add NOI to the earnings base, whilst we work through our development pipeline..
There you have it from the horse’s mouth. Acquisitions are supplemental.
If you look again at the graphic above, you can see that in most years Armada Hoffler has not acquired much property. The years 2016 and 2019 dominate the activity of the past decade.
As an example, here is some of what management had to say in the Q3 2016 earnings call:
You may have also seen that last month we issued 2 million shares of common stock in a off market acquisition of a stabilized retail asset, our sixth transaction involving either stock or OP units. We acquired the property in an all stock transaction from a seller who now holds a significant equity position in our company. We believe the acquired property is a logical and strategic addition to our portfolio with tremendous potential upside related to redevelopment opportunity.
The bottom line here is that Armada Hoffler management seems to view acquisitions as the dessert after the meal provided by development. When good ones are on the platter, they are a tasty addition to the year’s meal. But they are not essential.
Estimating the Pieces
We began with FFO/sh growing at a 7.7% CAGR across the past decade. Subtracting 3% as an estimate for the impact of development leaves 4.7%.
This comes from two places: increasing rents on stabilized properties and the accretive impact of acquisitions. On the former, what Armada Hoffler reports and discusses is increases in Same-Store NOI.
It is no surprise that these increases have fluctuated. For example, they are near 8% YoY now, but they were less than 1% YoY from 2017 to 2018.
I chose not to dig into the details of rent changes across all three sectors over time. Complications would include the evolving size of the sectors and the impacts of the pandemic.
Instead we can note that the increase in FFO/sh from rent increases for typical REITs runs in the range of 1% to 3%. Rare exceptions with big rent escalators do more [e.g., Spirit Realty Capital (SRC)], but since Armada Hoffler is not bragging about their rent escalators they probably do not.
This suggests that on average over the past decade Armada Hoffler has added 2.7%, give or take, to FFO/sh via their acquisitions. We can understand this using math provided here. The return (AFFO) on new cash is implied by these parameters:
RP Drake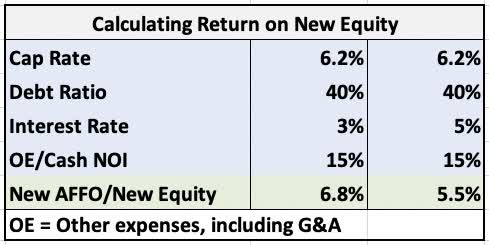
For much of the past decade, the dividend yield has run about 5%. This is also a sensible estimate of the AFFO yield, since FFO goes almost entirely to dividends and recurring capex.
They have increased their unit count by about 10% per year. Together with the above, this implies a typical number for the average, diluted increase in AFFO/share from acquisitions at 3.2% (6.8% x 10% / 110%).
We find a total, pre-share growth rate by adding to this the 3% growth in FFO/sh from development plus 2% from rent increases, both diluted by the share issuance. This gives 7.8%, pretty close to the 7.7% they actually achieved.
(The calculation here is illustrative not predictive. The results are sensitive to the precise numbers.)
So why did I just drag you through the numbers? Because the piece of this that can go away when earnings multiples decline is acquisitions.
At the present dividend yield it is not accretive to shareholder value for Armada Hoffler to issue shares and acquire properties. They are aware of this, stating in their Q2 earnings call that “We’re not interested in selling cheap stock.” (I love hearing that.)
Without acquisitions, the ballpark growth rate one would anticipate for FFO/sh, AFFO/sh, and dividends would be 5%.
Dividend Reductions
What is likely in recessions with the dividend on AHH will disappoint many investors. Recall from the above that FFO goes entirely to dividends and Tenant Improvements.
In recessions FFO goes down and the spending for Tenant Improvements goes up. Armada Hoffler would likely have no good choice but to reduce the dividend, as they did in 2020. Then, over the ensuing years they would bring it back up, as has been happening lately.
They would no doubt argue that 2020 was an aberration, because their tenants were shut down by government edict. And since they have the best properties that demand the best tenants, in an ordinary recession one would expect a much smaller decrease in FFO.
On the one hand, I think there is merit to that argument. On the other hand, there is little protection of the dividend in this business model.
Meeting My Specific Needs
My view of investments is impacted by my identity as a retiree with a desire to draw significantly from my investment portfolio. This motivates me to take a pessimistic view of future markets.
My base case is that the next 20 years will see earnings multiples drop 4% per year on average. I hope this won’t happen, but as I argued here, it is plausible.
On the basis of my modeling assumptions, what I need to sustain nominal portfolio value is an 11% economic return. The actual number might be higher or lower, but not by a lot.
Investing in a REIT with a 7% YoC implies only needing 4% forward growth of AFFO/sh to meet my threshold. In contrast, a 5% YOC requires 6% forward growth and 3% YOC requires 8%.
As an example, the stated goal of Crown Castle (CCI) is to produce long-term growth of 7% to 8%. Their current dividend is 4.8%, so they meet my threshold.
But that rate of growth depends on the continuing strong rollout of 5G, and they are already guiding for lower growth over the next two years. In addition, they have a history of sometimes supporting growth with large issuance of stock, which would become less accretive under my assumptions. Growth at a rate above my threshold is far from guaranteed.
The comparison of Federal Realty Trust (FRT) with Armada Hoffler may be more informative. Federal Realty pays a 4.7% yield today. They sustained their dividend through the pandemic, but they had to push leverage up to do that. Now they are working leverage back down, but still are a year or two away from returning to substantial dividend growth.
I am confident that Federal Realty, whose balance sheet and diversification are strong, will grow strongly going forward. The reasons are similar to those for Armada Hoffler. But, based on their history, Federal Realty would be more dependent on issuing shares to obtain that 6% to 7% growth needed to meet my threshold.
If it were certain that AFFO multiples would go back to their values from 2019 and 2021, FRT would definitely be able to grow AFFO/share fast enough meet my threshold. But it is not certain.
For Armada Hoffler, the current 7% yield implies that meeting my threshold requires only 4% per year growth of AFFO/share. This is just over half of what they have been doing.
But there is that issue of dividend cuts identified above. To assess this, I looked at a case where AFFO and the dividend dropped 50% in year 1, then recovered over the next 3 years, and then grew at 4% to 6% long-term. In that model, a position established at a 7% initial yield could sustain an 8% withdrawal rate and end up with a modestly increased nominal value 20 years later. This is not intended as a precise result, but rather shows that a few bad years do not lead to the collapse of the position.
The Corporate Gestalt
Beyond the above, it matters to me what shows through from Earnings Calls regarding the approach of management to growth. It often seems like getting to a larger total number is all management cares about. At minimum, I want to see a concern for per share earnings, specifically (A) FFO/share for REITs. That is very present in the Armada Hoffler earnings calls.
Beyond that there are a lot of other issues where I like to see signs that management is actually focused on shareholder value along with minimizing risks. The goals specified in 2020 and largely accomplished by now all resonate with me. From the Q2 2022 earnings call these were:
Reducing the percentage of NOI derived from older retail centers, reducing the contribution from mezzanine interest income, increasing multifamily sector revenue, increasing the percentage of rent derived from high-credit office tenants, and ultimately adding liquidity to the balance sheet…
There are several other respects in which what management had to say resonated with me. They think about their business in the ways I want to see as an owner.
As usual, the balance sheet may be the biggest risk. The good news is that their secured debt is tied to individual properties and can be shed with dispositions. In addition, they have, on average, been issuing new debt at a reasonable rate as discussed above.
Their debt is also reasonably laddered. But I’d prefer to see less debt in near-term years, especially as they move to more unsecured debt. As a shareholder, one thing I will watch very closely is their progress in improving their balance sheet.
Risks and Opportunity
Armada Hoffler management sells themselves as versatile real estate professionals who have invested successfully across the past 40 years. That sounds really great, until you realize that the past 40 years is encompassed entirely by the great bull market in bonds that started in 1982.
This group has no experience investing during an extended bear market in bonds, which would stress the credit markets. They have no experience investing across periods of enduring inflation and economic stagflation like the 1960s and 1970s. (Of course, almost nobody else does either.)
My estimate is that this group will handle the firm well if indeed we find ourselves in those waters. But we can’t say that they have done it before.
Looking ahead, it makes sense to me that Armada Hoffler will prove able to continue their growth of AFFO/sh from development and rent increases, at a rate of 4% or more. I am very interested in hearing opposing arguments about that.
They will be able to do this even if their stock stays too cheap to support issuing new shares.
In contrast, I have zero interest in hearing from people who consider AHH stock not worth owning because at the moment its price has gone nowhere on net since 2013. We are weighing, here, not voting.
Be the first to comment