

Shahid Jamil
Chart created by writer from C Trader
In this article we will examine bullish upside for Apple (NASDAQ:AAPL) and look to where this equity may be going price wise.
The iPhone 14 is set to be revealed in September with reported Apple watch additions, all apparently with no supply disruption forecasted. Credit Suisse (CS) also upgraded their forecasts to outperform along with a huge bullish technical move from the bearish Fibonacci 161 from the macro third wave downwards. Apple has been moving upwards faster than you can digest the information in this paragraph.
This year’s Q2 revenue saw a 9% increase to a new March record with some initial murmurings about supply chain disruption initially causing concern. These concerns have reportedly been alleviated with this September coming up a big month for new product releases, such as: iPhone 14 with various upgrades, Apple watch additions as well as iPads and Mac’s leaving investors with a strong appetite.
Starting with the Macro bearish three wave pattern we will work downwards before moving to the bullish set up.
Topping out at $182 before dropping to $150 even in bearish mode, Apple nearly didn’t form a wave one downwards. The wave two retraced so high into the wave one it came within two dollars of rendering the wave one null and void.
Eventually dropping through support at $150, confirming the wave three south, $129 and $117 were set out with the latter as the primary target if wave three was to numerically replicate its wave one.
Bottoming at the Fibonacci 161 at $129 Apple has seen a huge move upwards that stands out from most of the popular equities.
Apple monthly (C Trader )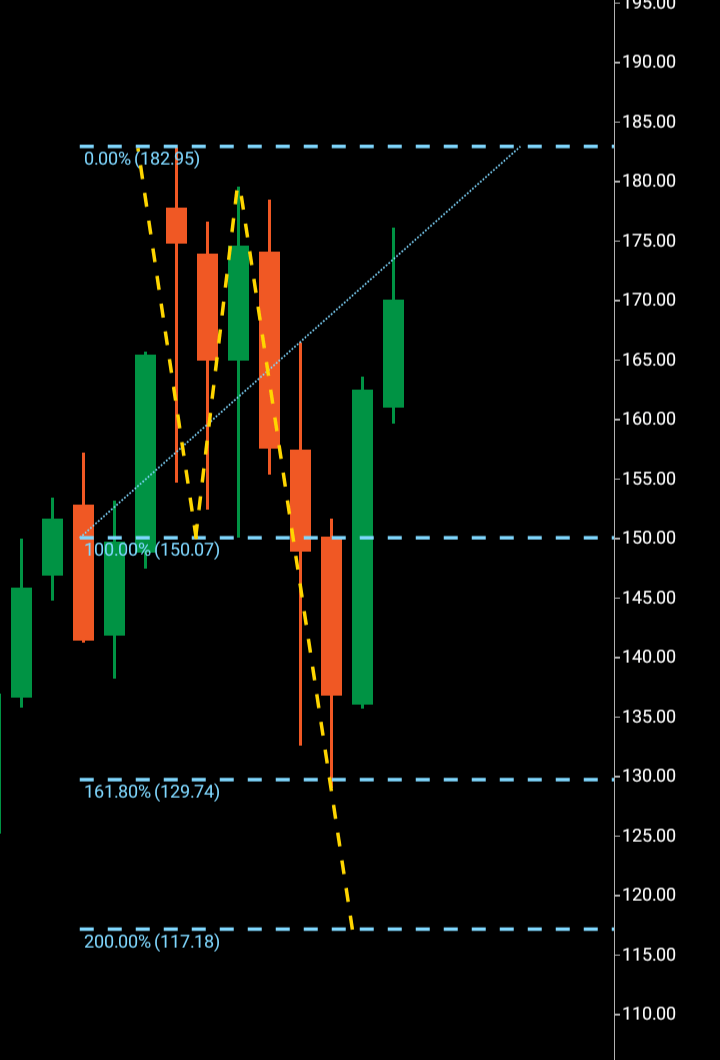
I have not included a bullish pattern off this bottom as the move has been so strong that the bullish wave one is still clearly in process. In fact there is a possibility the wave one will outperform its previous top numerically at $182 before it forms a rejection which would give way to a bullish third wave.
Apple weekly (C Trader )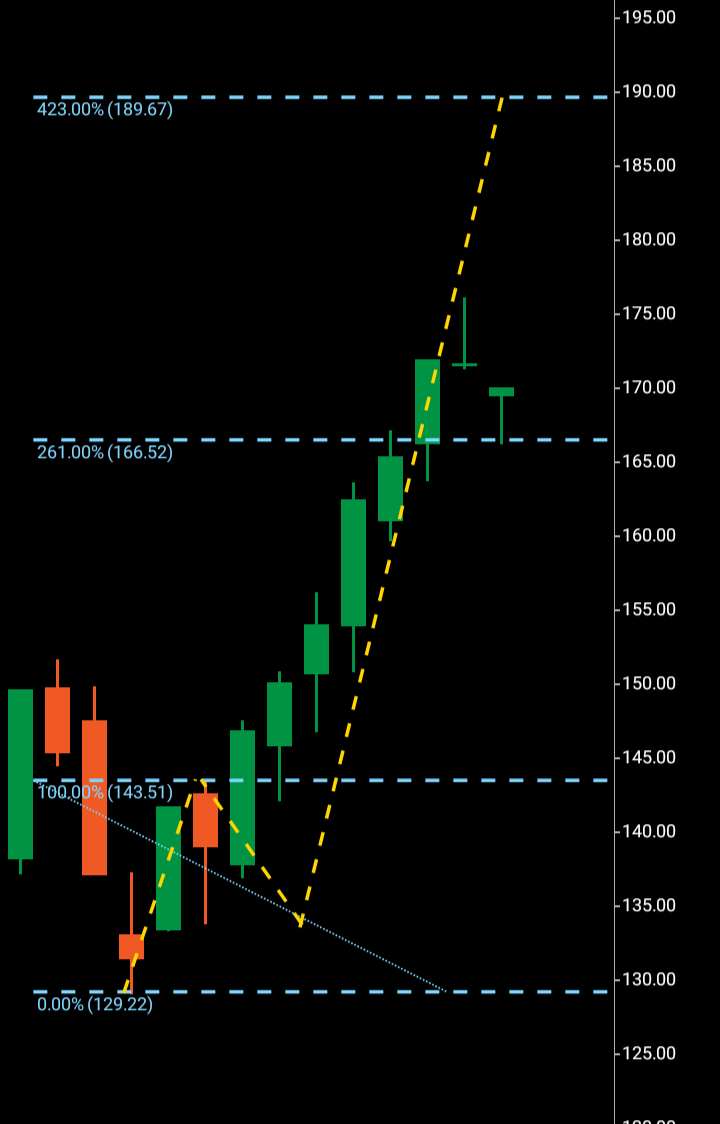
If we move to the weekly chart above we can see where Apple may find its wave two, the weekly three wave pattern off the bottom has bypassed all of its Fibonacci levels with $189 being the 423%.
As things stand, the bottoming at $129 has seen enough wick action on its candles to suggest a strong turnaround has been found with a large wick bounce off the $129, which is now macro support region.
A very bullish full bodied candle from the $135-$165 region followed the bottoming and it is the next and current candle $160-$175 that all eyes are on.
Apple current monthly (C Trader )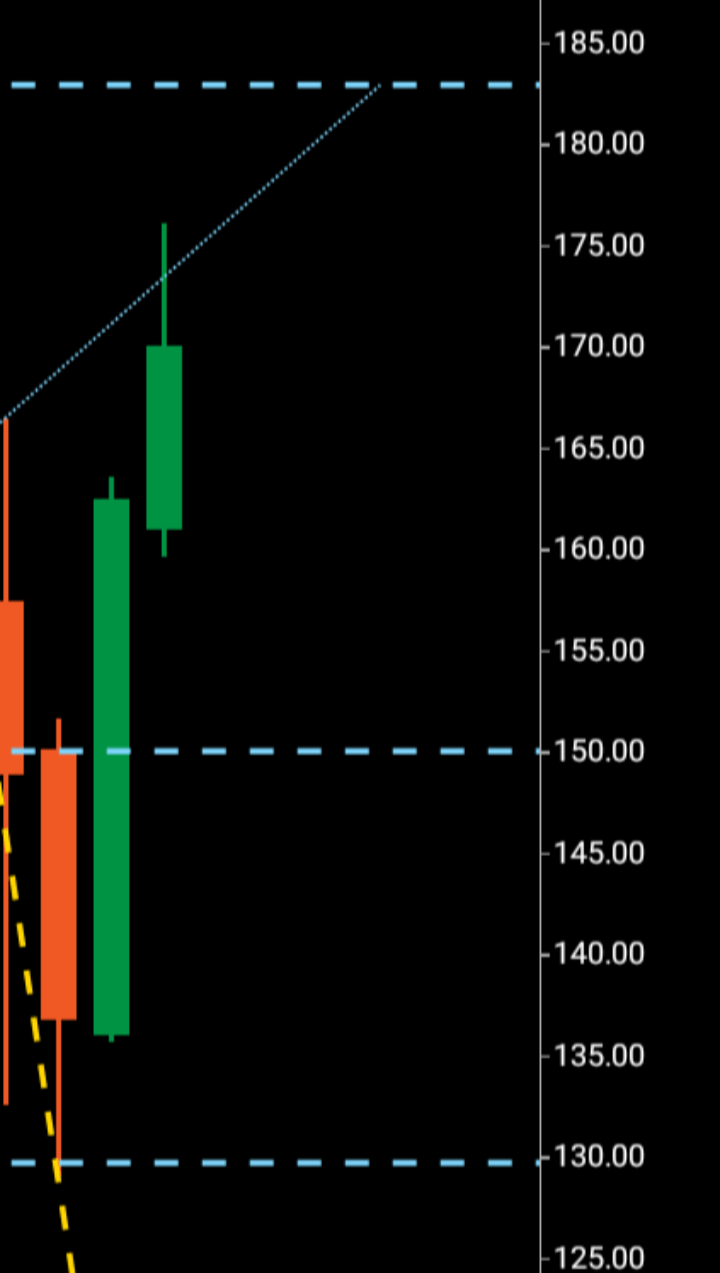
In order to form a bullish three wave pattern there must be a wick bottoming followed ideally by a strong upward momentum shift in price creating the wave one with an area forming at the top that has clear rejection. It is this area that then forms the wave two which allows the wave three to be created once price has been driven above the rejection.
Looking at this monthly setup, there is no sign yet that this monthly candle will form a rejection which could lead to a very bullish interpretation.
This current monthly candle can finish in full bodied form suggesting that the price will either have to continue slightly or significantly higher before forming the rejection.
The other less probable close would be to fall from its current price range and look to form the wave two as it stands.
Either way I suspect Apple will move significantly higher should this momentum keep up and am ranking this equity amongst the strongest performers technically of all the major equities. Interesting times ahead to find out where Apple will find its wave two rejection, it could possibly be above the last high of $182.
For the moment I am selecting hold as the wave one and two must clearly form and if and once that happens, it will outline these technicals immediately. A move higher is in all probability happening by year end, how Apple will do it is yet to be revealed.
About the Three Wave Theory
The three wave theory was designed to be able to identify exact probable price action of a financial instrument. A financial market cannot navigate it’s way significantly higher or lower without making waves. Waves are essentially a mismatch between buyers and sellers and print a picture of a probable direction and target for a financial instrument. When waves one and two have been formed, it is the point of higher high/lower low that gives the technical indication of the future direction. A wave one will continue from a low to a high point before it finds significant enough rejection to then form the wave two. When a third wave breaks into a higher high/lower low the only probable numerical target bearing available on a financial chart is the equivalent of the wave one low to high point. It is highly probable that the wave three will look to numerically replicate wave one before it makes its future directional decision. It may continue past its third wave target but it is only the wave one evidence that a price was able to continue before rejection that is available to look to as a probable target for a third wave.
Be the first to comment