

Rob Daly
Intro & Thesis
You are now reading my third SA article on Apple Inc. (NASDAQ:AAPL). Previously, I expressed the opinion that the company was basically quite promising for investors in the long run due to the strength of its brand and effective shareholder return policy. However, in my opinion, Apple was already highly overvalued then, so I did not recommend buying the stock but rather recommended waiting for a substantial drawdown that could cool its valuation.
Since my first and second articles, AAPL stock is down 21% and 5.6%, respectively, while the market is down 22.7% and 7.5% over the same period.
Author’s rankings on Seeking Alpha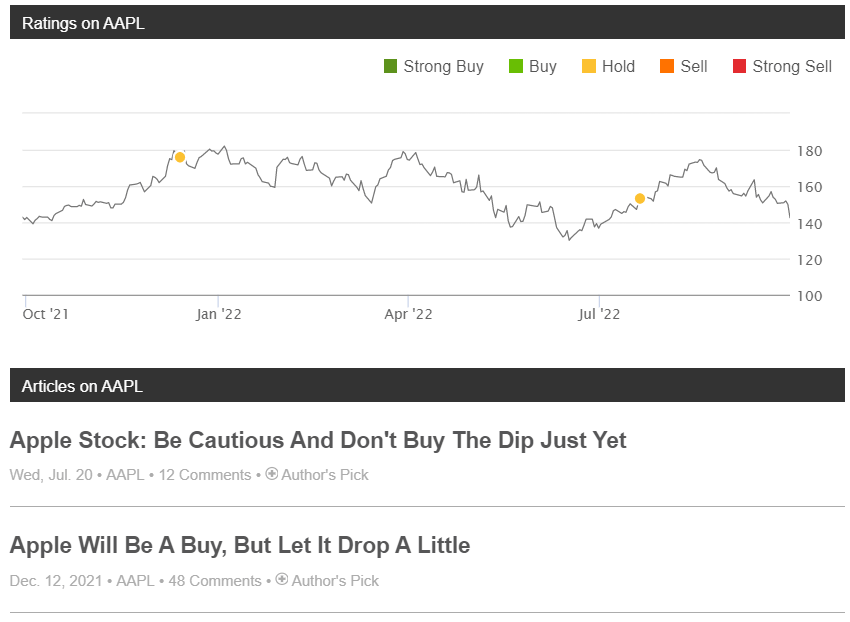
In this context, the legitimate question is whether it’s now worth buying the dip in AAPL and when the pressure on the stock will end.
Today, my thesis has not changed – I’m not expecting the apocalypse like some bears, but common sense says now is still not the best time to buy Apple stock. My rating is still Neutral, but unfortunately, it’s now much closer to Sell than Buy. Let me tell you why.
What’s wrong with the law of gravity?
Apple stock proved quite resistant to the sell-off that has been taking place on the stock market since November 2021. The S&P 500 (SPX) is currently down 24% year to date, which should theoretically lead to a much bigger sell-off in FAAMNG stocks – given their high betas and the fragility of the entire tech sector. One way or another, this has proven true for all FAAMNG companies – except for Apple Inc.
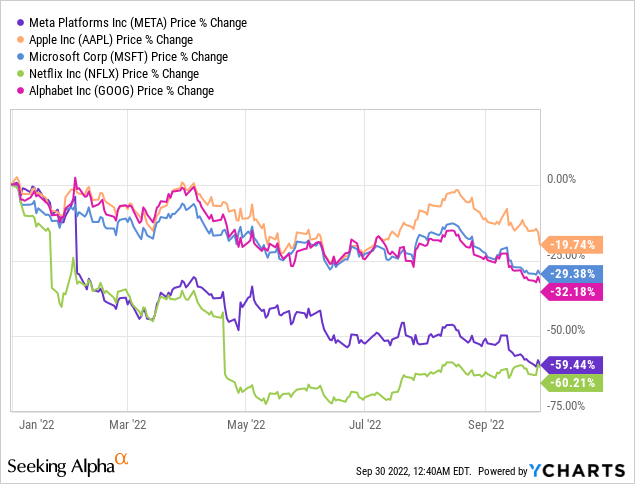
As you can see, despite being the heaviest weight in the FAAMNG – its market cap is $2.29T – Apple stock floats in the air against all laws of logic and gravity and feels much better than other mega-cap tech companies. As Larry McDonald from Bear Traps wrote in his August 28 report – If Apple AAPL was its own sector in the S&P 500, it would be the 7th largest sector out of 12 – insanity.
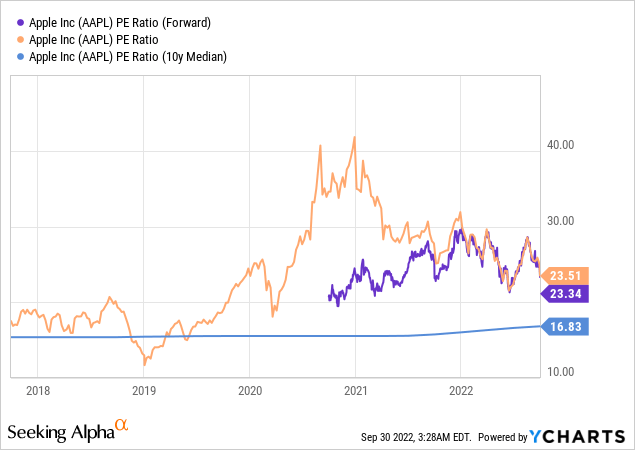
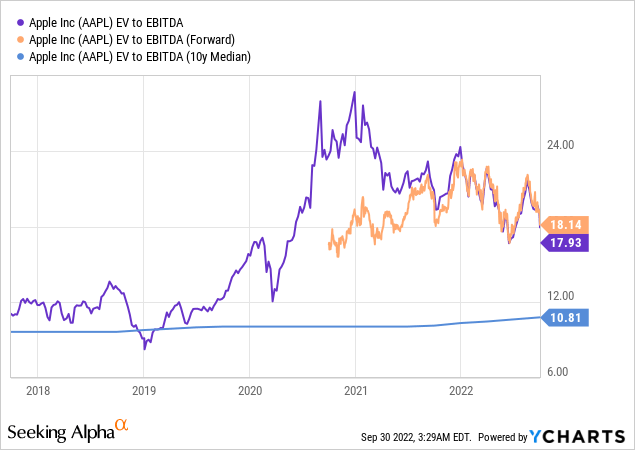
Absolute weight, however, is not the most important thing in Apple’s gravity – it is, in fact, the most expensive mega-cap tech company by valuation, with the possible exception of Amazon’s multiples (AMZN).
YCharts, author’s notes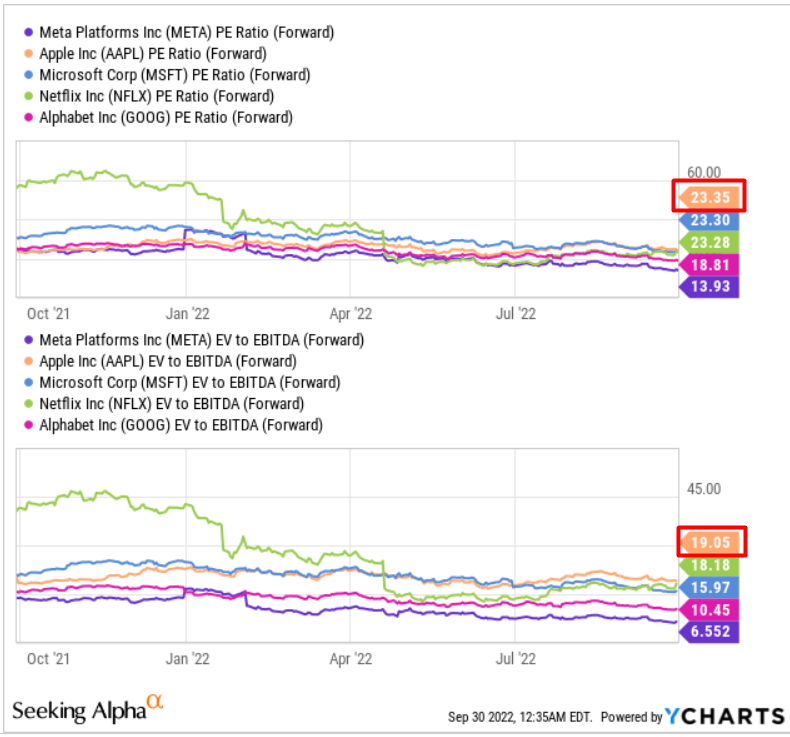
Considering the whole range of risks – from the debt crisis in China to the global recession – which in fact apply to all companies without exception, Apple at the moment is still breaking the law of gravity, so to speak. Even despite the special selling pressure of the latest days, this stock is still expensive while other indicators that should justify it are not outstanding enough. What do I mean?
Since I am already using the terminology from physics, let me recall the quote from the astronomer and popularizer of science, Carl Sagan – Extraordinary claims require extraordinary evidence. The higher the company’s valuation (absolute and compared to its peers), the stronger marginality it should have as well as earnings estimates for the future. This is not the case with Apple at all.
YCharts, Margins and estimates 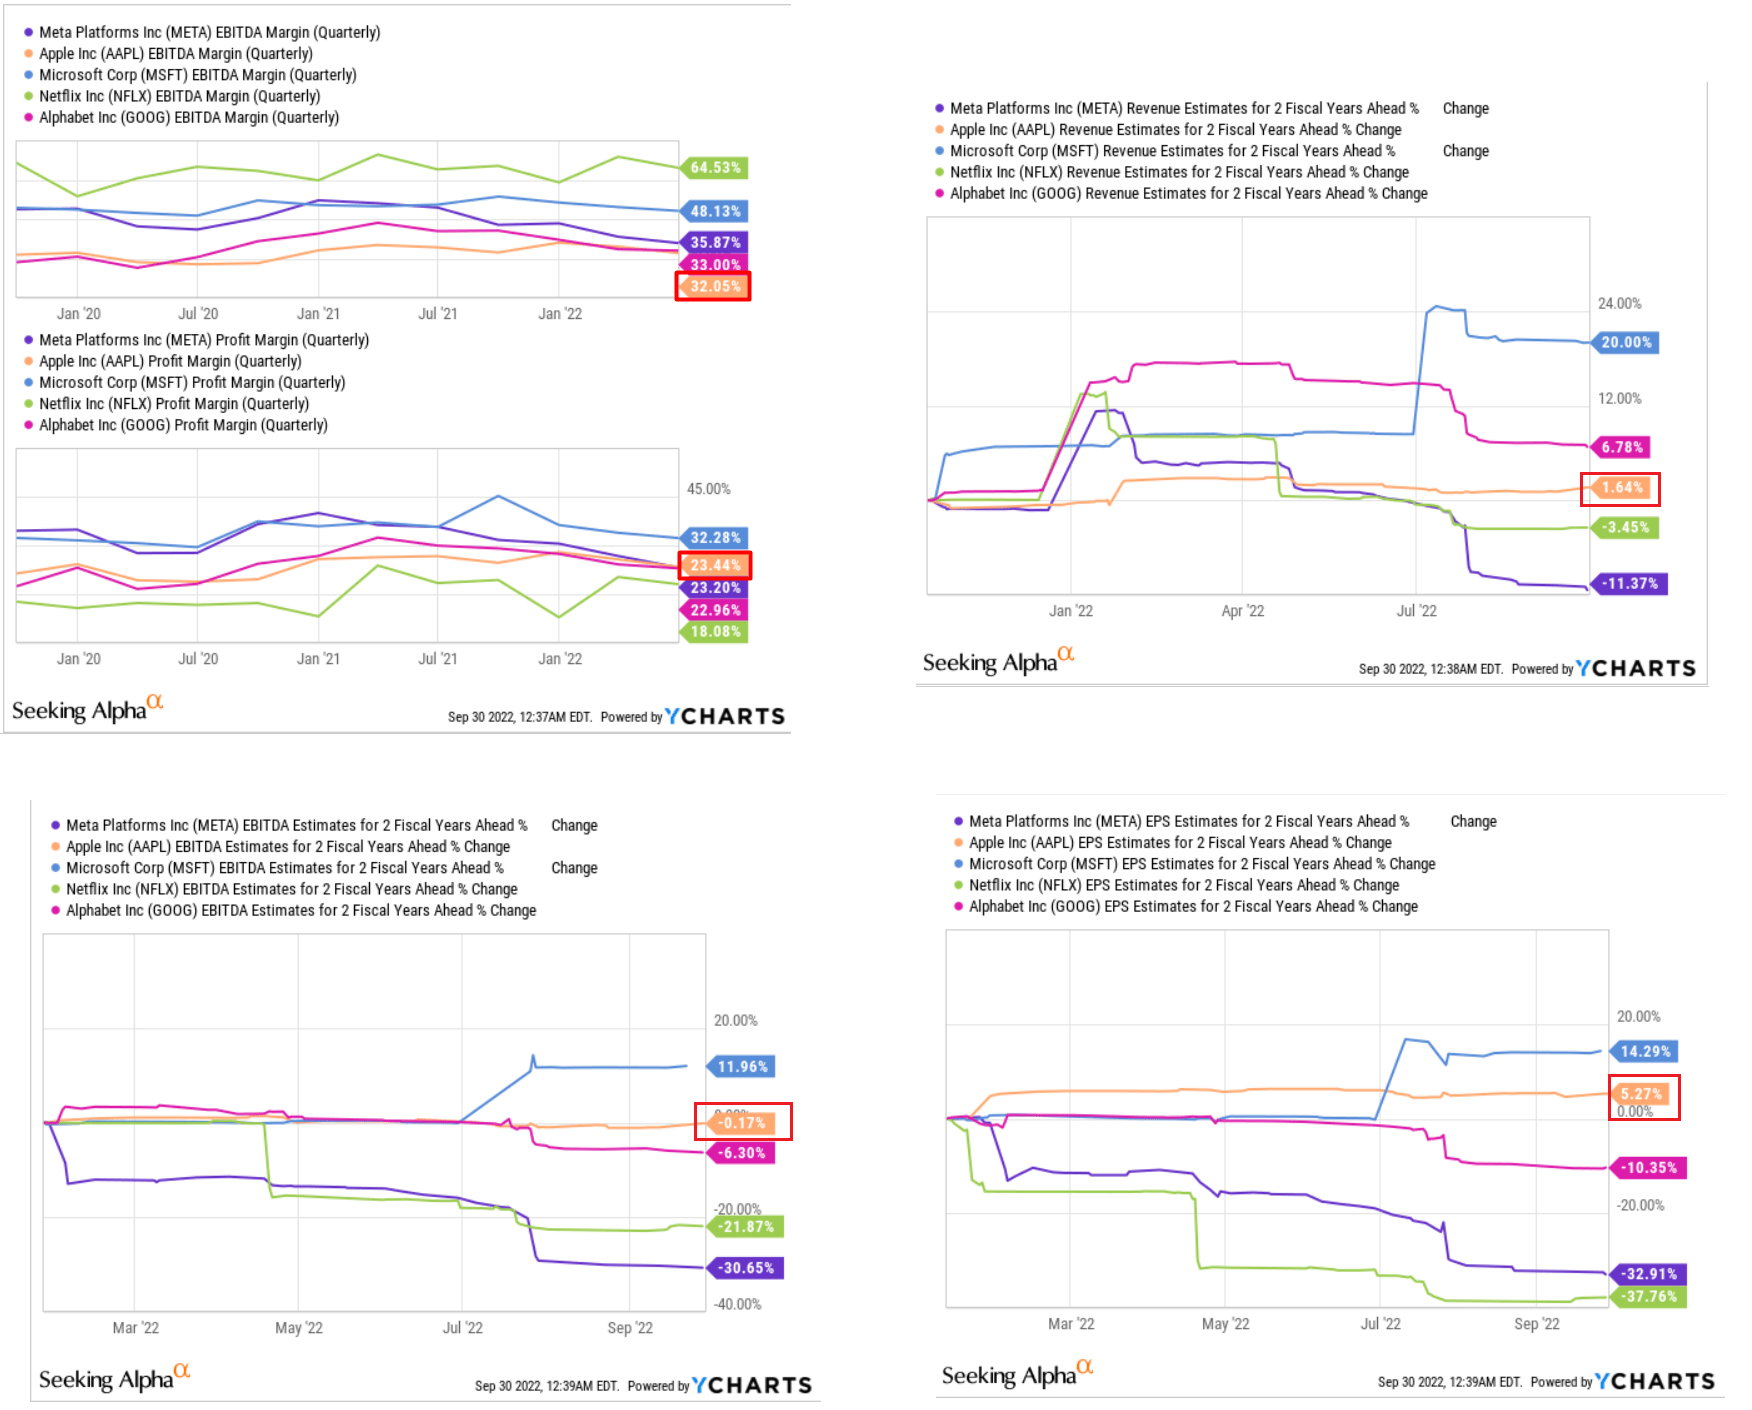
The company lags behind other mega-cap stocks in both sales/EBITDA/EPS growth forecasts and EBITDA margin.
That is why yesterday’s downgrade from Bank of America looks like the beginning of repricing. Let’s analyze that report to understand whether the new assumptions and forecasts of the analysts are reasonable.
BofA Global Research – Risk/reward more balanced again; Downgrading to Neutral; Price Objective of $160
Analysts: Wamsi Mohan, Ruplu Bhattacharya, Esha Vaish, Jong Lee
The analysts cut their rating from Buy to Neutral with a price target of $160, up 12.67% from yesterday’s close.
Here’s how the estimates have changed compared to the previous coverage:
BofA, AAPL, September 29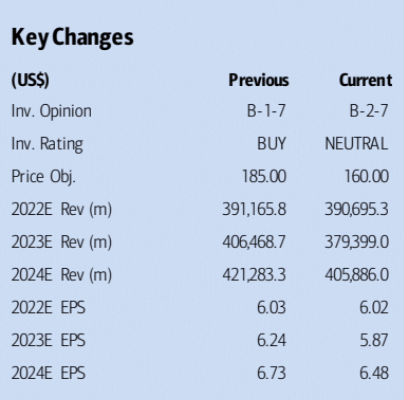
I suggest supplementing the news from SA with specific graphics from the report itself so that readers have an idea of the conclusions the analysts reach.
Mohan noted that the iPhone 14 cycle may be weaker than anticipated as risks to consumer spending remain elevated and lead time data started to moderate, even for Pro models. There’s also concern for its near-term Services business, as there is an “incremental risk” of deceleration, even with the App Store and Licensing accounting for 60% of revenue.
Source: SA News
iPhone 14 Pro lead times are currently lower versus 13 Pro at this time last year. iPhone 14 Pro Max lead times have come in (reduced) and are now on par with iPhone 13 Pro Max at this time last year.
BofA, AAPL, September 29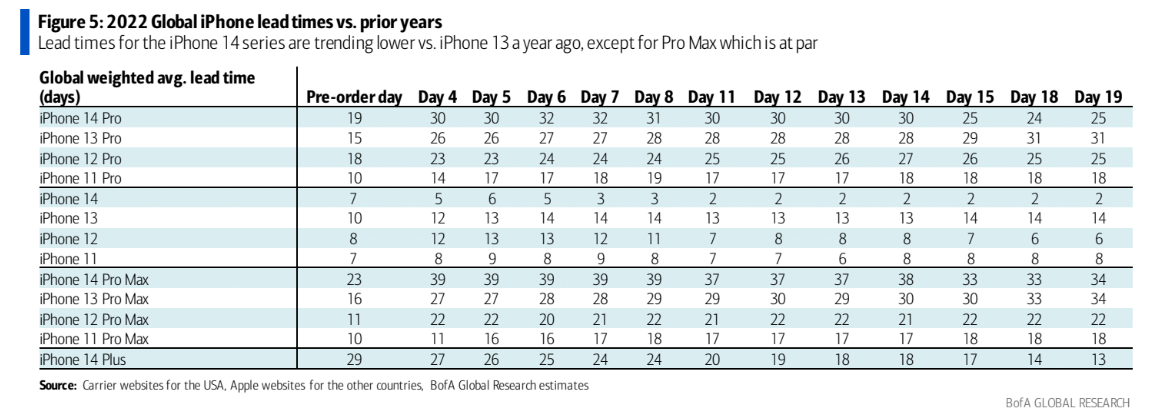
Focusing on the products mix, analysts come to the following conclusion:
Other worries include a stronger mix towards the iPhone 14 Pro not being able to offset a decline in revenue and profit if overall iPhone units decline, a reversion to pre-COVID levels for the iPad and Mac, as well as pressure from a stronger U.S. dollar.
Source: SA News
We recall that Pro’s sales have been doing well so far, but even if its share of the sales mix improves, it is unlikely to help the company under different scenarios:
BofA, AAPL, September 29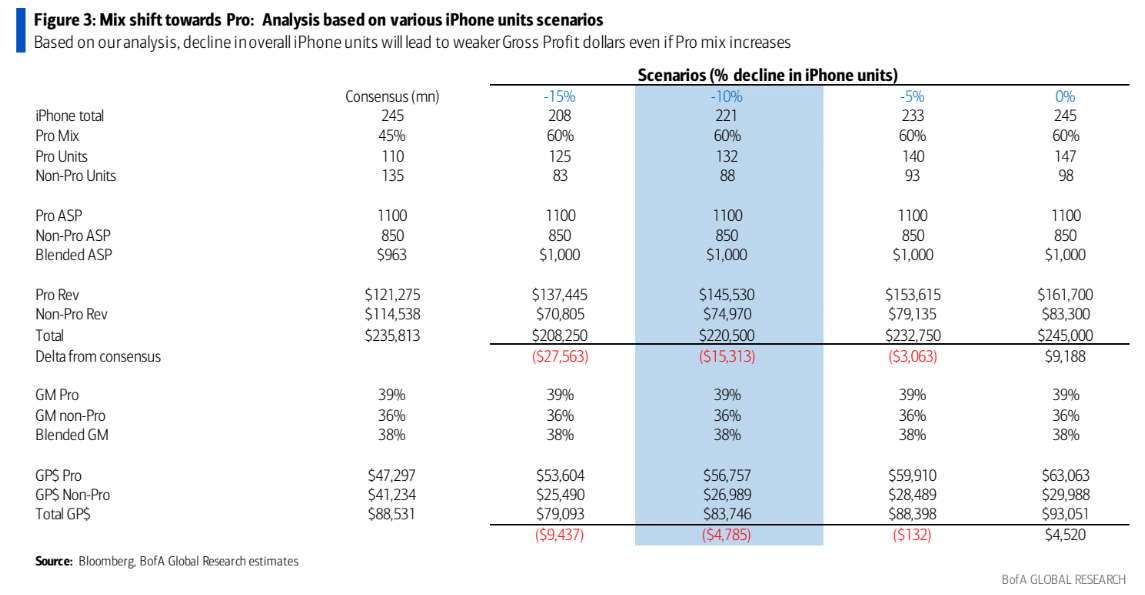
Analysts further predict that sales volumes are likely to decline, hitting FY2023 revenue harder than previously thought:
Mohan added that he now sees iPhone sales figures at 219M, compared to Wall Street estimates of 245M, while iPad revenue figures should be roughly $22B, well below the $31B Wall Street is expecting. Services revenue is also expected to come in below consensus estimates, at $85B compared to $88B.
Source: Seeking Alpha News
At first glance, it may look as if these are minor changes – however, they have already predicted a decline for 2023, which in the updated form now looks anything but rosy:
BofA, AAPL, September 29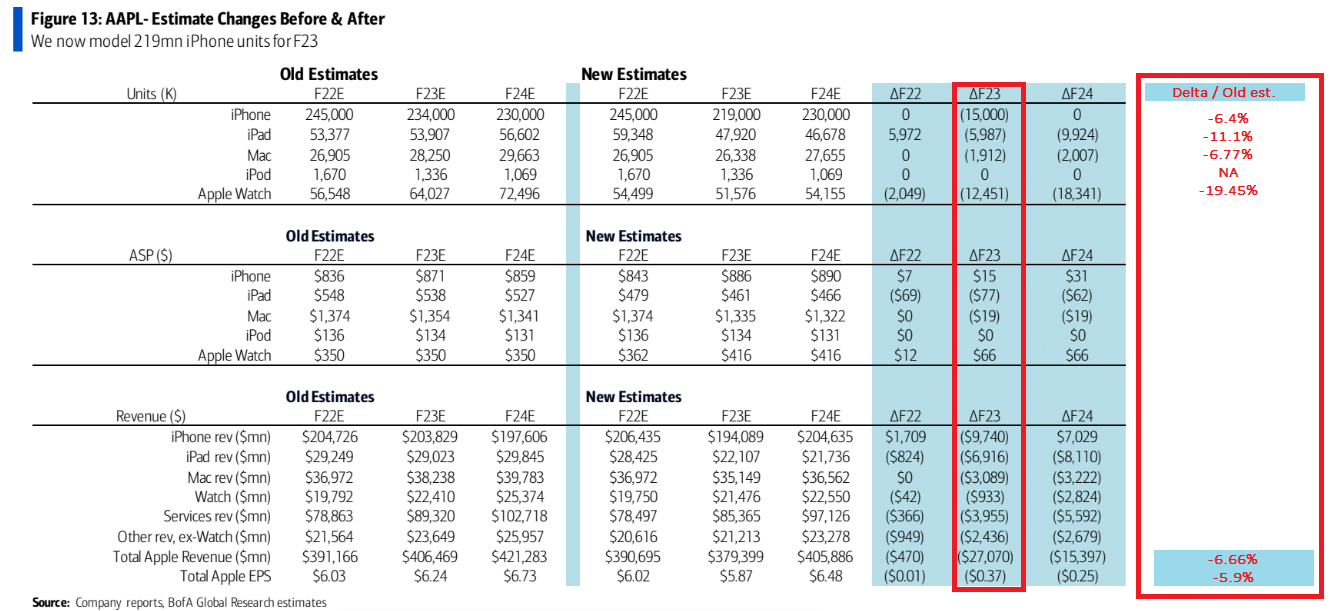
BofA states that all of this will eventually be reflected in the gross profit of the company, whose dynamics are now at odds with the behavior of the stock:
BofA, AAPL, September 29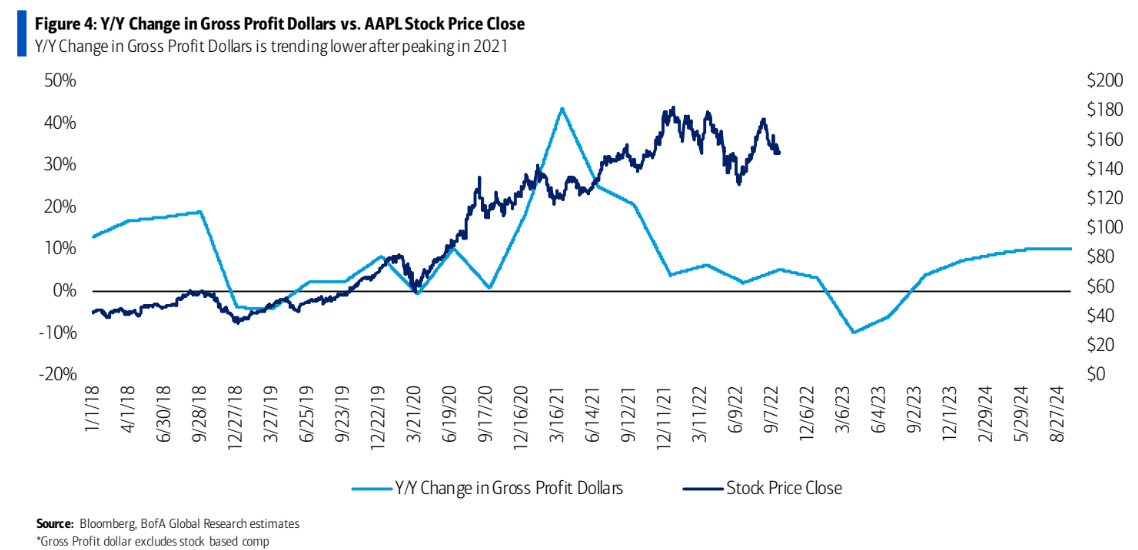
I see no discrepancy with the logic of the BofA report – a slowdown in the company’s growth and even a decline in individual indicators is predictable given the state of consumer demand in Europe and Asia and given the sales volumes in these markets. A strong dollar could easily cause sales to shrink more in absolute terms than is priced in at this point.
The only thing that confused me was the FY23/FY24 multiples that analysts use for their price target estimates:
BofA, AAPL, September 29 [with author’s notes]![BofA, AAPL, September 29 [with author's notes]](https://static.seekingalpha.com/uploads/2022/9/30/49513514-16645226686613424_origin.png)
Paying 25.5 times FY2023 net income and 19.4 times FY2023 EBITDA for a company whose volume is falling and whose prospects are probably bleak? No thanks. This is well above the median of the last 10 years, suggesting AAPL could fall many more basis points lower from where it’s at now.
As Crescat Capital recently wrote in a Sept. 28 note, we are in for a significant downtrend when compared to the tech bust of the early 2000s at the time of its expiration.
Crescat Capital, September 28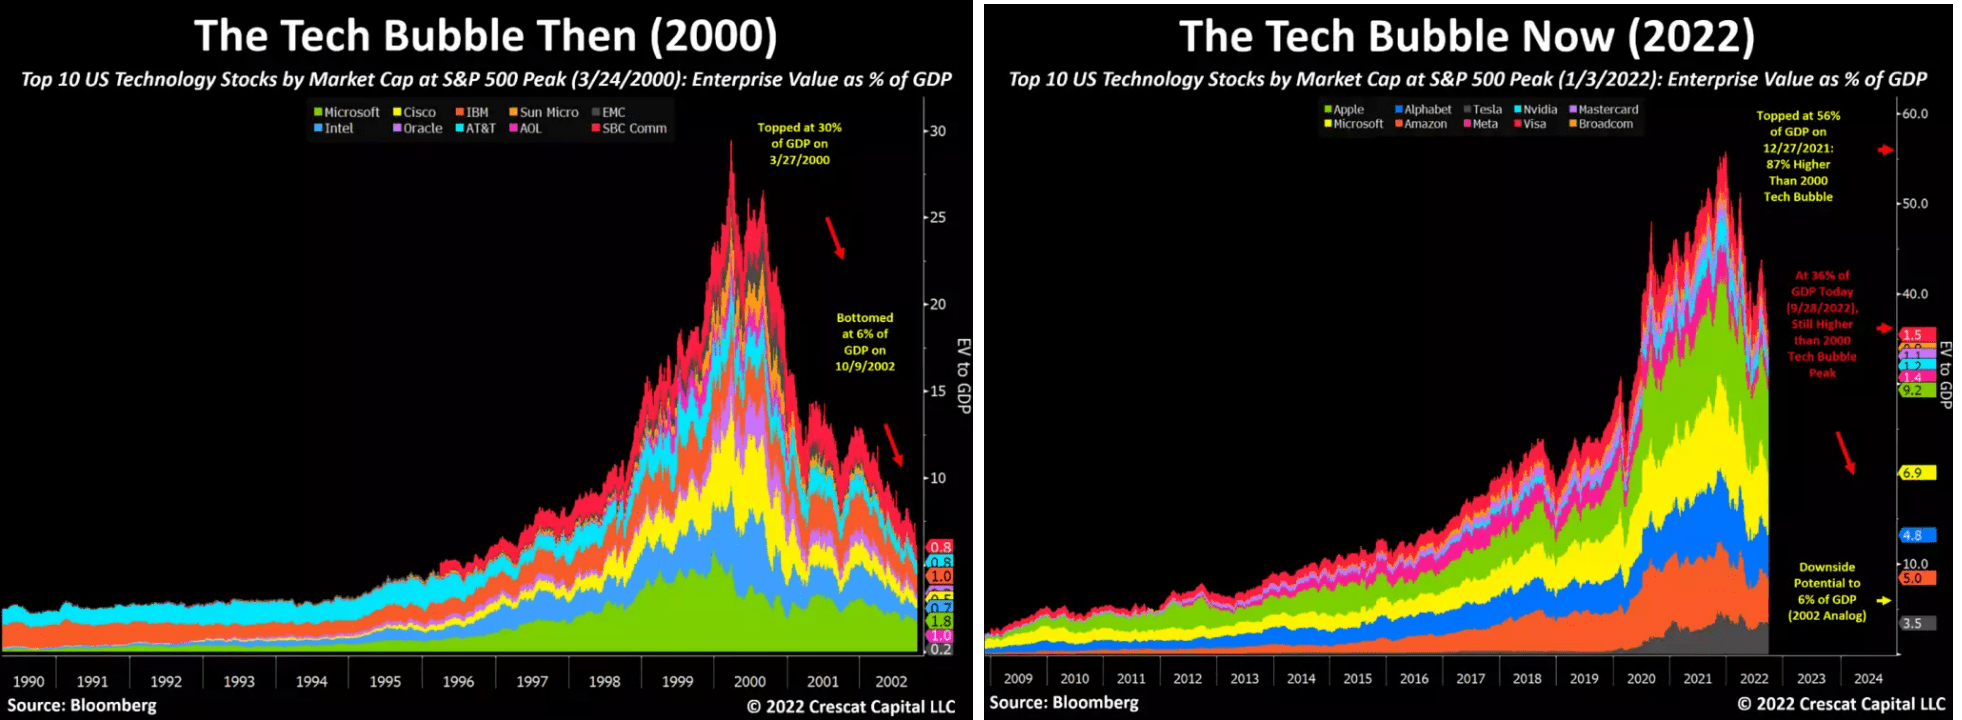
Crescat’s Global Macro Hedge Fund is up 38.8% over the past year, which, as you can imagine, is significantly better than the market. Since this fund was launched in 2006, it has returned 658.1% – more than 3 times the return of the S&P 500 Index over the same period. This is a word about the weight of authority of these guys.
Technicals
Just yesterday I put together a newsletter for subscribers to our service with a detailed analysis of the latest bank reports. This is what it looked like:
Beyond the Wall Investing’s newsletter [published yesterday]![Beyond the Wall Investing's newsletter [published yesterday]](https://static.seekingalpha.com/uploads/2022/9/30/49513514-16645244501823034_origin.png)
Author’s note: the main conclusions have been hidden to ensure exclusivity for paid subscribers of our service.
One of the charts that caught my eye while studying the report by Stephen Suttmeier (Technical Research Strategist at BofA) is the relatively unreliable level of the technology sector, which broke through its support level in relation to the SPX after yesterday’s sell-off:
Bank of America, September 27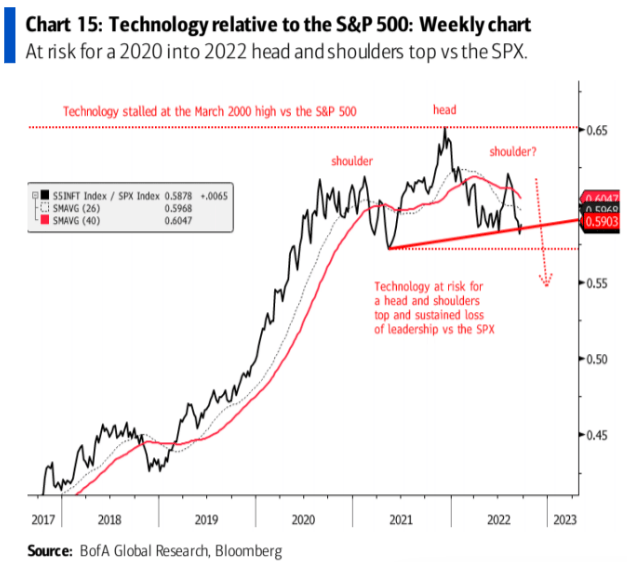
Against this background, Apple has little chance of remaining the last stronghold in this sector in my opinion.
If you look at Apple’s technical picture, it has little chance of showing a recovery shortly sufficient to offset all the risks a potential investor is taking on. Yes, the stock is heavily oversold at the moment, and there is strong support ahead that could drive the AAPL price higher for a short while. This is one of the reasons why I am still neutral and not a bear.
The trading strategy based on buying AAPL when its RSI is below 35 and then selling when it’s above 68 has yielded +14.46% over the past year and calls to buy AAPL now:
TrendSpider, AAPL, RSI strategy, author’s notes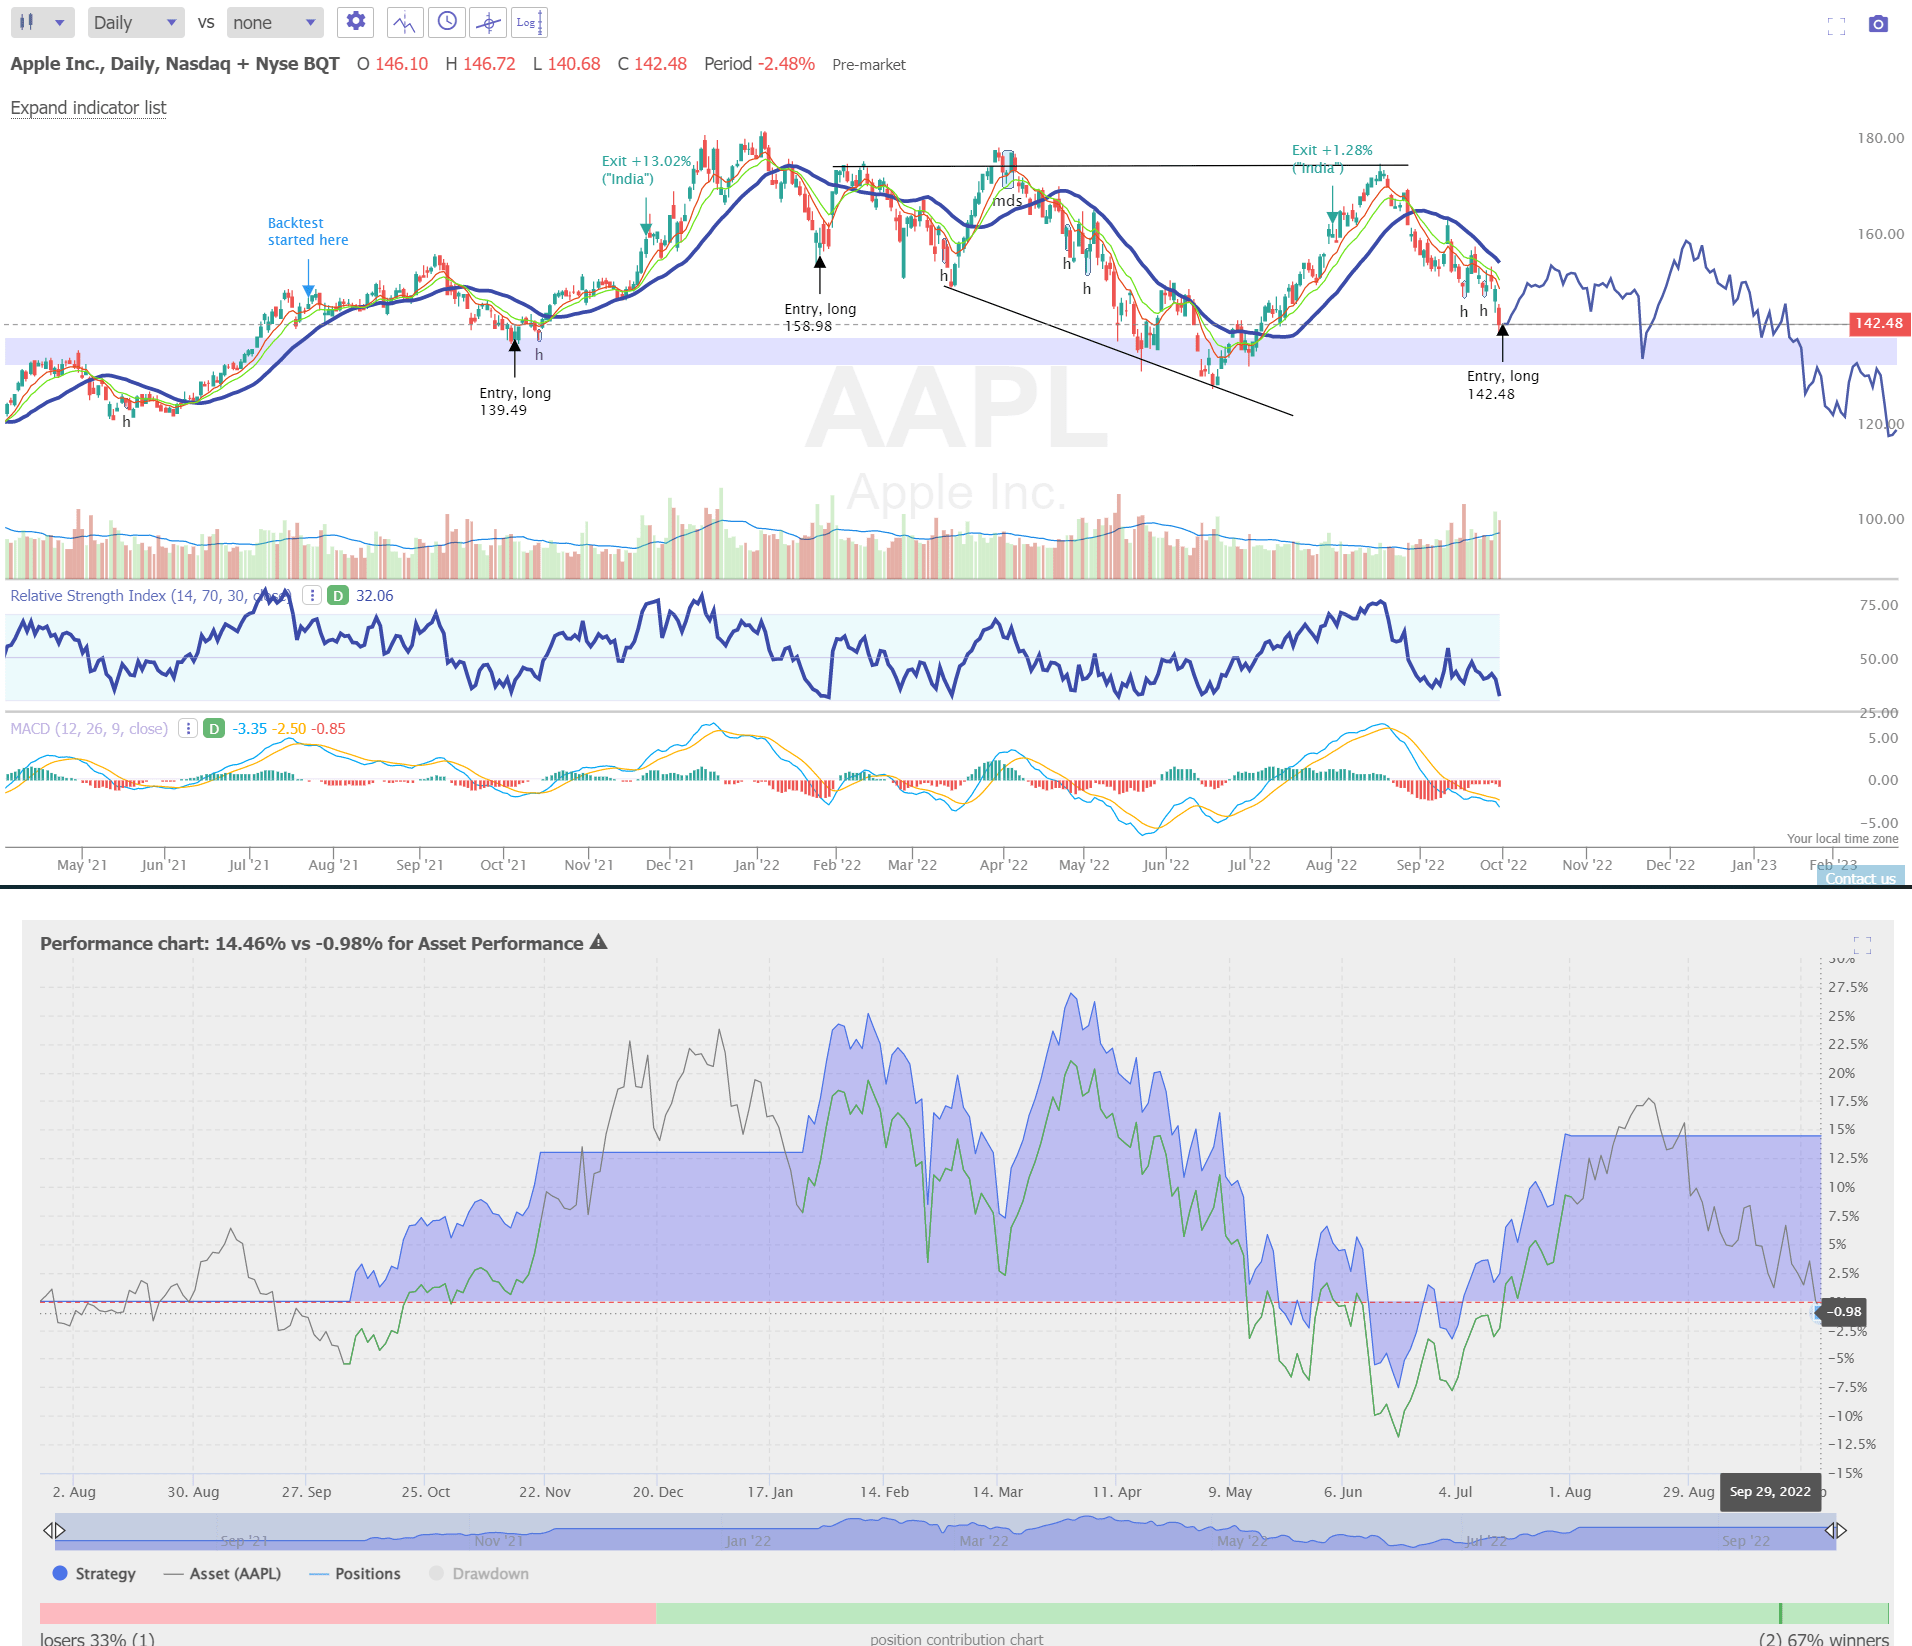
However, as practice shows, this strategy has led to significant losses at some points of implementation – this must be taken into account by anyone who wants to buy AAPL now based on its oversold levels. And yeah, all technicals are very conditional – the key drivers, in my opinion, are future operating growth and valuation, and Apple Inc. currently has problems with both the first and the second.
Thank you for reading to the end! If you enjoyed this article, please consider subscribing. I am eager to read what you think in the comments below.
Be the first to comment