

Oat_Phawat/iStock via Getty Images
Part I – Introduction
On February 22, 2022, Johannesburg-based AngloGold Ashanti (NYSE:AU) released its H2 2021 results ending on December 31, 2021.
The recovery from a challenging H1 2021 is ongoing, with a 12% increase in production in H2 2021. Moreover, cash costs fell 8% over that period.
The Company continued to show exploration success, with the addition of 2.7Moz of new Ore Reserve in 2021, more than replacing depletion. A 3.4Moz new Mineral Resource was added at the Silicon project in the US, and the Obuasi mine in Ghana resumed production in January 2022 as planned.
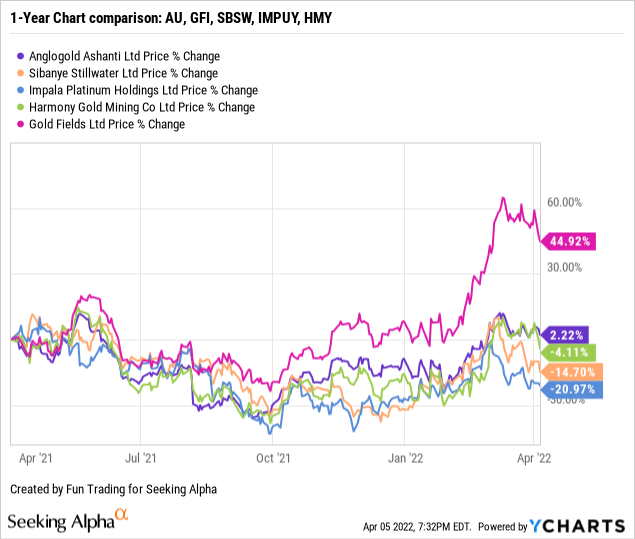
1 – Stock performance: One year
I am covering four other companies located in South Africa: Sibanye Stillwater (SBSW), Harmony Gold (HMY), Impala Platinum (OTCQX:IMPUY), and Gold Fields Ltd. (GFI).
AngloGold Ashanti has recovered significantly and outperforms the group (beside GFI) on a one-year basis with a 2% increase.
2 – Investment Thesis
AngloGold Ashanti is a robust gold miner with operations in three continents, making the business model safer.
Debt is in control, and the growth potential is here.
The Company continued to show exploration success, with the addition of 2.7Moz of new mineral Reserve in 2021, more than replacing depletion. Also, 3.4Moz new Mineral Resource was added at the Silicon project in the US.
Finally, the Obuasi mine in Ghana resumed production in January 2022. Phase 2 construction is complete, and Phase 3 is in progress.
AU: Obuasi update Presentation (AngloGold Ashanti)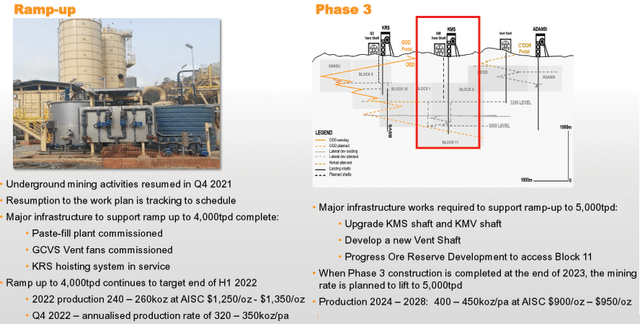
AngloGold Ashanti’s CEO Alberto Calderon said in the conference call:
We’re pleased to see a continuation of our operating parameters continue to stabilize, especially the 12% half and half gain from our operations excluding Obuasi. It’s encouraging to see the improvement underpinned by strong performances across most of our assets, which was driven by underground grades improving 19% half and half. We achieved our revised production and capital guidance and cost guidance was achieved when adjusting for the impacts of COVID-19.
Part II – Global Presentation and Gold Production
1 – Presentation
The company’s asset portfolio is extensive and exciting, with a long list of projects and extensions. I counted about 12 projects or extensions (Geita, Kibali, Siguiri, Iduapriem, Obuasi, Gramalote, Quebradona, Cerro Vanguardia, Serra Grande, Cuiaba, Sunrise Dam and Tropicana.)
As indicated above, AngloGold Ashanti owns operations in three continents even after divesting its South African assets to Harmony Gold.
Impressive mineral reserves growth:
AU: Mineral Reserves Presentation (AngloGold Ashanti)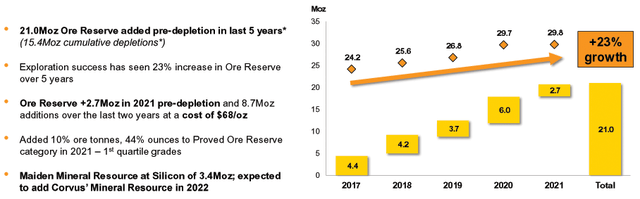
2 – Gold production details
The company indicated that it produced 1,272K Au Oz in H2 2021 (continued and discontinued), down 19.4% from a year ago. AngloGold Ashanti sold 1,269K Au Oz in H2 2021.
AU: 6-month Gold production history (Fun Trading)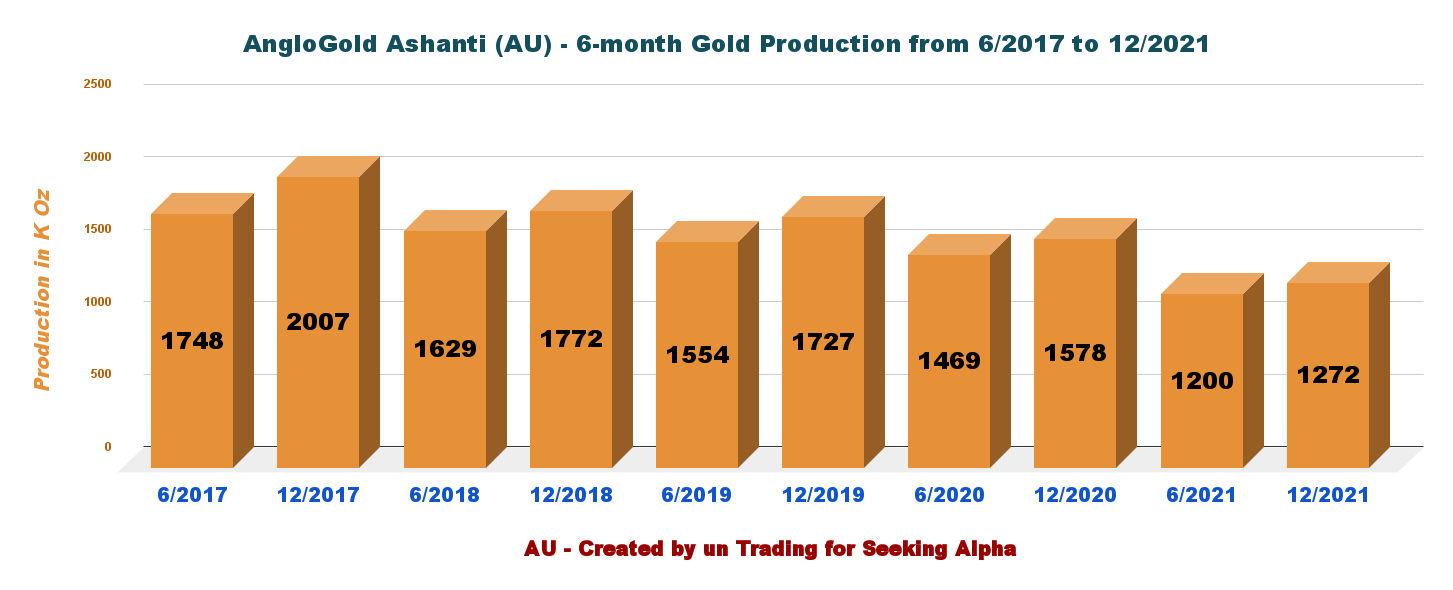
The company produced gold from ten different mines:
AU: 6-month Gold Production per mine in H2 2021 (Fun Trading)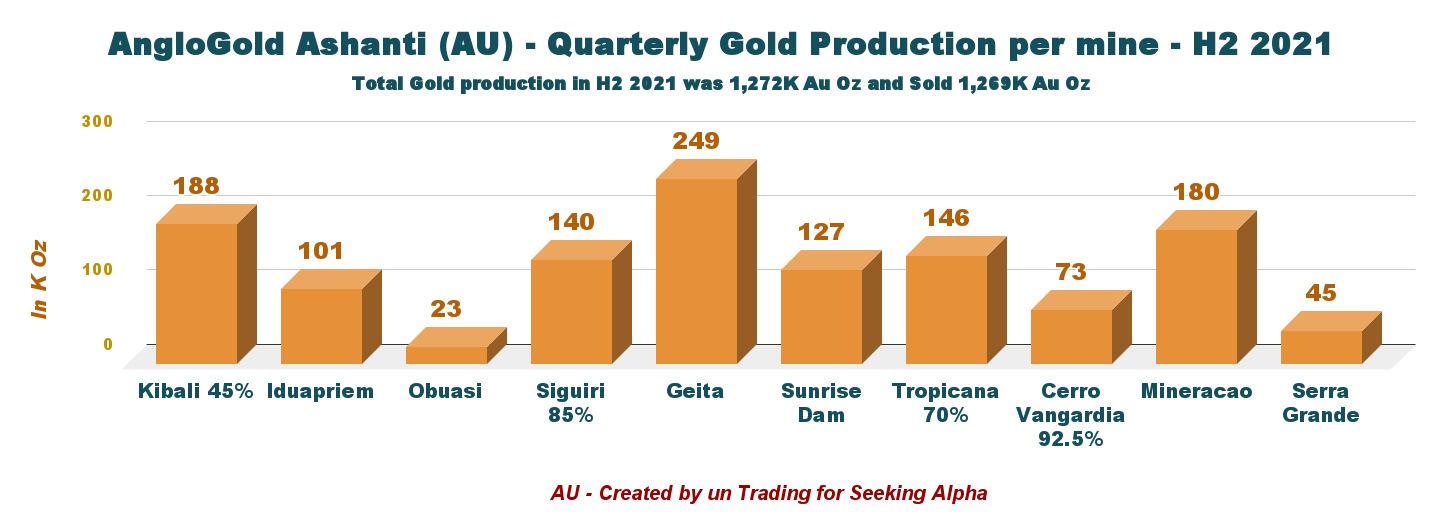
All-in sustaining cost (AISC) was $1,376 per ounce in H2 2021.
The AISC went up significantly due to the low gold production in H1 2021. Gold price realized in H2 2021 was $1,792 per ounce.
AU: 6-month AISC and Gold Price history (Fun Trading)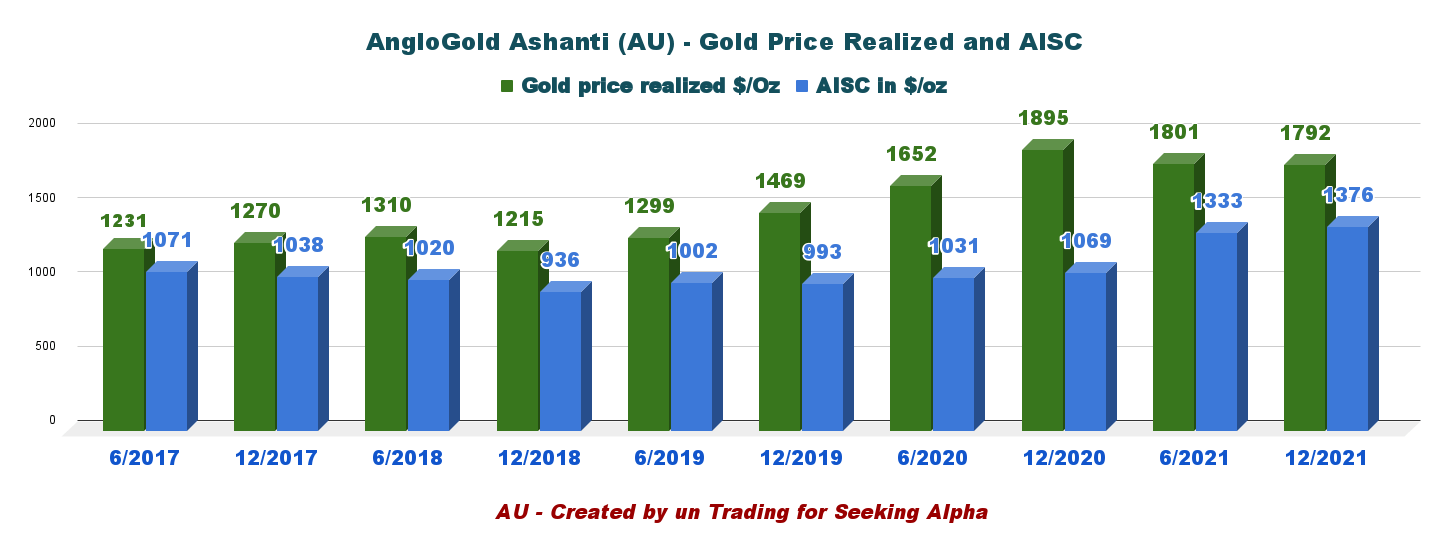
Note: On January 18, 2022, Corvus Gold and AngloGold Ashanti announced the completion of the acquisition of Corvus by AngloGold Ashanti.
Part III – AngloGold Ashanti – Balance Sheet and Production History for H2 2021: The Raw Numbers
Note: Like most South African gold and PGM miners, full results are posted every six months, complicating the analysis.
| AngloGold Ashanti | 12/2019 | 6/2020 | 12/2020 | 6/2021 | 12/2021 |
| Gold revenue in $ million (6 months) | 1,943 | 1,963 | 2,464 | 1,965 | 2,064 |
| Net Income in $ Million (6 months) | -121 | 421 | 532 | 362 | 260 |
| EBITDA $ Million (6 months) | 819 | 960 | 1376 | 775 | 724 |
| EPS diluted in $/share (6 months) | -0.30 | 1.00 | 1.27 | 0.86 | 0.62 |
| Cash from operating activities in $ Million (6 months) | 704 | 604 | 1,050 | 467 | 801 |
| Capital Expenditure in $ Million (6 months) | 439 | 307 | 395 | 429 | 598 |
| Free Cash Flow in $ Million (6 months) | 265 | 297 | 655 | 38 | 203 |
| Total Cash $ Million (6 months) | 466 | 1,292 | 1,330 | 1,081 | 1,154 |
| LT Debt (incl. current) in $ Million (6 months) | 2,033 | 2,728 | 1,931 | 1,929 | 1,909 |
| Shares outstanding (diluted) in Million (6 months) | 418.35 | 418.35 | 419.22 | 419.05 | 420.06 |
| Dividend $/sh | 0.09 | – | 0.48 | – | 0.53 |
| Gold Production (continued and discontinued) | 12/2019 | 6/2020 | 12/2020 | 6/2021 | 12/2021 |
| Gold production in K Oz | 1,727 | 1,469 | 1,578 | 1,200 | 1,272 |
| Gold production sold in K Oz | 1,691 | 1,515 | 1,567 | 1,214 | 1,269 |
| Gold price realized $/Oz | 1,469 | 1,642 | 1,889 | 1,801 | 1,792 |
| AISC in $/oz | 993 | 1,031 | 1,086 | 1,333 | 1,376 |
Source: Company filings
AngloGold Ashanti: Balance sheet details.
1 – Revenues and Trends. Revenues were $2,064 million in H2 2021
AU: Chart 6-month Revenues History (Fun Trading)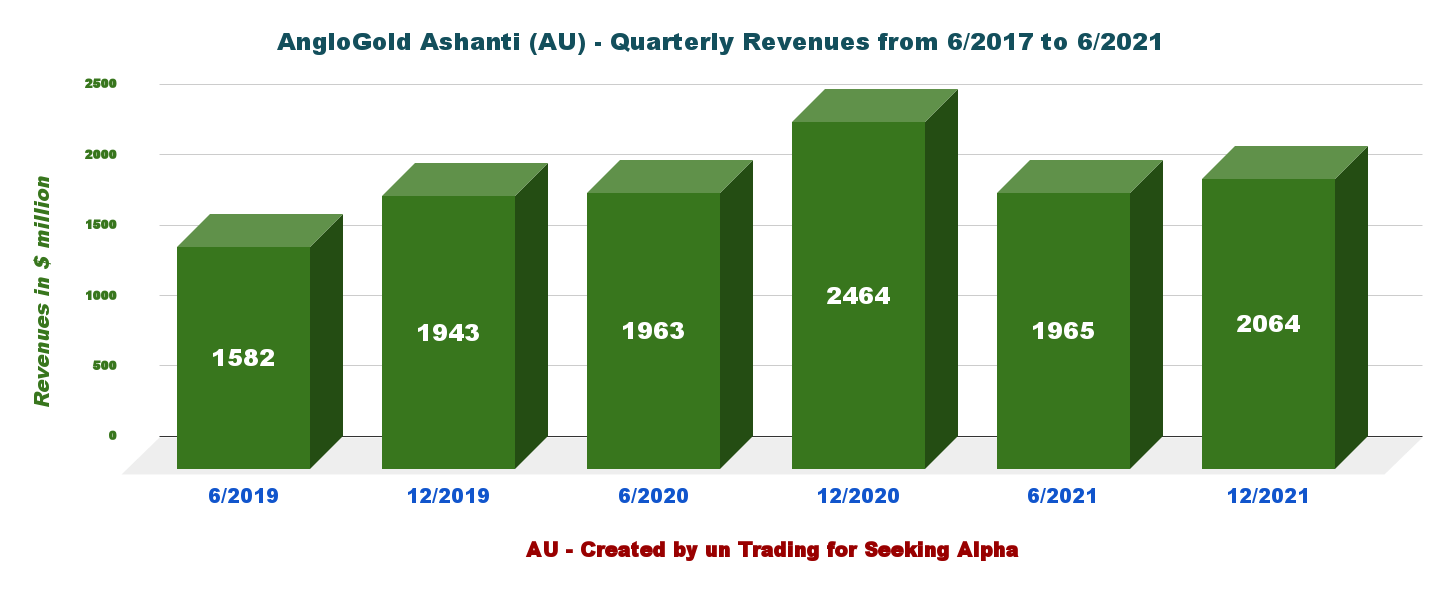
The revenues for H2 2021 were $2.064 billion, down 16.2% from a year ago. Net income was $260 million in H2 2021 compared to $550 million in H2 2020.
It was a challenging 2021, and the company said in the press release:
AngloGold Ashanti experienced a challenging 2021, including the ongoing COVID-19 pandemic and its impact on production and costs, lower realised grades across certain operations during the reinvestment phase and the temporary suspension of underground mining at Obuasi gold mine.
2021 Highlights:
AU: 2021 Highlight Presentation (AngloGold Ashanti)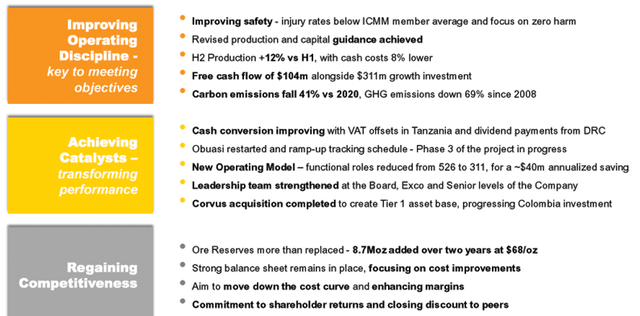
2 – Free cash flow was $203 million in H2 2021
AU: Chart 6-month Free cash flow history (Fun Trading)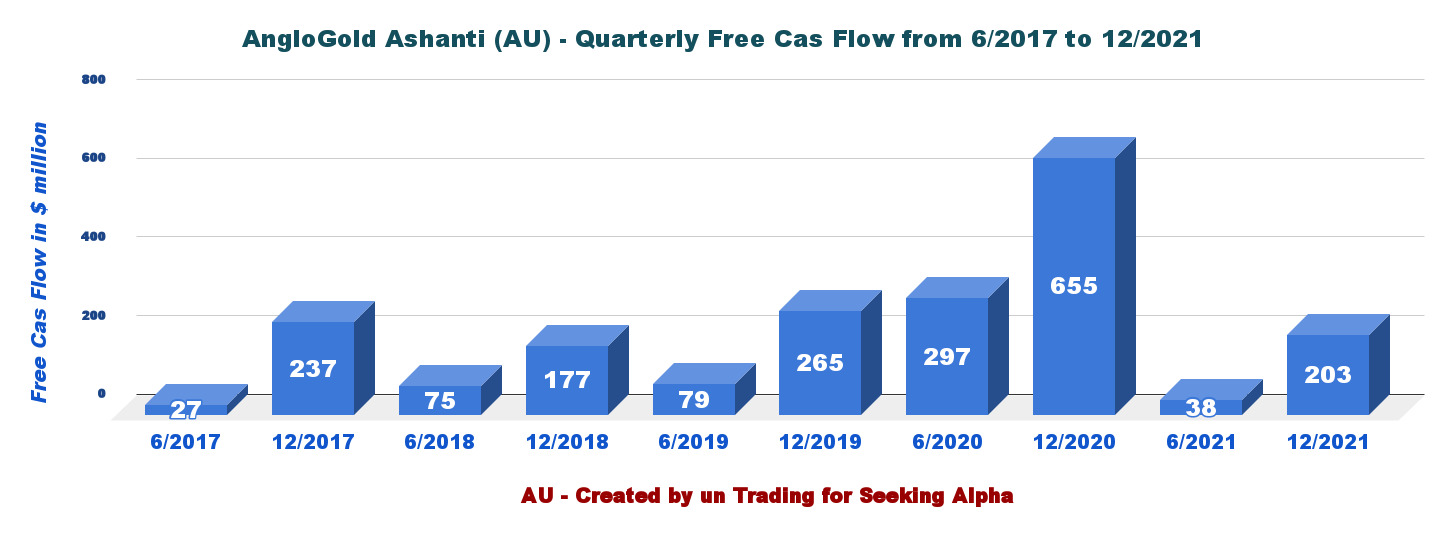
Note: Generic free cash flow is the cash from operations minus CapEx. AngloGold Ashanti’s FCF calculation came in at $129 million using a different free cash flow calculation.
Free cash flow for H2 2021 is now $203 million, compared to a free cash flow of $655 million in H2 2020.
3 – AngloGold Ashanti’s debt situation is excellent.
AU: Chart 6-month Cash versus Debt history (Fun Trading)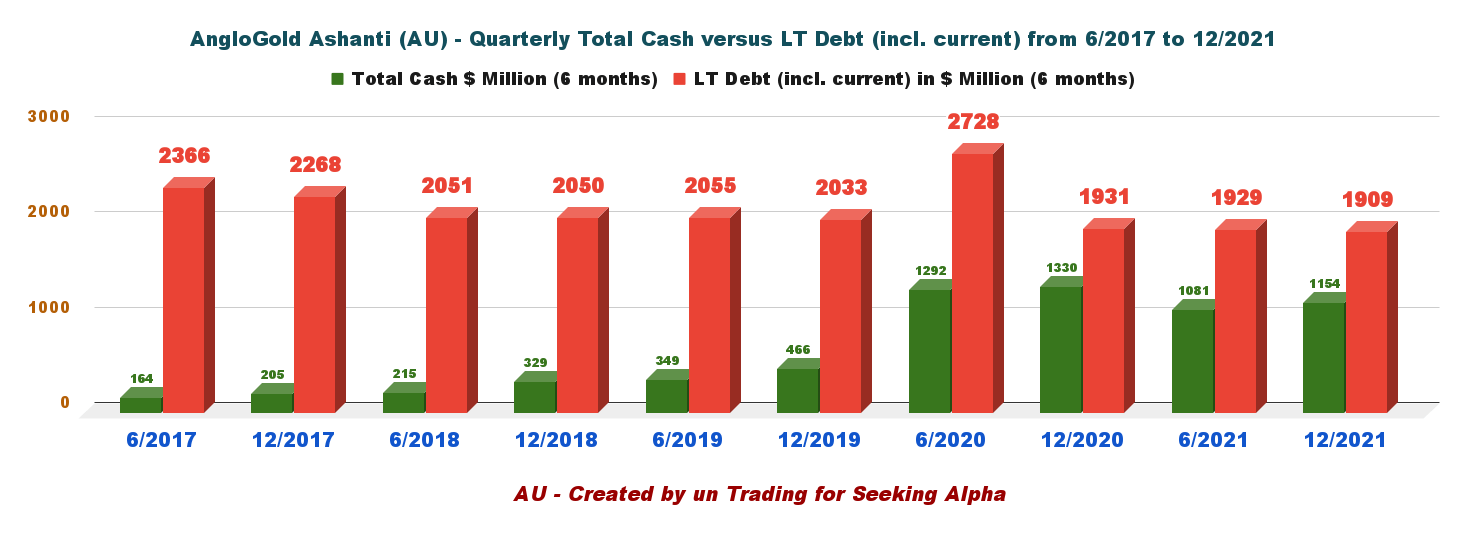
Total cash is now $1,154 million, and LT Debt (incl. current) at $1,909 million at the end of December 2021. Liquidity is $2.6 billion.
AU: Chart Balance sheet Presentation (AngloGold Ashanti)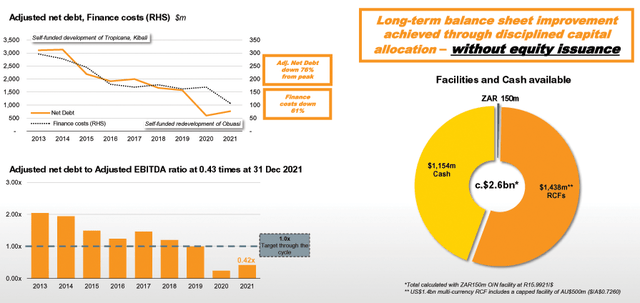
It is a solid debt profile that encourages investors to bet for the long term.
4 – 2022 guidance
2022 gold production is expected to be 2.55 Moz to 2.80 Moz, and AISC is seen between $1,295 and $1,425 per ounce ($1,360 midpoint).
CapEx will be between $1.05 billion and $1.15 billion.
AU: 2022 Guidance Presentation (AngloGold Ashanti)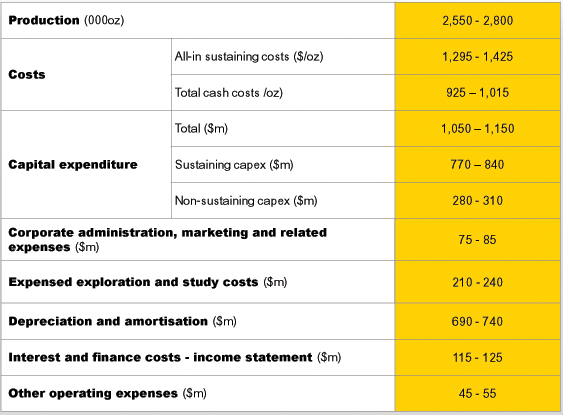
Part IV – Technical Analysis and Commentary
AU: TA Chart Short term (Fun Trading)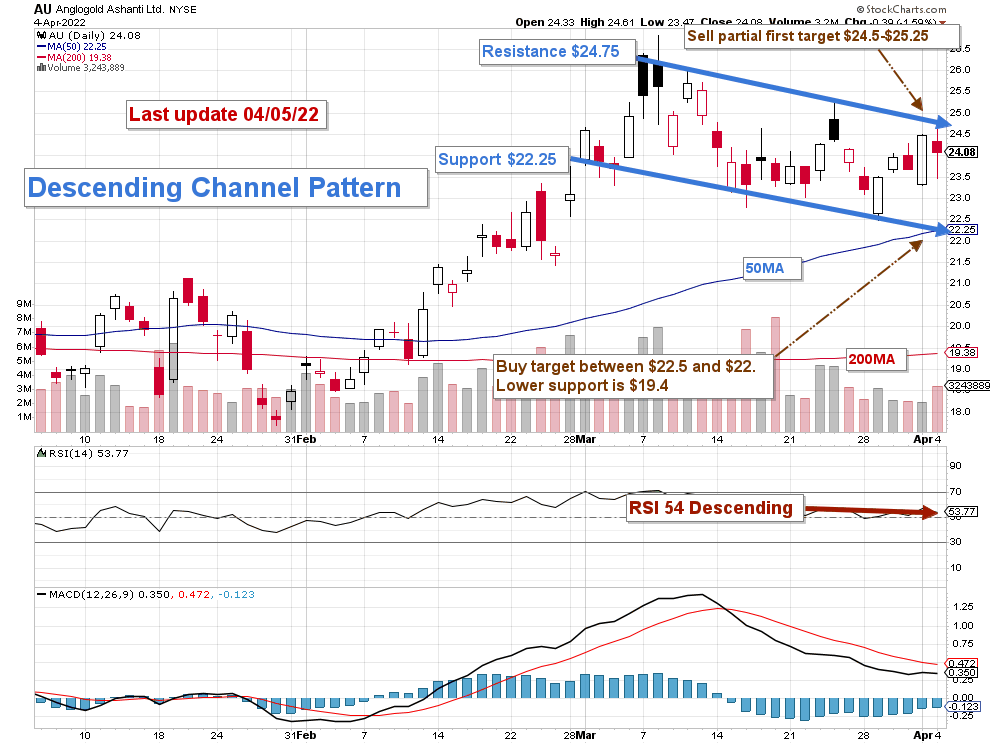
AU forms a descending channel pattern with resistance at $24.75 and support at $22.25.
The trading strategy is now to trade the channel and sell about 30% of your position between $24.5 and $25.25 and accumulate between $22.5 and $22.
I also recommend trading LIFO, which will let you wait for the recovery expected next year by keeping a core position long term.
Warning: The TA chart must be updated frequently to be relevant. It is what I am doing in my stock tracker. The chart above has a possible validity of about a week. Remember, the TA chart is a tool only to help you adopt the right strategy. It is not a way to predict the future. No one and nothing can.
Be the first to comment