

Olivier Le Moal/iStock via Getty Images
Thesis
Advanced Micro Devices (NASDAQ:AMD) has been under tremendous selling pressure, both in the open market and also among insiders. Its share prices have plunged by about 37% in the past 6 months in the open market. And insider transactions have been dominated completely by selling activities lately as you can see from the two charts below.
Source: DATAROMA Source: DATAROMA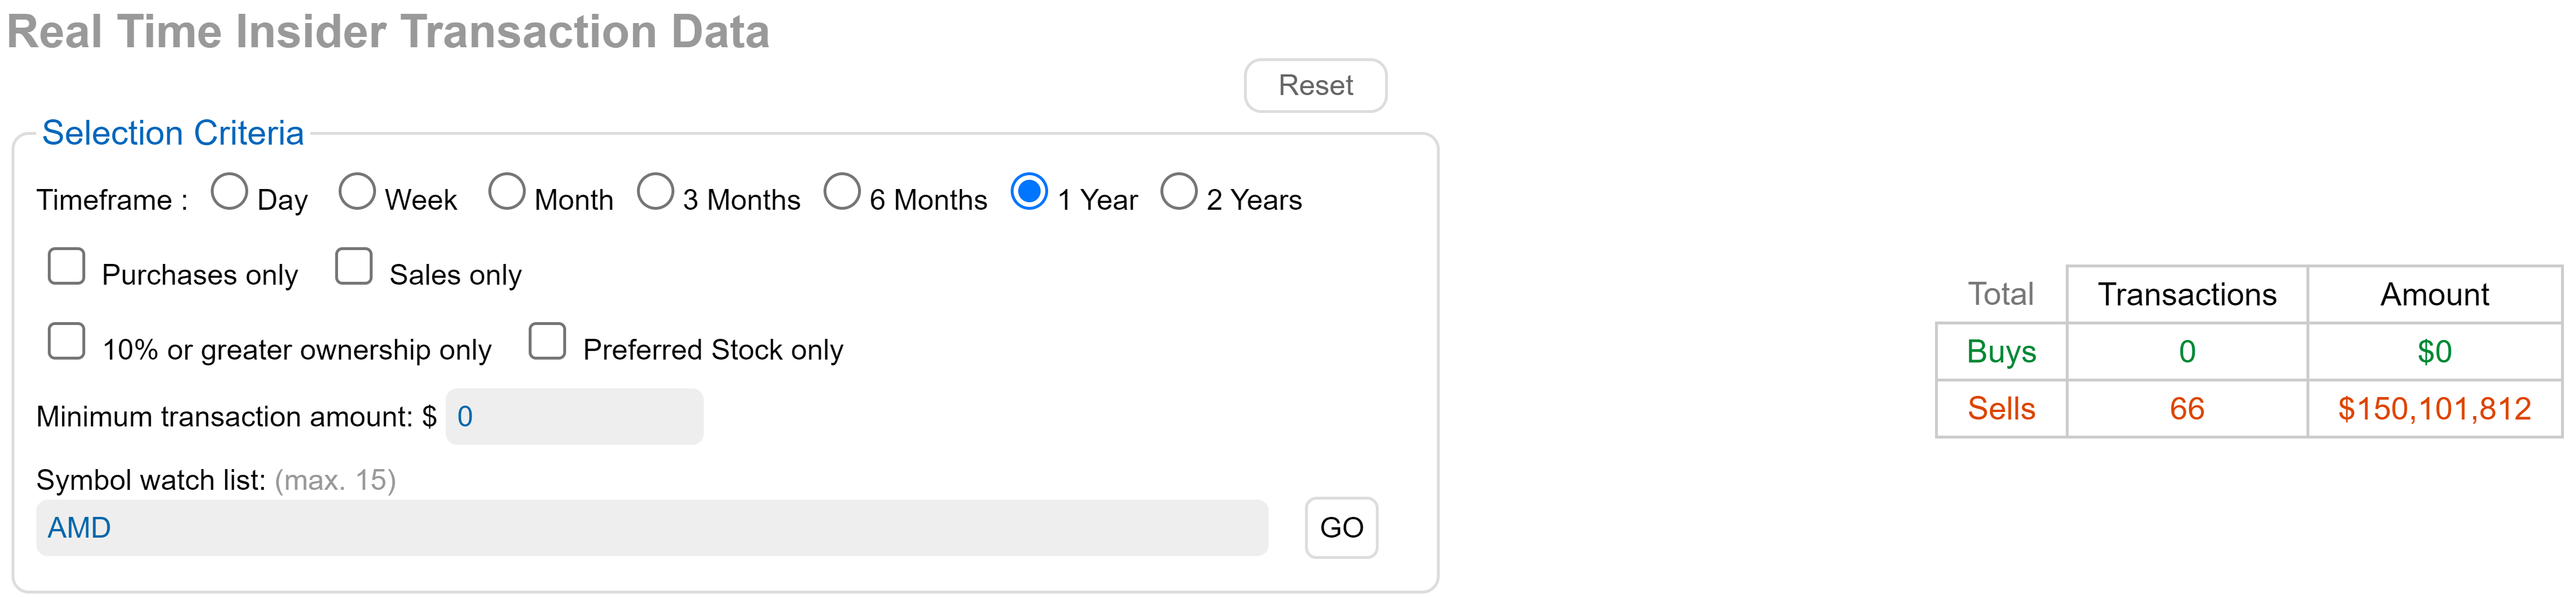
As explained in my earlier article:
When it comes to insider activities, usually I pay more attention to buying activities than selling activities. The reason is that selling activities can be triggered by a range of factors irrelevant to business fundamentals (such as divorce or buying a new house). In contrast, insider buying activities usually have only one explanation – the insiders think the stock is undervalued.
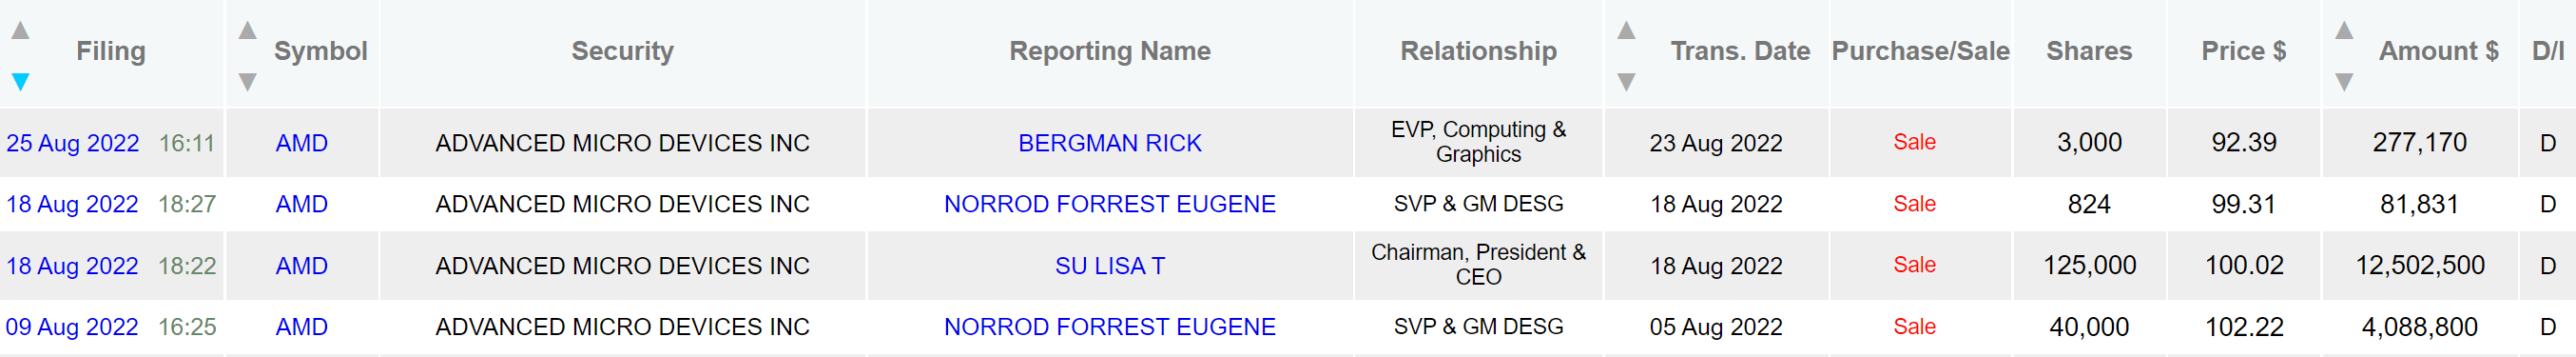
However, in AMD’s case here, when the insider activities are completely dominated by selling as seen above, it shows me that the fear has been overblown. To wit, over the past year months, there were a total of 66 insider transactions and all 66 of the transactions have been selling activities. All combined, these insiders sold a total of more than $150 million of AMD shares. In August alone, its CEO, EVP, and SVP sold a total of $17 million worth of shares.
And the thesis of this article is that the sellers, both in the open market and also the insiders (some of them at least), seem to completely ignore AMD’s business fundamentals. Next, I will argue that now is a good time to bet against even the insiders. Its current valuation, when combined with its excellent financial strength and growth potential, provides outsized return potential.
Profitability is superb
Comparing profitability is ultimately subjective but the overall picture is quite clear here in my mind: AMD earns superb profitability both relative to its peers and the overall economy. To put things in perspective, the following table also shows the gross profit margin of its close peers NVIDIA (NVDA) and Intel (INTC), and also Apple (AAPL). I am including AAPL here because it is often cited as the textbook example of premium pricing. To cite a few key metrics as shown in the chart below, AMD enjoys a gross margin of 50.7%.
It compares very favorably against NVDA’s 60.4% and INTC’s 49.8%, and more than 700 basis points above AAPL’s 43.3%. In terms of bottom-line metrics, although the comparison is a bit mixed, its margin is also quite impressive in general. For example, AMD enjoys a net margin of around 14.5% and lags the others. But its FCF margin of 16.8% compares very favorably against NVDA and AAPL (both in the 22% range) and far exceeds INTC’s 3.9%. To broaden the comparison a bit more, the average profit margin for the overall economy fluctuates around 8% and rarely goes above 10%.
Source: Seeking Alpha data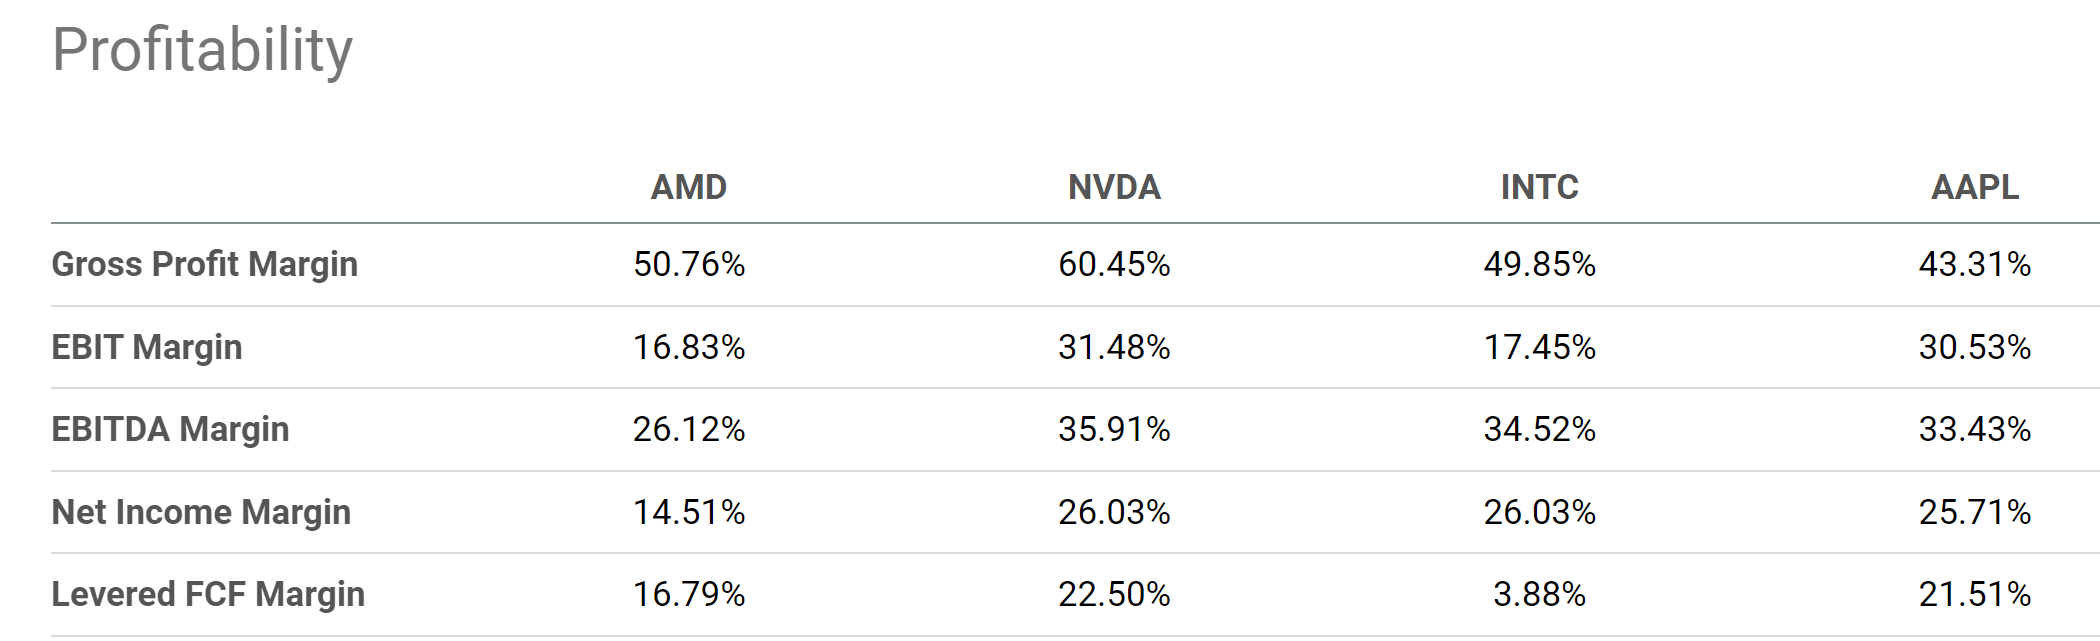
In addition to this snapshot of various metrics, I’d also like to draw your attention to the next chart, which shows a more fundamental profitability measure, the return on capital employed (“ROCE”). The chart also provides data over a longer period of time to provide a broader view. And as explained in our earlier writings, to us, the most important profitability measure is ROCE because it considers the return of capital ACTUALLY employed.
As seen, the ROCE comparison paints the same picture, probably an even stronger picture for AMD. NVDA’s ROCE has been quite stable since 2015 and is on average 60% since 2017. However, AMD’s ROCE has been exhibiting a robust expansion from below 20% in 2018 to the current level of 49%.
Looking forward, I see several catalysts to further expand its margin and ROCE including the recent Xilinx and Pensando. I expect the Pensando deal to expand its data center portfolio with a high-end processing unit and software lineup. I anticipate it to enable a broader portfolio of computer engines to augment its addressable market. The acquisition of Xilinx has also been proven to be extremely valuable so far and I expect more synergistic benefits to come as the integration deepens.
Source: Author based on Seeking Alpha data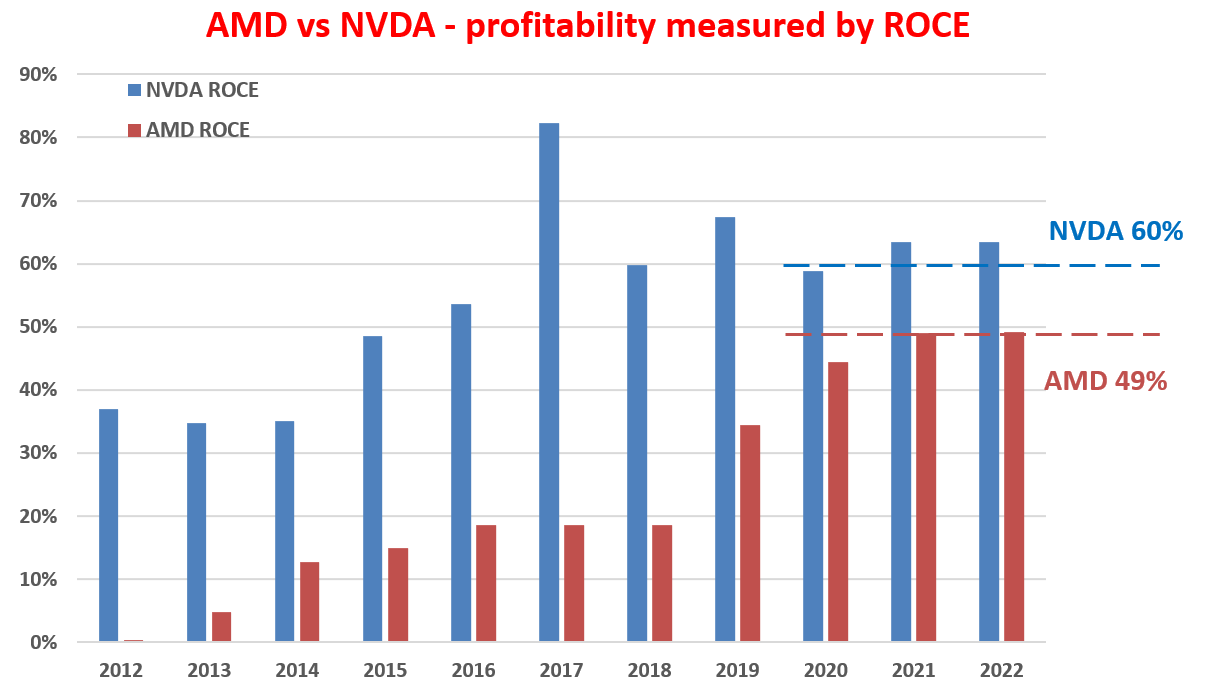
Capital allocation flexibility
At the same time, the company enjoys capital allocation flexibility despite the near-term headwinds. We can already appreciate the flexibility with its active acquisition activities as just mentioned. And another signal of its capital allocation flexibility is its share repurchase activities. The chart below shows its net common buyback yield. As you can see, it started buying its own shares aggressively in 2022. Its buyback yield is currently at 4.34%. Looking forward, I see the share repurchase continue. Early this year, the board of directors announced:
The approval of a new $8 billion share repurchase program. The new authorization is in addition to the $4 billion share repurchase program announced in May 2021, under which the company has repurchased approximately $3 billion of shares of AMD common stock.
AMD just repurchased nearly a billion dollars’ worth of stock in the past quarter alone. And management has not indicated any plans to slow down the announced program. An $8 billion repurchase program would reduce the company’s share count by a whopping 119 million when completed, which translates to about 7.3% of its outstanding shares. Such sizable repurchases, besides demonstrating its capital allocation flexibility, will also be very accretive to shareholder returns given its compressed valuation, as detailed immediately below.
Source: Seeking Alpha data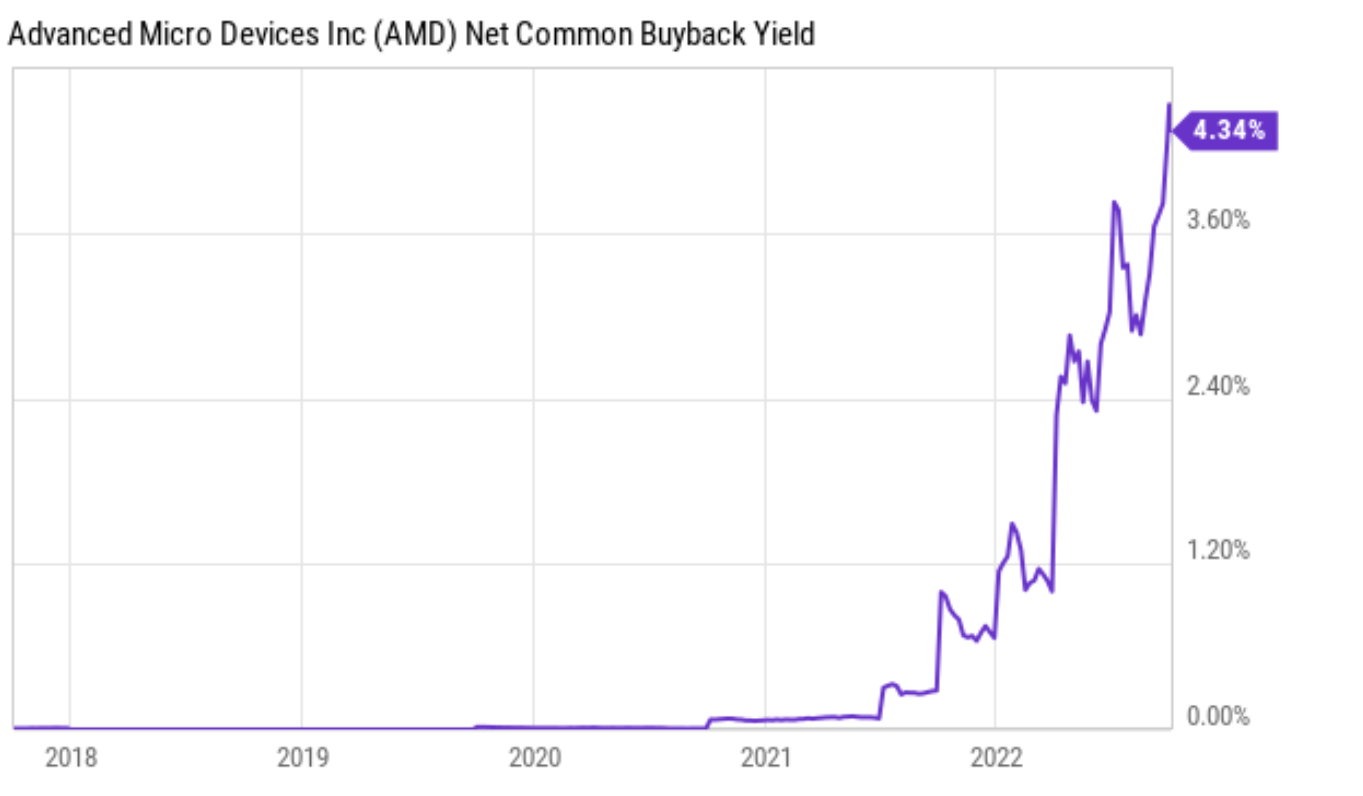
Valuation too attractive
As seen in the chart below, AMD currently trades at an FW P/E of only 15.7x, about half of its average valuation in the past few years. It is also discounted by about 60% from NVDA’s 38.6x.
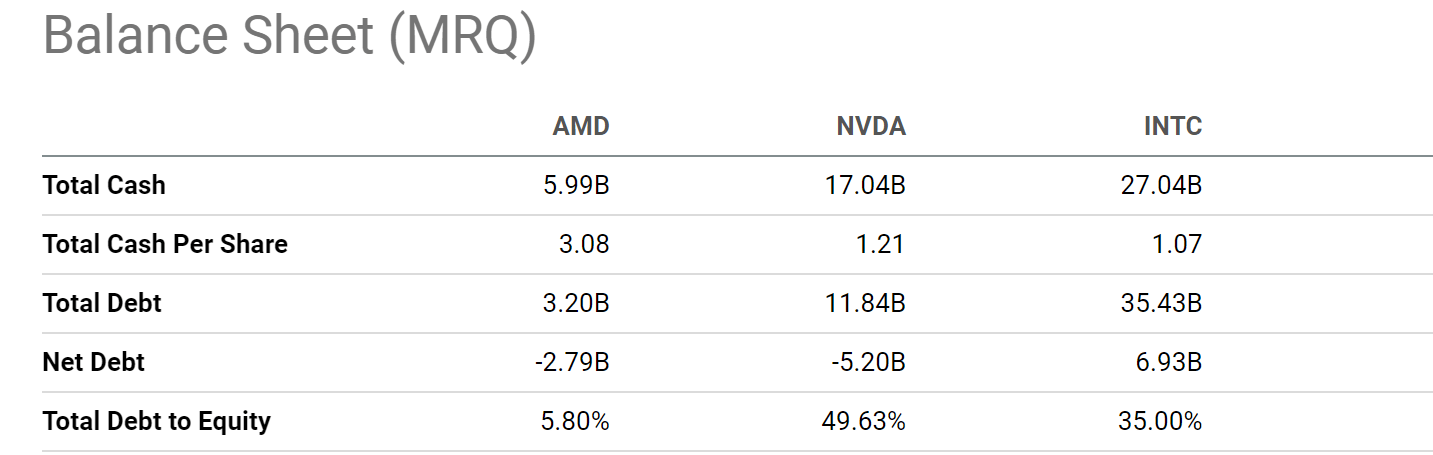
The valuation is even more attractive when adjusted for its cash position. Currently, AMD has about $5.99 billion of cash on its ledger, translating into $3.0 per share. It has some debt (a total of $3.2B) but the debt is lower than the cash position. As a result, it carries a sizable net cash position of $2.8B. At its current market cap of $102, about 3% of AMD’s market is just its cash. When we adjust the cash out of the stock price, its P/Es would therefore become lower by about 3% to be about 15.2x, too cheap for considering its growth potential to be discussed next.
Source: Seeking Alpha data Source: Seeking Alpha data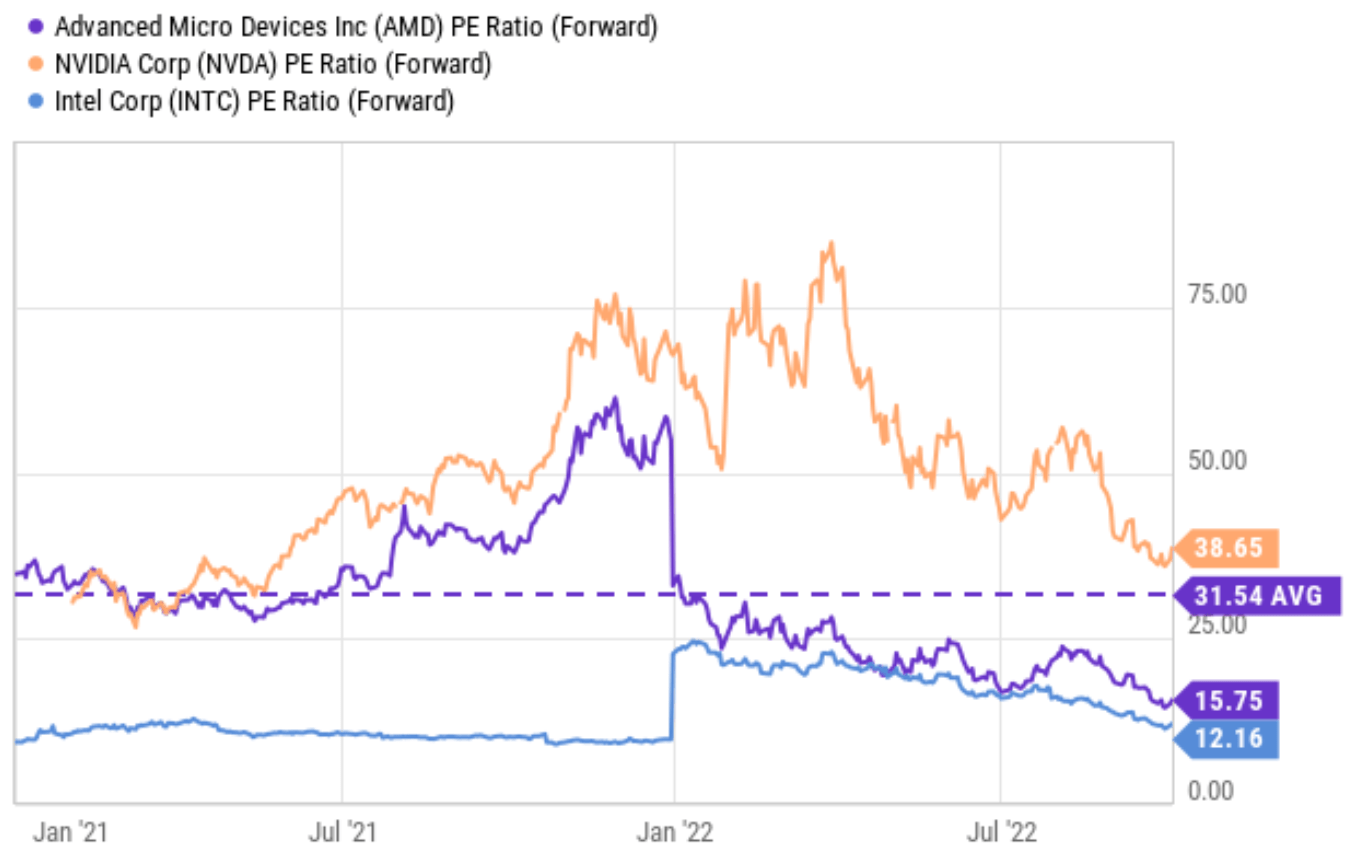
Growth is even cheaper
Consensus estimates project an EPS growth from $4.34 in 2022 to $7.17 in 2026, translating into a double-digit CAGR of 13.4%. And I think even this estimate is too conservative given the catalysts mentioned above (Xilinx and Pensando acquisition), its rapidly expanding ROCE, and also the tailwinds provided by the CHIPS Act. But even at a CAGR of 13.4%, its PEG ratio is only about 1.13x based on the 15.2x cash-adjusted P/E mentioned above.
Source: Seeking Alpha data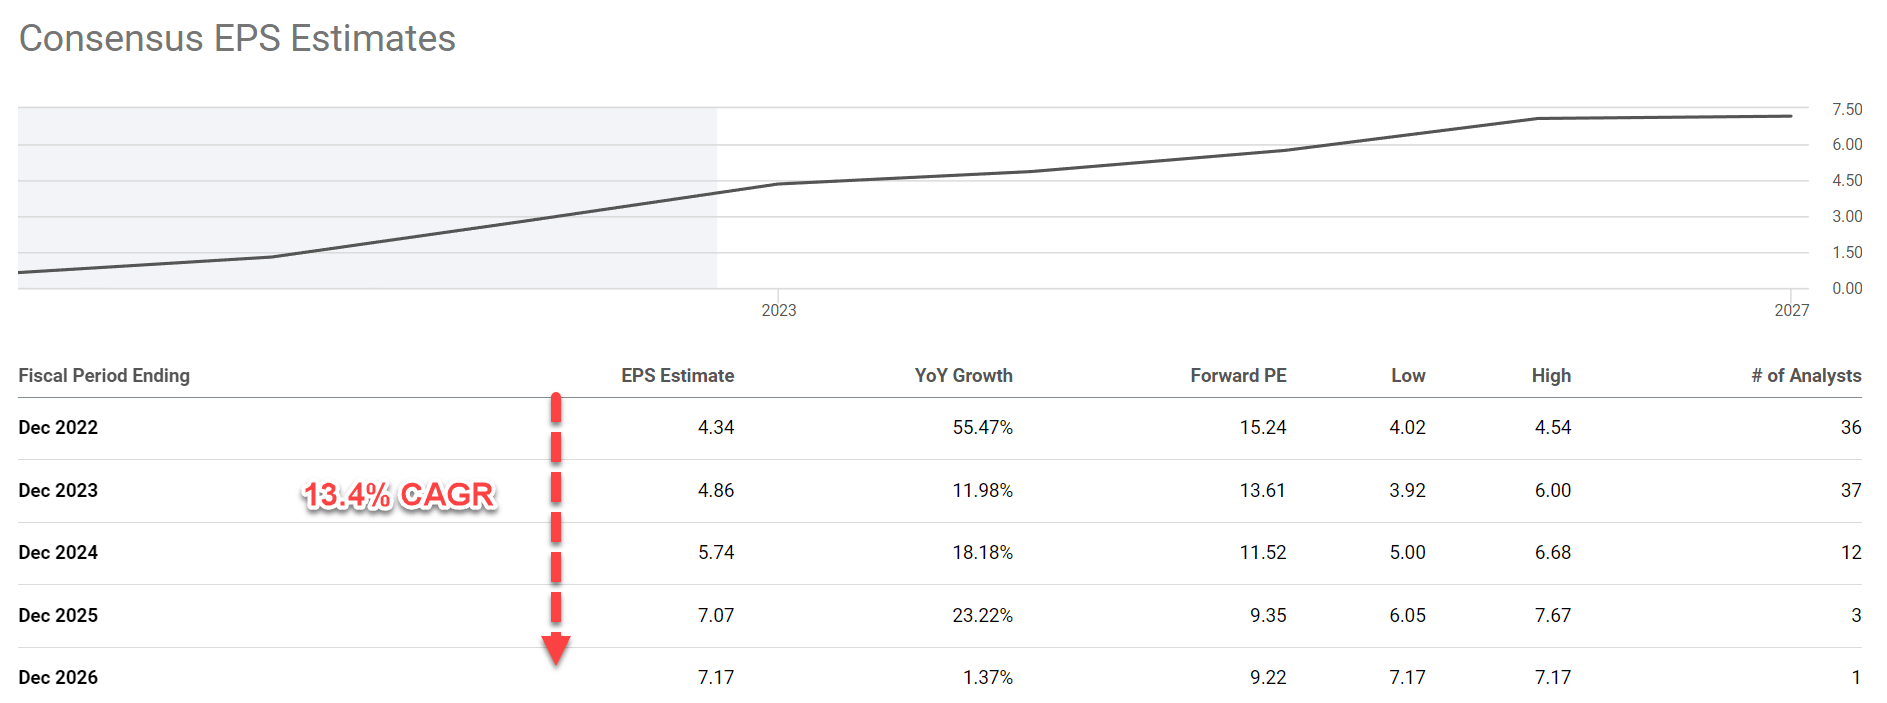
Risks and final thoughts
Finally, risks. Besides the macroeconomic risks (inflation, possible recession, et al), AMD also faces a few specific risks. Its June quarter earnings were lower than expected due to challenging operation environments, softening PC demands, and also the company’s focus on its acquisitions. All these factors are likely to persist in the next few quarters and weigh on the bottom line. Also, AMD has very likely over-expanded in the past few years and has some overcapacity to digest in the incoming quarters. As you can see from the following chart, its total headcounts have increased from about 9k in 2018 to the current level of 155K, an expansion of more than 70% increase.
Source: Seeking Alpha data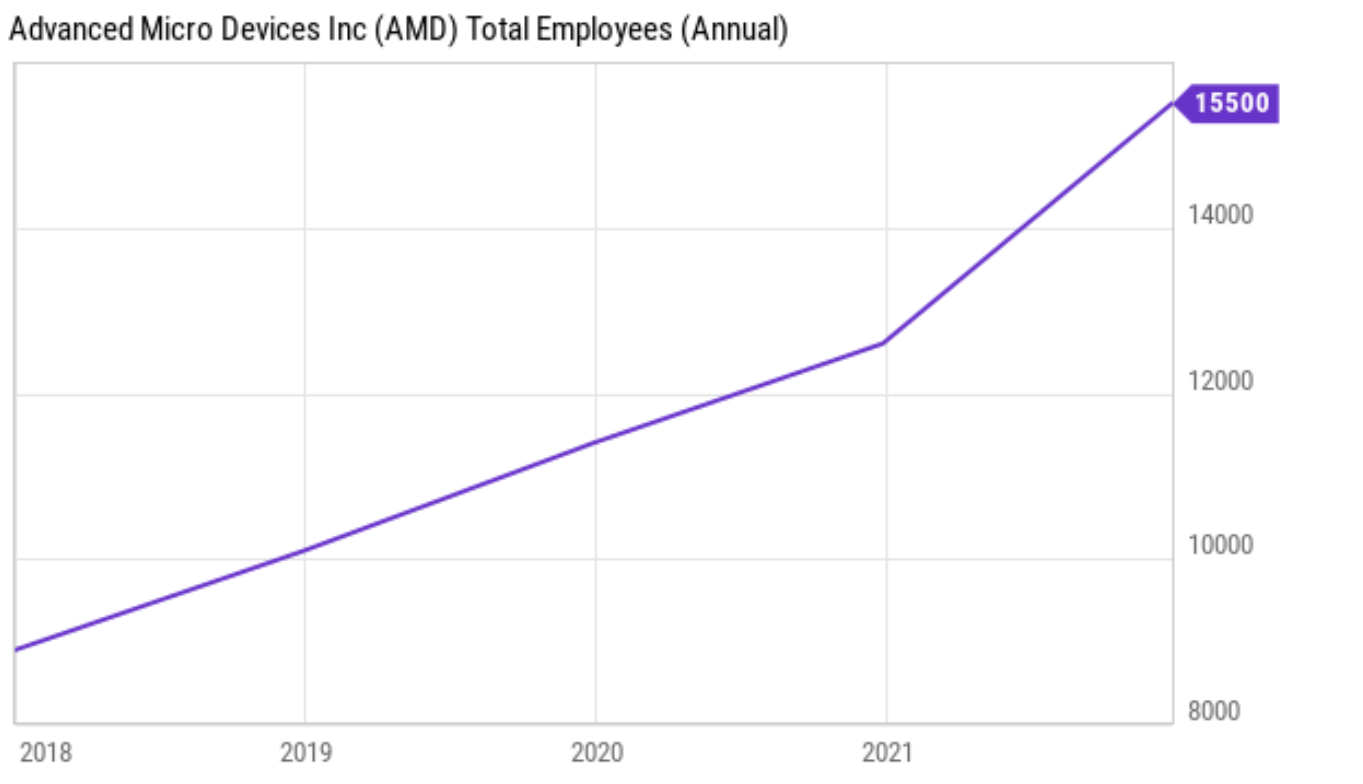
To conclude, AMD has been under tremendous selling pressure lately, both in the market and also among insiders. To me, this is a clear indicator that the mood has swung too far into the fear extreme and it’s a good time to be a contrarian, even against insiders.
It is possible that prices will keep fluctuating, possibly widely, in the near future given all the uncertainties mentioned above. However, precise market timing is both futile and unnecessary for healthy long-term returns as shown by the following chart. It shows the sensitivity of long-term annual return of investment (“ROI”) with respect to entry price. The red triangle shows the current ROI projection (about 12.1% given its 49% ROCE and assuming a reinvestment rate of 10%) at the current price. And the green box shows the return change when the entry price changes from $60 to $72 (i.e., by about 10% in each direction). As you can see, such a large entry price variation only leads to less than 1% annual ROI in the long term.
Source: Author based on Seeking Alpha data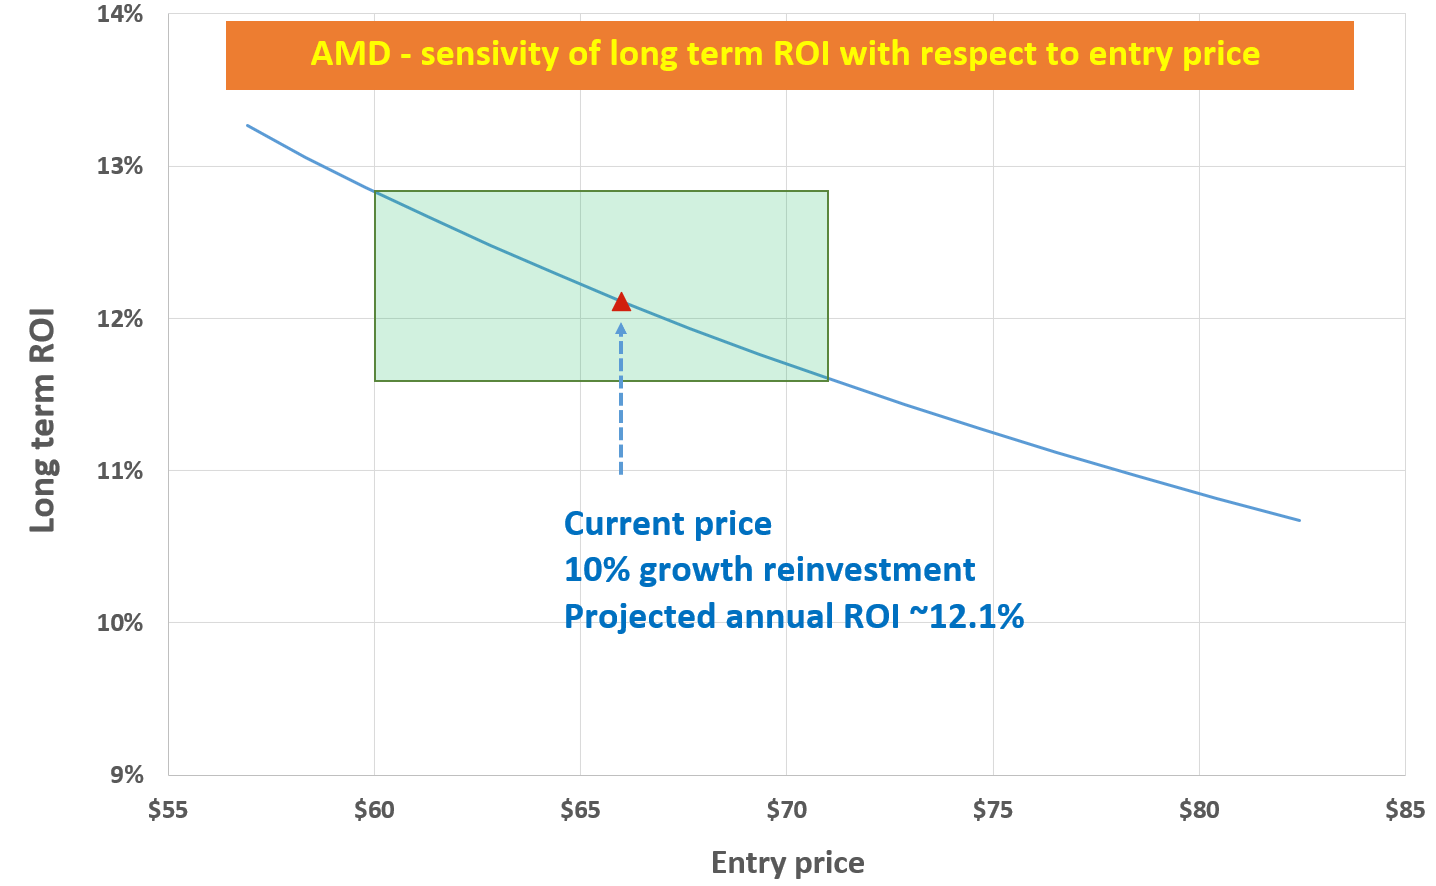
Editor’s Note: This article was submitted as part of Seeking Alpha’s best contrarian investment competition which runs through October 10. With cash prizes and a chance to chat with the CEO, this competition – open to all contributors – is not one you want to miss. Click here to find out more and submit your article today!
Be the first to comment