

georgeclerk
In this analysis of Amazon (NASDAQ:AMZN), we analyzed the company’s cloud segment, AWS, following its strong year of growth in H1 FY2022 which grew by 35% YoY and is higher than our projection of 22% growth in 2022. Thus, we analyzed the cloud market which we previously projected based on data volume and updated it as well as analyzed the shift towards public cloud and accounted for that in our projections for the cloud market. Moreover, in terms of market share, we analyzed the cloud companies’ market share and compared these companies in terms of the number of cloud services offerings to forecast their market share. Lastly, we examined AWS’s expansions globally with new data centers and forecasted its capex to project its FCF margins.
Cloud Market Still Supported By Data Volume Growth
From our previous analysis, we analyzed our projections of the cloud market and compared them with the actual growth in 2021 to identify the differences with our projections.
|
Cloud Infrastructure Market Projections |
2021 (Our Forecast) |
2021 (Actual) |
|
Data Volume Growth |
23% |
31.4% |
|
Cloud Market Revenue/Data Volume Factor |
1.72x |
1.19x |
|
Cloud Market Growth |
40% |
37.5% |
Source: Synergy Research, IDC, Khaveen Investments
Firstly, actual data volume growth was higher at 31.4% in 2021 compared to our forecast of 23% growth based on IDC’s forecasts. Based on the table below, the data volume growth slowed down compared to 2020 which surged by 56.8% according to the IDC due to the:
dramatic increase in the number of people working, learning, and entertaining themselves from home
Thus, we believe the slowdown in 2021 could be attributable to the easing of the pandemic restrictions. However, the 2021 data volume growth rate was still in line with the 10-year average data volume growth of 33.1%. Thus, we believe the 10-year average is more reliable than IDC’s data volume forecast at an average growth of 21.2% through 2026. Thus, we decided to base our projections using the 10-year historical data volume growth instead of relying on IDC’s forecasts.
|
Data Volume |
2012 |
2013 |
2014 |
2015 |
2016 |
2017 |
2018 |
2019 |
2020 |
2021 |
Average |
|
Data Volume (ZB) |
6.5 |
9 |
12.5 |
15.5 |
18 |
26 |
33 |
41 |
64.27 |
84.45 |
|
|
Growth % |
30.0% |
38.5% |
38.9% |
24.0% |
16.1% |
44.4% |
26.9% |
24.2% |
56.8% |
31.4% |
33.1% |
Source: IDC, Khaveen Investments
In 2021, the cloud infrastructure revenue/data volume growth factor of 1.19x is lower compared to our previous forecast of 1.72x. This is because the cloud infrastructure market grew by 37.5% in 2021 which is in line with the previous forecast of 40%. However, data volume growth was higher than our previous forecast of 23% growth based on IDC at 31.4% in 2021, thus resulting in the lower cloud infrastructure revenue/data volume growth factor. We believe this could be due to several reasons:
- Decreasing cloud prices
- Higher cloud efficiency
- Higher growth in on-premise
Decreasing Cloud Prices
One of the possible reasons which we believe could explain this scenario could be a decline in cloud prices. For example, in 2021, Amazon announced that reduced its cloud storage prices by up to 31% as stated in the following excerpt below.
Amazon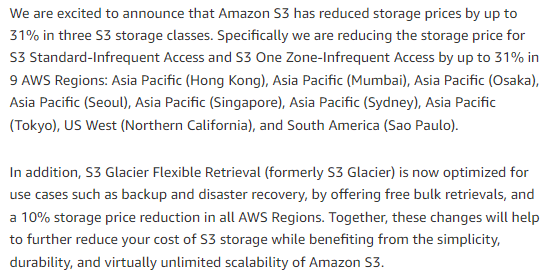
Besides that, according to Tech Target, Amazon had also:
boosted data transfer limits from AWS Regions to the internet from 1 GB to 100 GB, and increased Amazon CloudFront data transfers to 1 TB from 50 GB for AWS Free Tier users
Thus, we believe this could be one of the drivers for the reduction in the cloud infrastructure revenue/data volume growth factor in 2021. However, for the other cloud service providers, we could not find any information on changes in their cloud service pricing for Microsoft (MSFT) and Google (GOOG) (GOOGL). Thus, despite Amazon reducing its prices, the lack of information from the other cloud service providers does not enable us to ascertain declining cloud prices as the reason to explain the decline in the cloud market/data volume growth factor.
Higher cloud efficiency
Another reason could be the increasing consumption of data by cloud customers. Based on RedMonk, memory per cost generally increases with higher memory usage.
Redmonk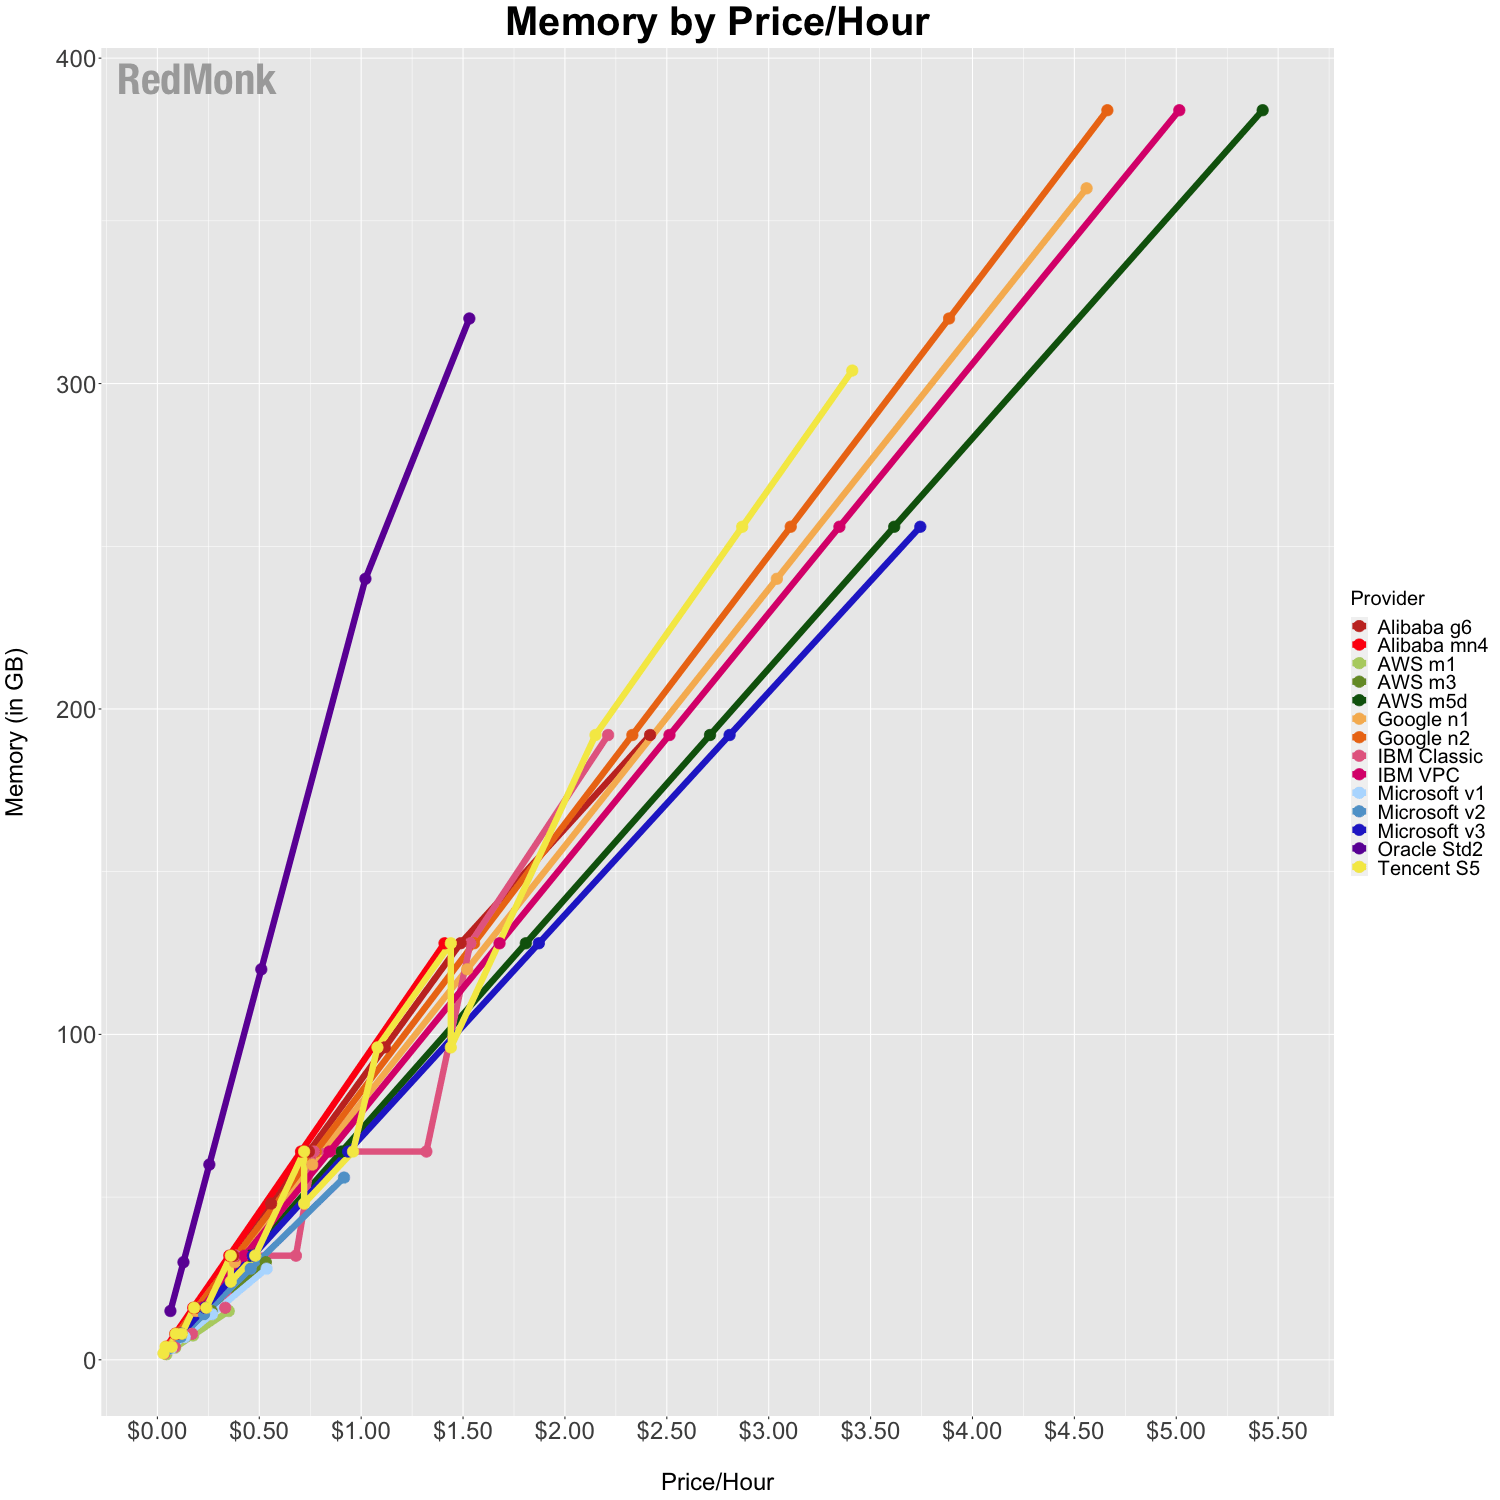
|
Cloud Consumption Cost Example |
Customer Breakdown (2020) |
Memory per Cost/hr (2020) (GB/$/hr) |
Customer Breakdown (2021) |
Memory per Cost/hr (2021) (GB/$/hr) |
|
Small Scale Consumption |
50% |
50 |
40% |
50 |
|
Large Scale Consumption |
50% |
75 |
60% |
75 |
|
Average Memory per Cost/hr |
62.5 |
65 |
Source: Khaveen Investments
In a hypothetical example above, the average memory per $1 cost is 50Gb but the average memory per $1 cost for 300Gb is 75Gb per $1 cost. The higher the data consumption, the higher the memory per unit cost. In the table above, the example illustrates the increase in memory per cost with the shift of customers towards higher consumption. Given a 100 increase in customers to large consumption, the average memory per cost increases from 62.5Gb per $1 to 65Gb per $1. Thus, we believe this could explain the reduction in the cloud infrastructure revenue/data volume growth factor in 2021. In 2021, the growth of large companies worldwide was 4.1% according to Statista compared to the growth of SMEs worldwide by only 1.6%.
Higher growth in on-premise
Lastly, another possible reason for the reduction in the cloud infrastructure revenue/data volume growth factor in 2021 could be higher growth in non-cloud on-premise solutions. Based on the company’s latest earnings briefing, management highlighted that it is optimistic about its cloud growth with the growing adoption of the cloud as explained by the following quote below.
AWS continues to grow at a fast pace, and we believe we are still in the early stages of enterprise and public sector adoption of the cloud. – Brian Olsavsky, Senior Vice President and Chief Financial Officer
We examined management’s statement of cloud adoption based on the share breakdown between cloud and traditional IT in the chart below.
IDC, Statista, Khaveen Investments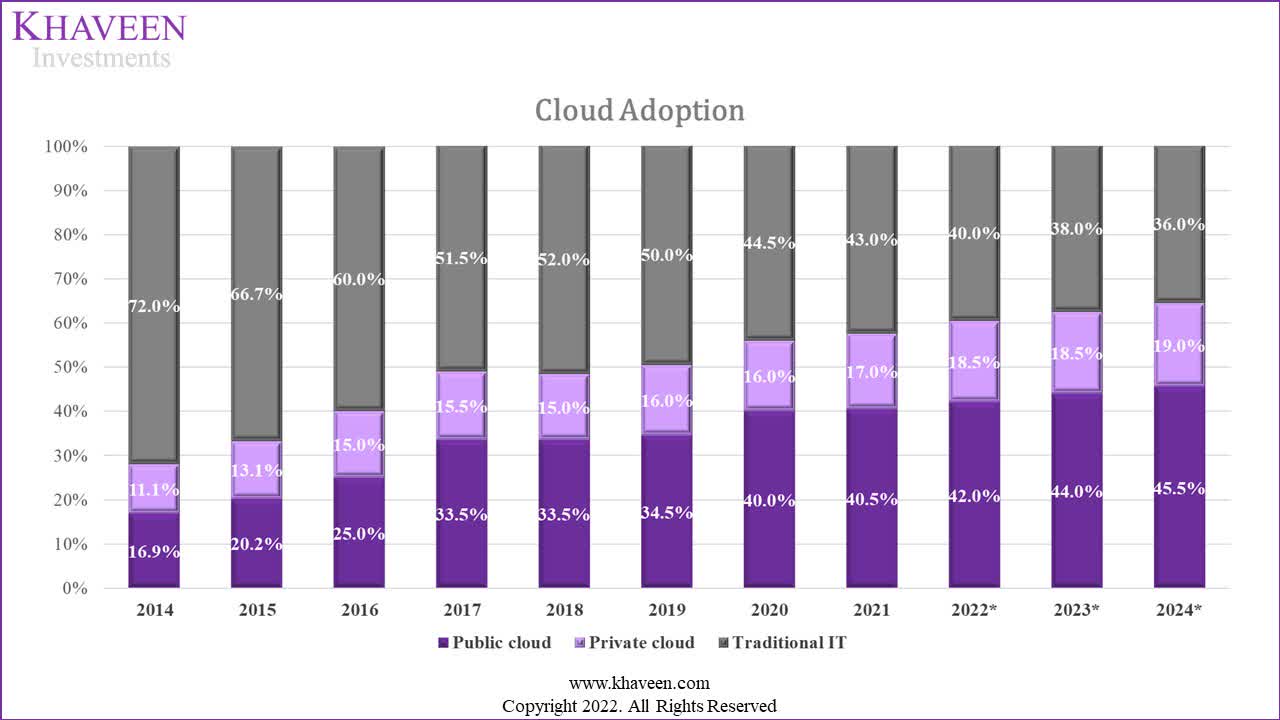
Based on data from IDC, adoption of cloud had increased in the past 7 years from just 16.91% in 2014 to an estimated 40.5% in 2021. Additionally, the share of the private cloud had increased from 16.91% to 17%. On the other hand, while cloud share increased, traditional IT share declined from 71.99% to 43% in 2021. Based on IDC’s forecast, the cloud public cloud share is expected to increase to 45.5% by 2024 while the private cloud increase to 19% against traditional IT at 36%.
Flexera Software, Khaveen Investments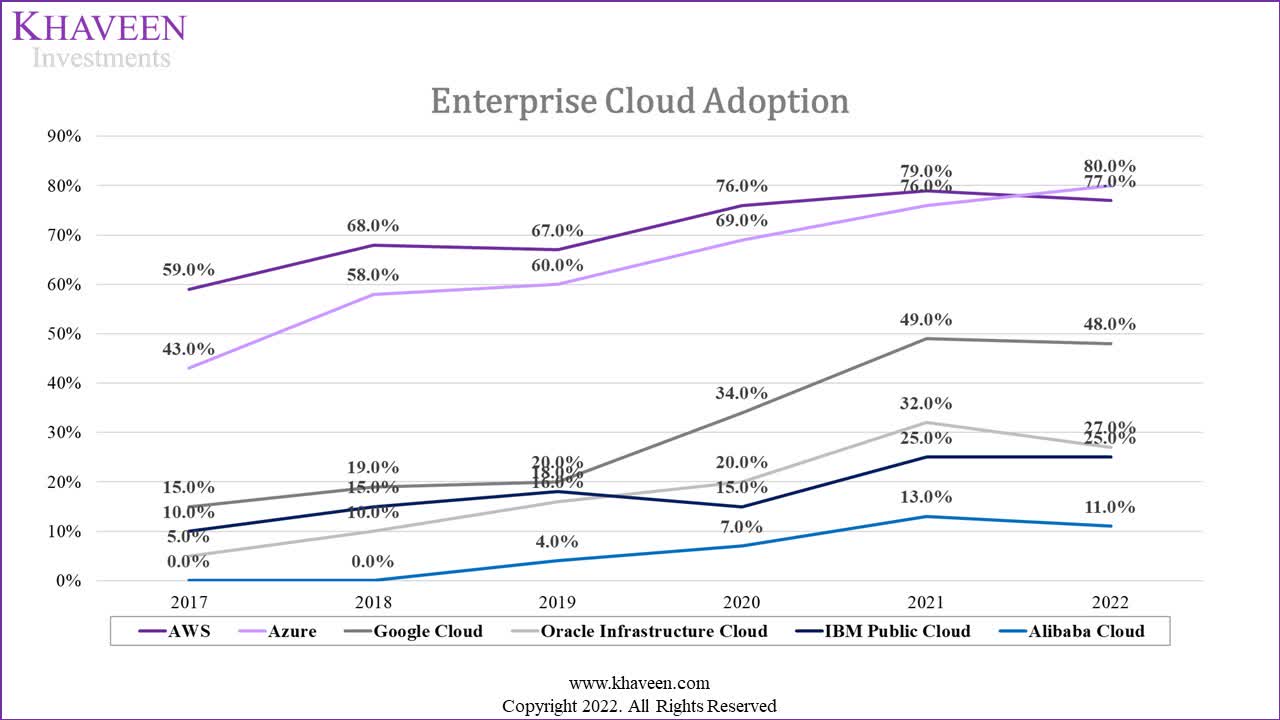
Based on the public cloud adoption by enterprises from Flexera Software, the chart shows that the adoption rate for cloud service providers including Amazon had increased from 2017 to 2022. In 2022, the chart shows Microsoft Azure’s adoption rate increasing higher than AWS at 80% compared to 77%. This is followed by Google Cloud at 48%, IBM (IBM) at 25% and Alibaba Cloud (BABA) at 11%. Therefore, we believe this does not explain the reduction in the cloud infrastructure revenue/data volume growth factor in 2021 with the increasing adoption of the cloud.
|
Cloud Infrastructure Market Projections |
2017 |
2018 |
2019 |
2020 |
2021 |
2022F |
2023F |
2024F |
2025F |
2026F |
|
Data Volume (ZB) |
26 |
33 |
41 |
64.27 |
84.45 |
101.3 |
122.8 |
149.0 |
181.9 |
221.2 |
|
Data Volume Growth % (‘a’) |
44.4% |
26.9% |
24.2% |
56.8% |
31.4% |
30.5% |
30.5% |
30.5% |
30.5% |
30.5% |
|
Cloud Infrastructure Revenue Growth/Data Volume Growth (‘b’) |
1.02 |
1.80 |
1.61 |
0.61 |
1.19 |
1.25 |
1.25 |
1.25 |
1.25 |
1.25 |
|
Cloud Infrastructure Market Revenues ($ bln) |
46.5 |
69 |
96 |
129.5 |
178 |
245.7 |
339.2 |
468.3 |
646.6 |
892.6 |
|
Cloud Infrastructure Market Revenue Growth % (‘c’) |
45.3% |
48.4% |
39.1% |
34.9% |
37.5% |
38.1% |
38.1% |
38.1% |
38.1% |
38.1% |
* c = a x b
Source: Synergy Research, IDC, Khaveen Investments
Overall, we believe the main factor explaining the decline in the cloud market/data volume growth is the increasing efficiency of cloud use and not price reductions or higher growth in on-prem. We updated our projection of the cloud market from our previous analysis with 2021 full-year data for the cloud infrastructure market at $178 bln according to Synergy Research and a total data volume of 84.45 ZB. We updated our data volume growth projections based on the 10-year average of 30.5% (excluding 2020 due to pandemic surge) instead of IDC’s latest forecast which reaches 221.2ZB by 2026 which is an average growth of 21.2% during the forecast period as we believe its 10-year average to be more reliable than IDC’s forecast. Also, we used a lower 5-year average cloud infrastructure revenue/data volume growth instead of a 10-year average (1.68x) previously as the cloud infrastructure revenue/data volume factor was trending downwards. Overall, based on the data volume forecast, we projected the cloud revenue growth through 2026 at a derived 5-year average of 38.1% which is slightly lower compared to our previous forward average of 39.8%.
Amazon’s Cloud Services Ecosystem Portfolio Advantage
Synergy Research, Canalys, Company Data, Khaveen Investments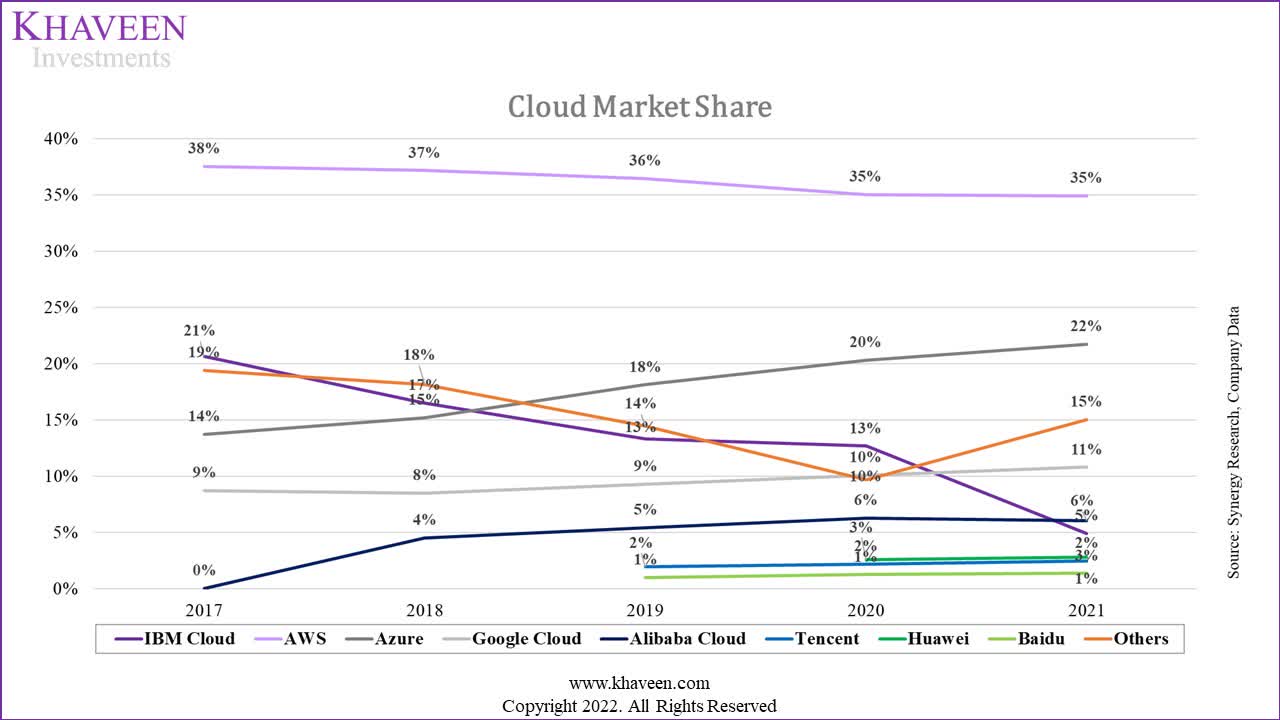
In terms of cloud market share, Amazon’s market share declined steadily from 2017 to 2020 but it maintained its market share in 2021 at 35% and held the market leadership position. This is in contrast with our previous analysis where we expected its market share to continue to decline to 30.1% by 2025 as its market share had been on a downtrend and we expected it to continue due to faster-growing competitors such as Microsoft. Whereas Microsoft Azure continued to gain market share and increased to 22% in 2021. Besides Microsoft, Google Cloud also continued to gain market share in 2021 since 2018. For the Chinese cloud companies, Alibaba Cloud led these companies and maintained its market share in 2021.
Based on the company’s latest earnings briefing, management highlighted its focus on expanding its cloud business segment by growing its capacity and introducing new services.
We continue to invest thoughtfully in new infrastructure to meet capacity needs, while expanding AWS to new regions, developing new services and iterating quickly to enhance existing services. – Brian Olsavsky, Senior Vice President and Chief Financial Officer
Previously in our analysis, we analyzed the cloud companies in terms of pricing, number of availability zones and estimated planned increases of availability zones. To analyze and determine the competitiveness of the cloud companies, we updated our table of the companies’ availability zones and pricing based on their websites. For Baidu (BIDU) and Tencent’s (OTCPK:TCEHY) planned increases, we based its growth on the China data center market forecast CAGR of 19.2% by Modor Intelligence. Furthermore, we compiled the number of services offered on each company’s cloud platform based on the company’s websites.
|
Company |
Pricing |
Number of Availability Zones |
Planned Increase |
Total Availability Zones |
Number of Cloud Services |
|
AWS |
$154.5 |
87 |
21 |
108 |
227 |
|
Microsoft Azure |
$152.6 |
66 |
60 |
126 |
288 |
|
Google Cloud |
$116.1 |
103 |
27 |
130 |
220 |
|
Alibaba Cloud |
$110.4 |
85 |
13 |
98 |
212 |
|
Tencent |
$136.8 |
70 |
13 |
83 |
136 |
|
Huawei |
$85.2 |
65 |
10 |
75 |
80 |
|
Baidu |
$37.3 |
24 |
5 |
29 |
59 |
|
IBM Cloud |
$121.6 |
27 |
5 |
32 |
170 |
|
Oracle (ORCL) |
$96.0 |
46 |
14 |
60 |
100 |
|
Average |
$112.27 |
63.67 |
19 |
82.4 |
166 |
Source: Company Data, Modor Intelligence, Khaveen Investments
Based on the table, Amazon offers 227 cloud services across various product categories from its website such as:
Analytics, Compute, Developer Tools, Machine Learning, Internet of Things, Quantum Technologies and Storage.
The company with the highest number of services is Microsoft with 288 cloud services based on its website while the company with the lowest is Baidu with 59 cloud services. In terms of pricing, AWS has the highest pricing among competitors while Baidu has the lowest at $37.3 (CNY266.17). Moreover, we estimated Microsoft to have the highest number of data center availability zones and planned increases at 126 while Baidu with the lowest at 29.
Company Data, Khaveen Investments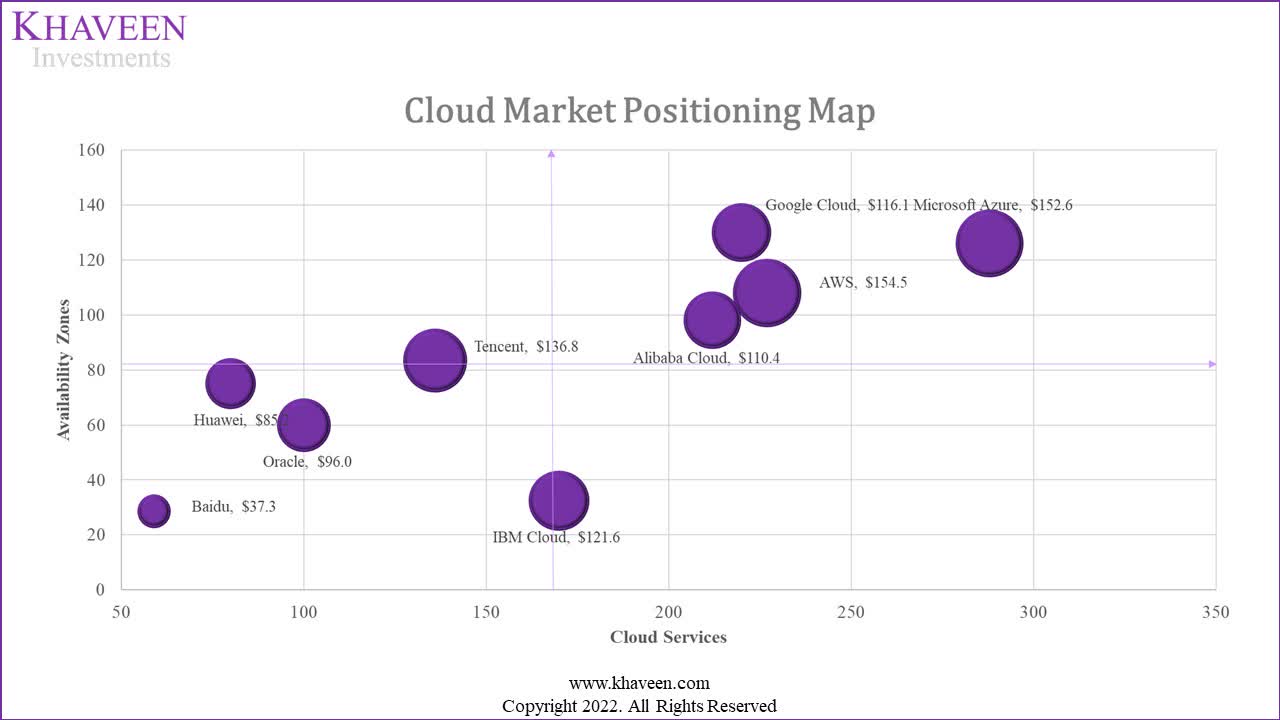
We plotted the companies in a competitive positioning map above based on the number of services and availability zones which we believe are two key factors for customers deciding between cloud platforms as well as the sizes of the bubbles representing the cost obtained from their websites. We separated the positioning map into 4 quadrants based on the average number of services (166) and availability zones (82.4).
As seen above, AWS is grouped with Alibaba Cloud, Microsoft Azure and Google Cloud in the top right quadrant as their cloud services and availability zones are above the average. Based on the market share chart above, Microsoft, Google and Alibaba in the top right quadrants have gained market share in the past 5 years. Although Amazon’s market share declined until 2020, it maintained its market share in 2021.
In the bottom left quadrant, Oracle, Baidu and Huawei are placed there as their services and availability zones are below the average whereas Tencent is placed in the top left quadrant with its total availability zones slightly above the average while IBM Cloud is placed in the bottom right quadrant with slightly above average cloud services. Also, these companies not in the top right quadrant had stagnant market share change in the past 5 years from the market share chart above.
Overall, we believe this highlights AWS’s competitive cloud segment as it is placed together with the top cloud market leaders which had gained market share including Microsoft, Google and Alibaba Cloud and we believe this could support Amazon’s market share increase. Thus, we projected the cloud market share based on the average difference between pricing, availability zones and cloud services in the table below for each company.
|
Cloud Infrastructure Pricing |
Pricing Difference |
Total Data Center Availability Zone Difference |
Number of Services Difference |
Average |
|
AWS |
62.4% |
131.1% |
136.9% |
110.2% |
|
Microsoft Azure |
64.1% |
152.9% |
173.7% |
130.2% |
|
Google Cloud |
96.6% |
157.8% |
132.7% |
129.0% |
|
Alibaba Cloud |
101.7% |
119.0% |
127.9% |
116.2% |
|
Tencent |
78.2% |
101.3% |
82.0% |
87.2% |
|
Huawei |
124.1% |
91.0% |
48.3% |
87.8% |
|
Baidu |
166.7% |
34.7% |
35.6% |
79.0% |
|
IBM Cloud |
91.7% |
39.3% |
102.5% |
77.8% |
|
Oracle |
114.5% |
72.8% |
60.3% |
82.6% |
|
Average |
100.0% |
100.0% |
100.0% |
100.0% |
Source: Company Data, Khaveen Investments
Based on the cloud company’s pricing, total availability zones and total services, we calculated the average difference in % for each metric and calculated the average differences for each company across the 3 metrics. We used this average difference to multiply it with our cloud market projections from the previous point above.
Synergy Research, Canalys, Company Data, Khaveen Investments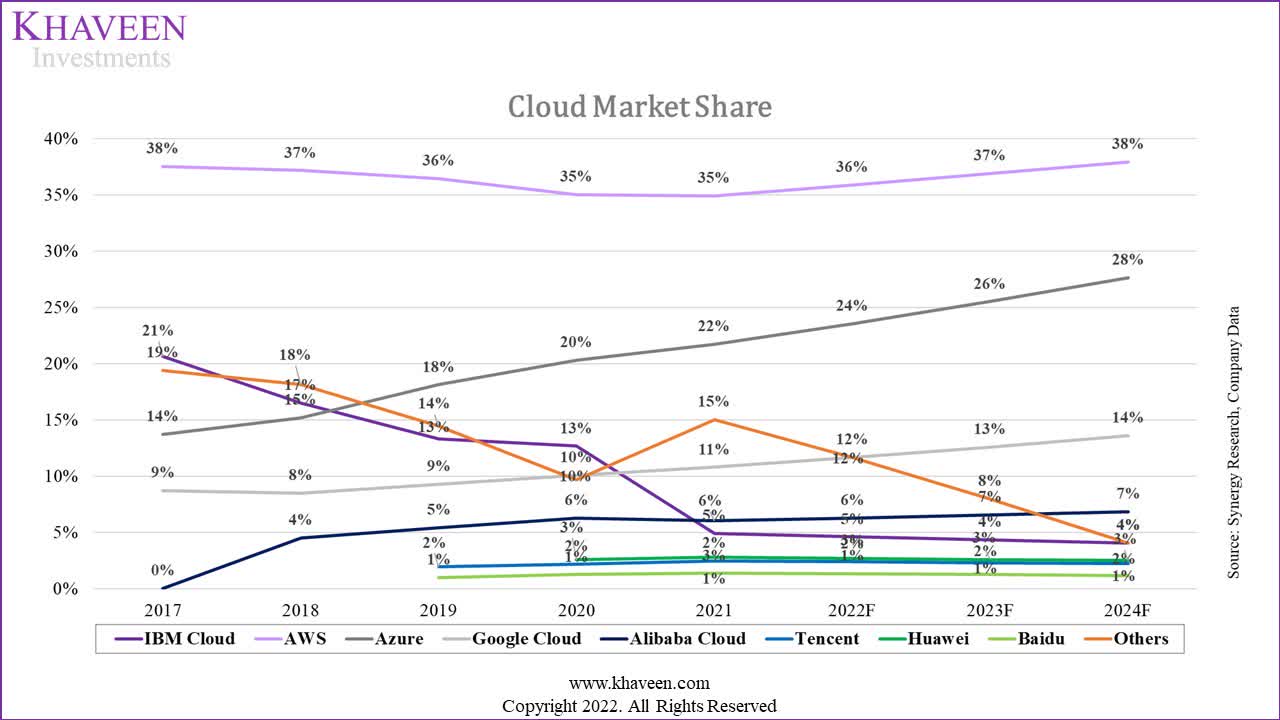
|
Cloud Revenue Projection ($ mln) |
2021 |
2022F |
2023F |
2024F |
|
AWS Revenue |
62.2 |
88.3 |
125.3 |
177.8 |
|
Growth % |
37.10% |
41.92% |
41.92% |
41.92% |
Source: Amazon, Khaveen Investments
For AWS, we obtained the average % difference for its pricing, availability zones and total services at 110.2%. Based on our cloud market projections in the previous point, we forecasted its revenue growth to grow at an average of 38.1% through 2026. This results in a revenue projection of an average of 41.92% for AWS through 2024.
Capex Impact on FCF Margins
Moreover, in terms of its cloud business segment expansion, the company highlighted on its website that it plans to expand its footprint globally as stated below.
The AWS Cloud spans 87 Availability Zones within 27 geographic regions around the world, with announced plans for 21 more Availability Zones and 7 more AWS Regions in Australia, Canada, India, Israel, New Zealand, Spain, and Switzerland. – Amazon
Furthermore, we compiled the planned expansions of AWS in the table below with the costs at a total of $38 bln and the expected year of completion.
|
Expansion |
Cost ($ bln) |
Expected Year of Completion |
|
Oregon |
11.8 |
2027 |
|
Dublin |
2 |
2030 |
|
London |
2.3 |
2024 |
|
Auckland |
4.7 |
2024 |
|
Calgary |
3.3 |
2037 |
|
Montreal |
12.7 |
2037 |
|
Tel Aviv |
1.2 |
2023 |
|
Total |
38.0 |
Source: Amazon, Khaveen Investments
From its latest earnings briefing, the company highlighted that 40% of its capex in 2021 incurred was spent mainly on AWS.
In 2021, we incurred approximately $60 billion in capital investments. About 40% of that is comprised of technology infrastructure, primarily supporting AWS as well as our worldwide stores business. – Brian Olsavsky, Senior Vice President and Chief Financial Officer
We projected the company’s capex for its AWS segment based on the 40% share of the company’s 2021 capex breakdown from the earnings briefing. Based on its AWS segment revenue in 2021, we calculated its capex as a % of revenue at 39.3%. We used this figure to project its capex for AWS based on our revenue forecast as derived in the previous point above. Whereas for its other businesses besides AWS, we calculated the remainder of its capex as its non-AWS capex and obtained a capex as a % of non-AWS revenue of 9% which we used to forecast its non-AWS capex in 2022. Beyond 2022, we projected its AWS and non-AWS capex based on our 2022 capex figures through 2024. Overall, we expect its capex as a % of revenue to normalize beyond 2022 and reach 9.7% in 2024 and forecasted it in 2025 and beyond based on its 5-year average of 8.4%.
|
Amazon Capex Projections |
2019 |
2020 |
2021 |
2022F |
2023F |
2024F |
|
Amazon Capex |
16,861 |
40,140 |
61,053 |
73,794 |
73,794 |
73,794 |
|
Revenue |
280,522 |
386,064 |
469,822 |
523,761 |
635,229 |
763,895 |
|
Capex as a % of Revenue |
6.0% |
10.4% |
13.0% |
14.1% |
11.6% |
9.7% |
|
AWS Capex |
13,753 |
17,813 |
24,421 |
34,658 |
34,658 |
34,658 |
|
AWS Capex as a % of Total Revenue |
4.90% |
4.61% |
5.20% |
6.6% |
5.5% |
4.5% |
|
AWS Revenue |
35,030 |
45,370 |
62,202 |
88,275 |
125,276 |
177,787 |
|
AWS Capex as a % of AWS Revenue |
39.3% |
39.3% |
39.3% |
39.3% |
27.7% |
19.5% |
|
Non-AWS Capex |
36,632 |
39,136 |
39,136 |
39,136 |
||
|
Non-AWS Capex as a % of Non-AWS Total Revenue |
9.0% |
9.0% |
7.7% |
6.7% |
Source: Amazon, Khaveen Investments
Amazon, Khaveen Investments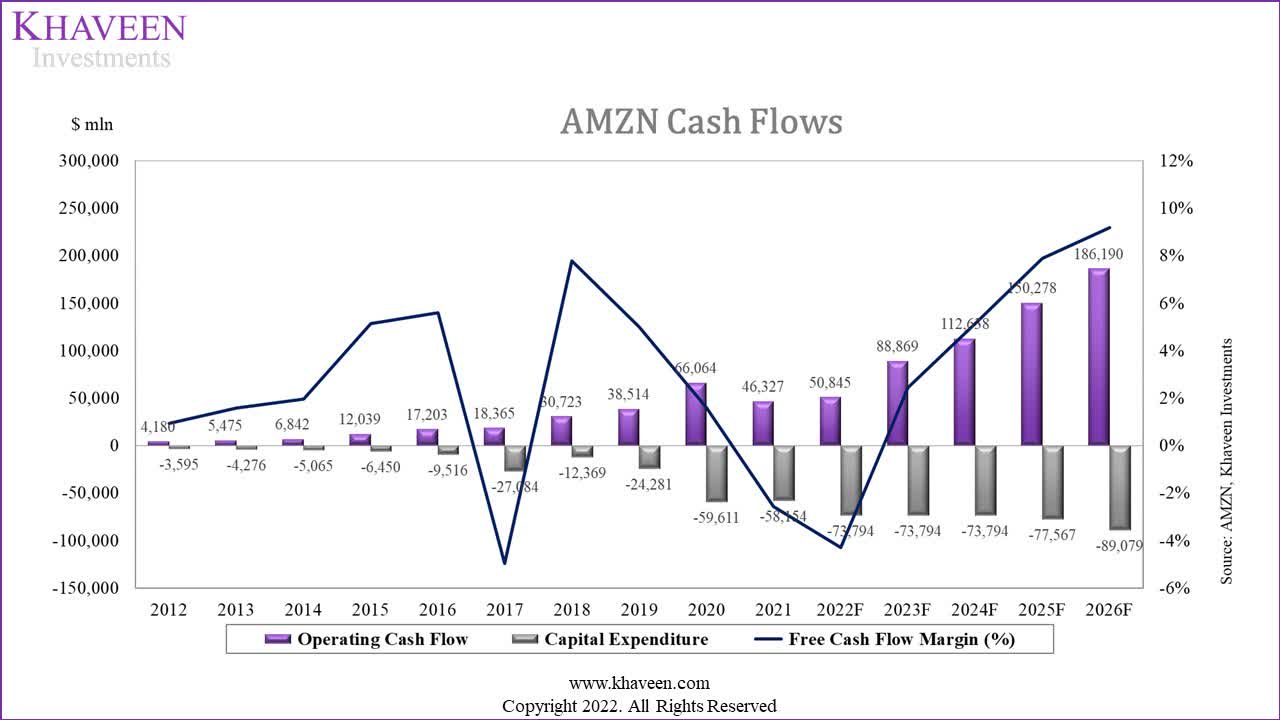
With our estimates of the company’s capex including for AWS and non-AWS, we projected the company’s FCFs through 2026. However, based on our model, our forecasts show the company’s FCF margins increasing with a forward 5-year average FCF margin of 4.07% compared to its past 5-year average of 1.37% as it was weighed down by negative margins of -2.6% in 2021.
Despite the high Capex for AWS, we are confident of margin expansion given the AWS segment commands higher profitability, and will pull up overall margins as the segment size continues to grow relative to the other segments.
Risk: Cloud Competition
We believe Amazon’s AWS segment faces strong competition despite its market leadership. Microsoft had been gaining market share and trailed behind Amazon followed by Google Cloud. According to WSJ, Microsoft was seeking:
to press the U.S. government into spreading its spending on such services more widely
…and reached out to competitors including Google and Oracle to work together to compete against Amazon. Thus, we believe the strong competition could pose a threat to Amazon’s growth outlook.
Valuation
We updated our revenue projections from our previous analysis of Amazon with our latest forecast for its AWS segment revenue growth. Compared to our previous analysis, we forecasted its average forward growth to be higher at 41.92% compared to 21.93% previously. Overall, we forecasted the company’s total 5-year forward revenue growth at 17.8%.
|
Revenue Projections ($ bln) |
2020 |
2021 |
2022F |
2023F |
2024F |
2025F |
|
Online stores |
197.4 |
222.1 |
203.97 |
225.75 |
246.88 |
270.60 |
|
Growth % |
39.72% |
12.53% |
-8.15% |
10.68% |
9.36% |
9.61% |
|
Physical stores |
16.23 |
17.08 |
18.20 |
19.02 |
19.88 |
20.77 |
|
Growth % |
-5.58% |
5.21% |
6.60% |
4.50% |
4.50% |
4.50% |
|
Retail third-party seller services |
80.5 |
103.4 |
129.2 |
157.0 |
188.5 |
226.8 |
|
Growth % |
49.67% |
28.47% |
25.03% |
21.49% |
20.05% |
20.32% |
|
Subscription services |
25.21 |
31.77 |
39.49 |
48.47 |
58.77 |
70.44 |
|
Growth % |
31.23% |
26.01% |
24.32% |
22.73% |
21.25% |
19.86% |
|
AWS |
45.37 |
62.202 |
88.3 |
125.3 |
177.8 |
252.3 |
|
Growth % |
29.52% |
37.10% |
41.92% |
41.92% |
41.92% |
41.92% |
|
Advertising services |
19.773 |
31.16 |
41.93 |
52.70 |
63.46 |
74.23 |
|
Growth % |
56.62% |
57.59% |
34.56% |
25.68% |
20.43% |
16.97% |
|
Other |
1.68 |
2.18 |
2.7 |
3.3 |
4.0 |
4.9 |
|
Growth % |
15.07% |
29.52% |
22.30% |
22.30% |
22.30% |
22.30% |
|
Telehealth (One Medical) |
3.75 |
4.65 |
5.84 |
|||
|
Total |
386.07 |
469.82 |
523.76 |
635.23 |
763.90 |
925.85 |
|
Total Growth % |
37.63% |
21.69% |
11.48% |
21.28% |
20.26% |
21.20% |
Source: Amazon, Khaveen Investments
We updated our valuation of the company with a DCF analysis and its terminal value based on the e-commerce industry average EV/EBITDA of 17.7x. Based on a discount rate of 9.6% (company’s WACC), our model shows its shares are undervalued by 102%.
Khaveen Investments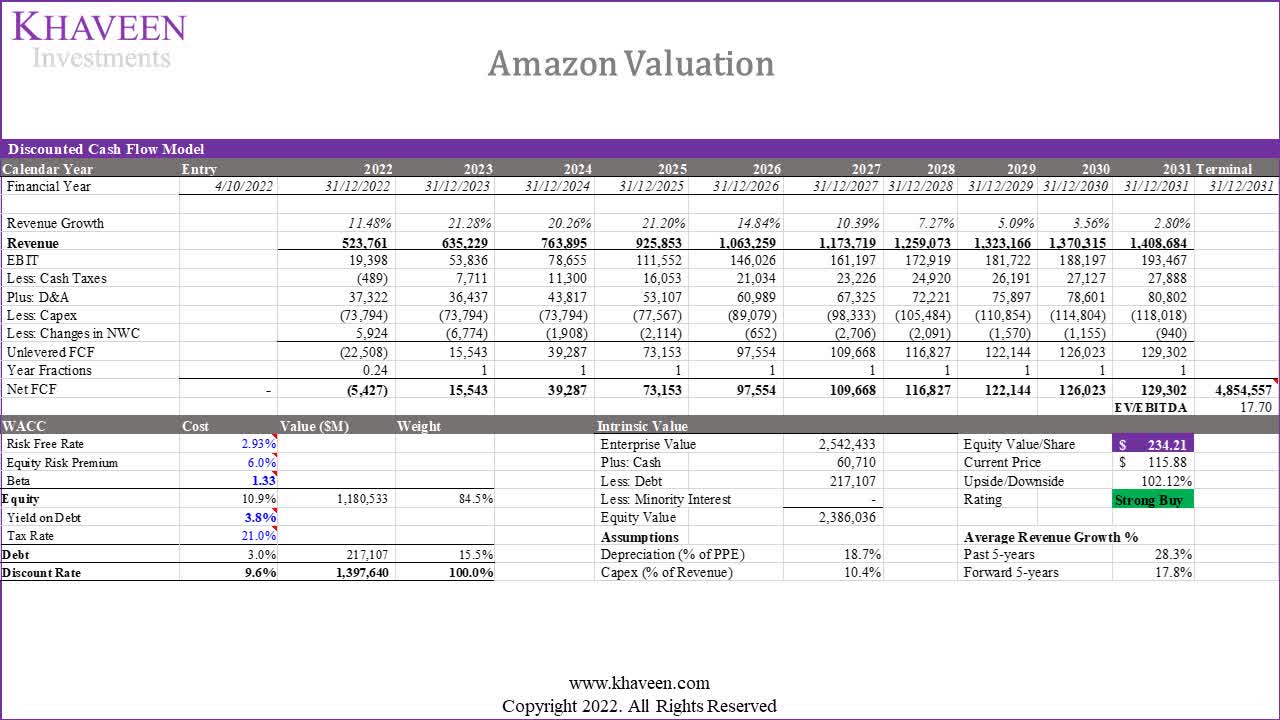
Verdict
To conclude, we expect data volume to remain a key driver of the cloud market and updated our projections based on the 10-year average (excluding 2020) data volume growth for an average market growth rate forecast of 38.1% through 2026. In terms of competitiveness, we believe AWS has an advantage with its robust cloud service portfolio and a wide network of availability zones globally. Based on our positioning map, we placed AWS in the top right quadrant with other competitors such as Microsoft, Google and Alibaba which had gained market share in the past 5 years.
We updated our projections for AWS based on our market share projections which factor in its pricing, availability zones and cloud services against competitors at an average of 42% through 2024. However, we expect its expansion for AWS to weigh on its FCF margins in 2022 but we forecasted its FCF margins to increase through 2026 at an average of 4.07%. Overall, we valued the company with a DCF valuation and obtained a price target of $234.21 with a higher upside of 102% than previously with higher revenue growth at a 5-year forward average of 17.8% and as its stock had declined by 32% YTD. Thus, we rate the company as a Strong Buy.
Be the first to comment