

hapabapa
Thesis
First, I am fully aware that Amazon (NASDAQ:AMZN) and Walmart (NYSE:WMT) are not identical (and the next section details what’s comparable and what’s not). Yet a key to investment analysis lies in comparison and contrasting similar, but not identical, businesses. We actually learn more and gain deeper insights when comparing companies that are similar in some ways but different in others. In a nutshell, the art lies in maintaining a certain range in our samples as eloquently argued in David Epstein’s bestseller entitled “Range: Why Generalists Triumph in a Specialized World”. Highly recommended.
Now back to AMZN and WMT. From time to time, I hear an argument confusing margin with profitability or investment return. It is true that margin is one important aspect of profitability, and wide-moat businesses (say Apple (AAPL)) have high margins. However, the margin is only one aspect and there are other equally important aspects. This differentiation is important to the analysis of all businesses but is especially relevant in the retail sector given the razor-thin margin. In a nutshell, if you buy an orange today for $1 and sell it tomorrow for $1.01, your margin is a meager 1% but your annual return on invested capital (i.e., true profitability and also investment return) would be a spectacular 365%.
For this reason, even though AMZN currently boasts about a 2x margin than WMT (4.48% vs. 2.26%), its profitability or investment return may not necessarily be better, as we will detail immediately next.
What is comparable and what is not?
First, as promised, let me clarify what is comparable and what is not so you see the limitation of the subsequent analysis upfront. AMZN derives most of its revenue from Online Stores (more than 47%) – which makes it very comparable to WMT. Behind online stores are a vast network of warehouses, suppliers, distribution centers, et al, just like WMT. Its second-largest revenue source is third-party seller services (22%), which is a segment that Walmart does not directly share. However, this segment relies on the backstage network too. And finally, AMZN also has a small footprint of grocery stores (Whole Foods), which directly overlaps with WMT.
Although AMZN does have revenue sources that have little or no overlap with WMT’s business model as shown in the chart below, such as its Internet Hosting Services (“AWS”) and its advertising services. And AWS is the most notable point here. It is currently only contributing a relatively minor portion (12%) to AMZN’s revenues. However, its growth potential is enormous as has been detailed in many other articles. So one limitation of the comparison in this article is that it excludes the future growth of AWS.
Merrill Edge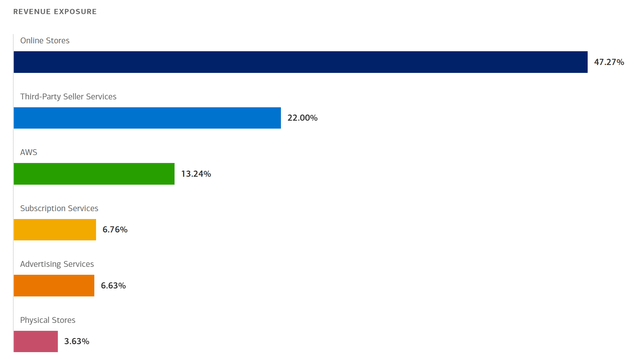
On Walmart’s side, the majority of its sales come from the stores (more than 60% in the US and 14% internationally excluding eCommerce). As mentioned above, behind its stores is a sophisticated logistics network, just like AMZN.
These days, no company stays within its own corner, and WMT is actively engaging in eCommerce, AMZN’s home game. WMT started its eCommerce after AMZN has already achieved some degree of dominance, and WMT is still playing catch up. However, it has made impressive progress in recent years in my view. Just to cite examples here: according to this report, as of January 2020, Walmart’s next-day delivery was available to 75% of the US population; and Walmart.com is the seventh-most popular e-commerce site in the world. Over 100 million unique visitors visit Walmart.com monthly and the website carries more than 60 million different items online.
So in a way (again excluding AWS), AMZN is trying to be more like Walmart by building its physical grocery stores and expanding its logistics networks. And at the same time, Walmart is trying to be more like Amazon by expanding its shipping capability and its website.
Merrill Edge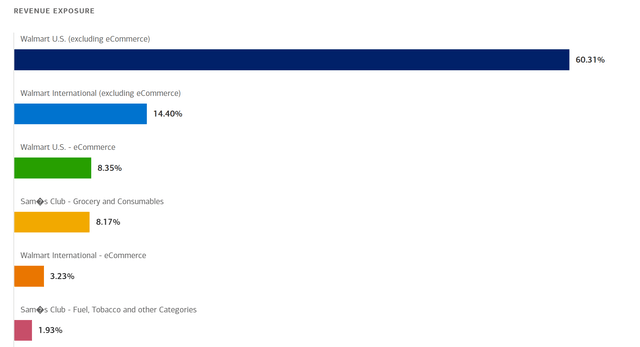
Margin comparison
With the above overview of their current business status, now let’s compare their margins. The next chart shows their net profit margin in the past decade. And as you can see, first and foremost, neither of them enjoys a “high” margin. Both of their margins are considerably below the overall economy’s average of about 8 to 10%.
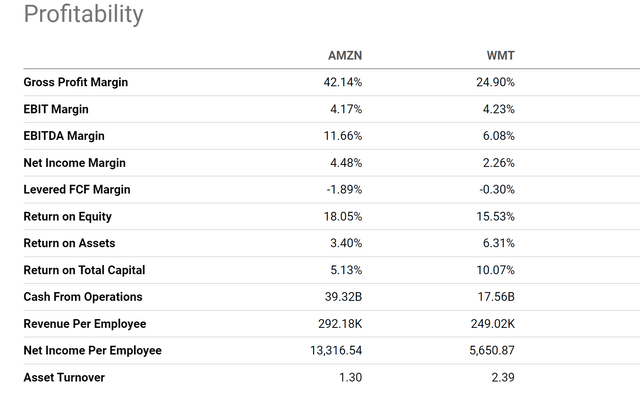
The profit margin for WMT has been quite stable and only fluctuated in a narrow range in the past decade, between about 1.0% and 3.6% with an average of 2.73%. Therefore, its current margin of 2.26%, even though slightly below the historical average, is squarely within the normal range. The profit margin for AMZN has shown a consistent improvement. It went from a not profitable level in the early part of the decade and then surpassed WMT around 2018. It kept its climb to the current level of 4.48%, about 2x of WMT’s current margin and also WMT’s long-term average. At the same, AMZN currently also reports a higher margin by other metrics than WMT, as you can see from the second chart below. Just to cite a few specific numbers: its gross margin is 42%, almost 2x higher than WMT’s 24%; its EBITDA margin is about 12%, again also almost 2x of WMT’s 6.1%.
So does this make AMZN 2x more profitable than WMT? The answer is a definitive No, as to be detailed in the next two sections.
Seeking Alpha Seeking Alpha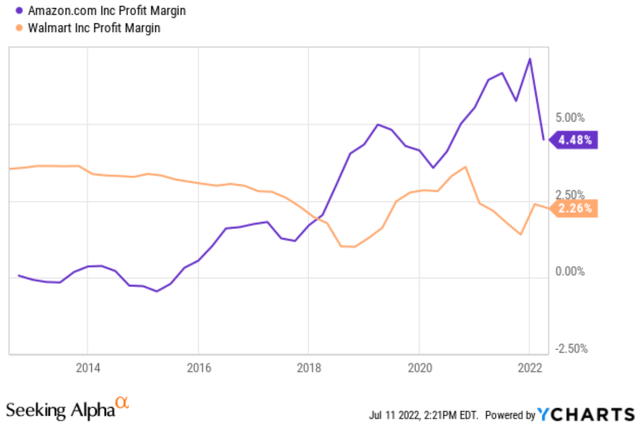
Return on capital invested
The next chart compares their return on invested capital (“ROIC”), a more comprehensive measure of profitability than margin as detailed in the next section or in my free blog article here. As seen, their current ROIC is about the same here. They are not different by 2x. WMT’s ROIC currently stands at 10%, and AMZN at 12.7%, a difference of about 2.7% or 27% in relative terms, not 2x. Also again, note the consistency of WMT’s ROIC over the long term. It has only fluctuated in a narrow range. And the current 2.7% difference in my view is largely caused by such random fluctuations. And I am going to make a bold prediction here that in the next few years, both of them will have similar ROICs averaging 10% to 12% due to the fundamental similarity in the retail businesses, which currently dominate their sales.
So the next natural question is why? Why does AMZN enjoy a 2x margin than WMT, but their ROIC is so similar? We will answer this in the section.
Seeking Alpha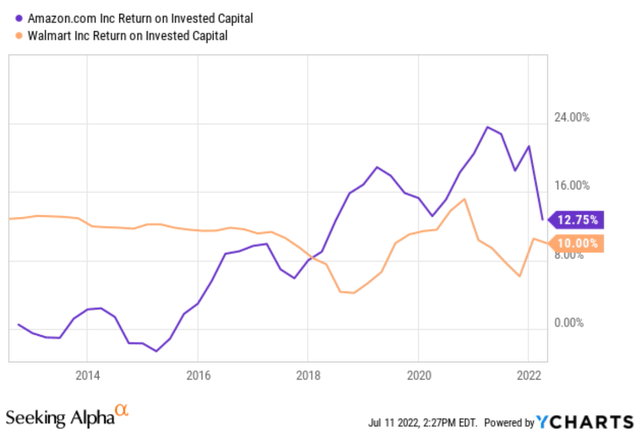
Asset utilization
Intuitively, the answer lies in the orange example I gave at the beginning. If you buy an orange today for $1 and sell it tomorrow for $1.01, your margin is a meager 1% but your ROIC would be an astronomical 365%. More formally, it is explained by the so-called DuPont framework as detailed in my earlier writings:
The DuPont analysis shows that there are three knobs that management can turn to drive up profitability: profit margin (“PM”), asset turnover ratio (“ATR”), and leverage. Through simple math, we can show that the ultimate profit is just the product of these three factors.
So besides profit margin, the next important variable is asset turnover, a key metric for retail businesses like WMT and AMZN. In the next chart, you can see that WMT’s asset turnover rate, or asset utilization rate, is almost 2x higher than AMZN, which perfectly makes up for its lower margin and leads to a very comparable ROIC.
To be more specific, the ATR for WMT has been again quite stable and fluctuated in a very narrow range between about 2.25x and 2.48x with an average of 2.36% in the past 10 years. Therefore, its current ATR of 2.38% is essentially at its long-term average. In contrast, AMZN’s ATR has been consistently declining. It started the decade with an ATR above 2.4 and declined to the current level of 1.26x, about ½ of WMT’s ATR. As a result, the decline in ATR cancels off its improved margin almost exactly, resulting in almost identical profitability compared to WMT ultimately.
Seeking Alpha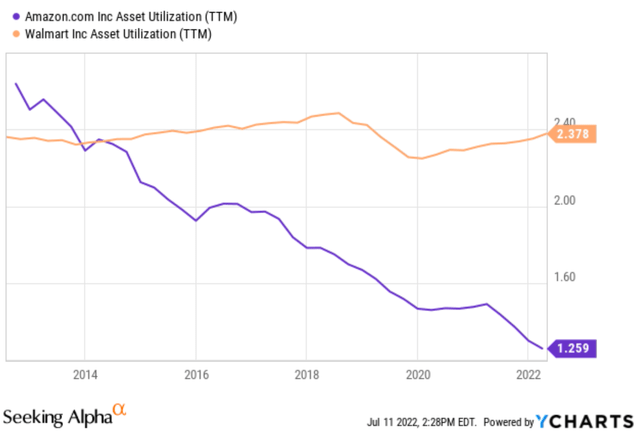
Valuation
Valuation for WMT is relatively straightforward given its stable earnings. However, for AMZN, it currently has positive earnings in the GAAP sense but negative cash flow problems as detailed in my earlier writings. Given the negative cash flow, valuation metrics in terms of bottom lines are not really meaningful for AMZN.
As you can see from the following table, AMZN’s FY1 P/E is quoted at about 114x on a GAAP basis and about 43x for FY2. In contrast, WMT’s FY1 P/E is about 19.5x and FY2 P/E is about 17.9. AMZN’s price to cash flow is quoted at about 29.9x, compared to WMT’s 19.6x. Again, the numbers for AMZN are not that meaningful considering that its cash flow is negative when its lease obligations are considered.
I will resort to a topline-oriented metric here. In terms of the P/S ratio, AMZN is currently valued at 2.45x, almost 4x of WMT’s 0.6x. To me, this is a dramatic overvaluation given the above consideration of margin and ROIC. Even if we ignore the difference in asset utilization and pretend that Amazon is twice as profitable as Walmart (because its profit margin is twice higher), then its sales should be worth twice Walmart’s, not four times.
Seeking Alpha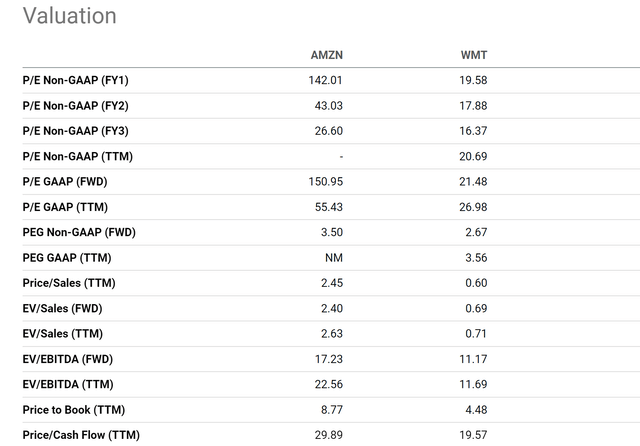
Final thoughts and risks
When comparing different stocks, it is important to remember that margin does not equate to profitability. It is one important aspect of the ultimate profitability, but there are other important factors such as asset utilization. Such differentiation is especially crucial for the analysis of retail-centric businesses such as AMZN and WMT. Their margins tend to be thinner than the overall economy. AMZN’s net margin is currently about 4.4% and WMT 2.25, compared to the average economy’s 8% to 10% average. But this does not make them bad businesses. Similarly, the fact that AMZN’s margin is 2x higher than WMT’s does not make it 2x more profitable than WMT either (or justify its current valuation premium over WMT).
Finally, risks. In the short term, both AMZN and WMT are having their share of difficulties against high inflation and high fuel prices, especially AMZN. WMT has its own gasoline distribution business to cancel some of the fuel price hikes.
In the longer term, for AMZN, AWS is an upside risk as aforementioned. But it’s currently only a minor contributor to the overall sales. The competition is heating up and its eventual success will require years of continued heavy investment and will stretch its capital allocation, especially considering its negative cash flow. For WMT, it will need to keep playing catch up in the eCommerce space. I see the economy’s secular shift to online eCommerce as unstoppable.
Be the first to comment