

Deagreez/iStock via Getty Images
Whether you’re hoping to retire in 30 years or already retired, nothing helps reach your long-term financial goals like world-class dividend blue-chips.
Altria (NYSE:MO) and British American (NYSE:BTI), while certainly not right for everyone (no company is), are two of the greatest wealth compounders in history. In fact, Altria is the single best-performing stock of all time.
- 17.7% CAGR total returns for 90 years,
- 173,000X returns, adjusted for inflation
Why do income investors, both young and old alike, love Altria and British American? There are many reasons, but here are the three biggest reasons that tens of millions of investors own these dividend aristocrats:
- recession-resistant, boring, but highly steady businesses
- two of the world’s highest quality, safest, and most dependable dividend growth stocks
- exceptional return potential, especially if you buy them during bear markets
Both of these high-yield aristocrats are proven rich retirement dreams stocks.
Altria And British American Total Returns Since April 1985
Portfolio Visualizer Premium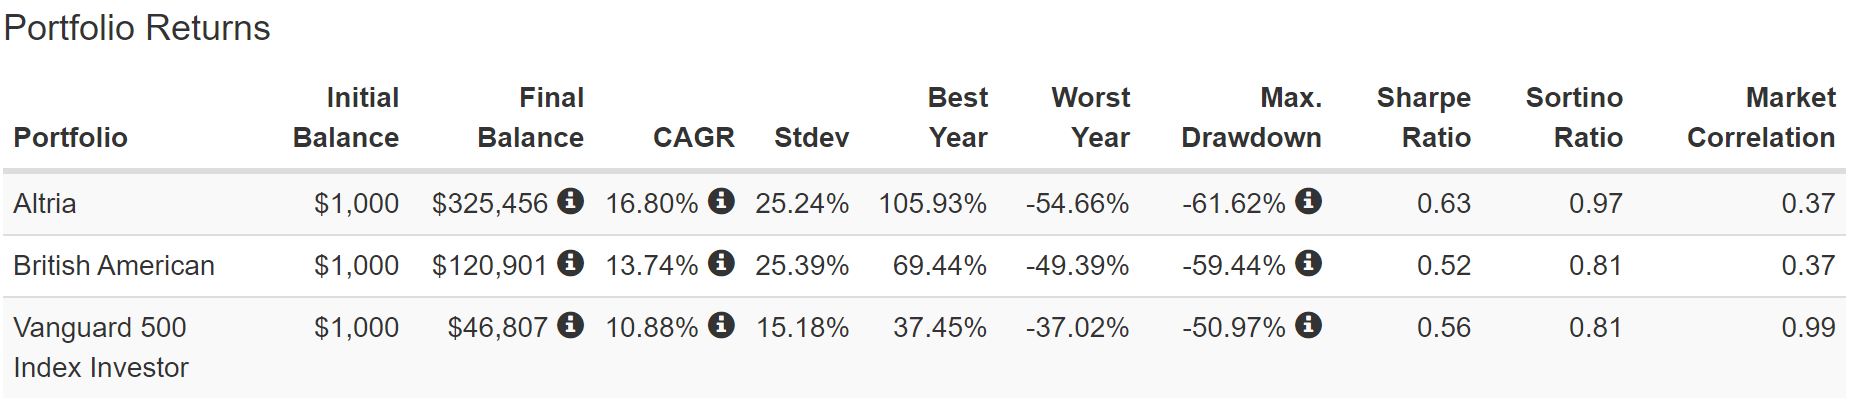
BTI and MO have both managed to deliver sensational returns thanks to steady growth for 37 years and lots of bear markets in which reinvesting dividends doubled the compounding power of steady dividend growth.
Portfolio Visualizer Premium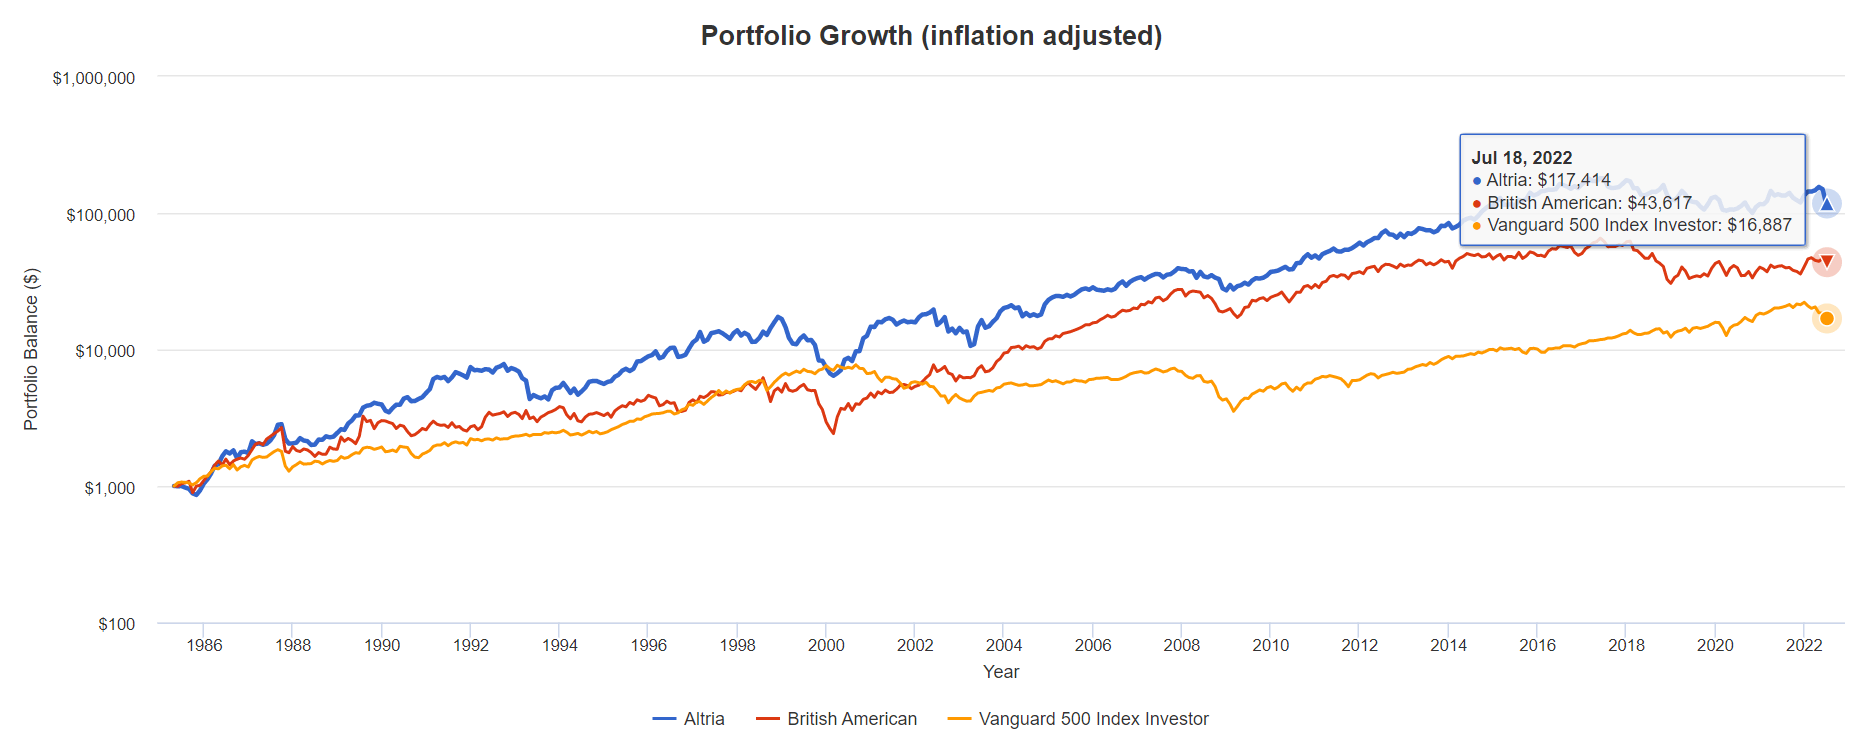
Adjusted for inflation:
- MO 117X (7X the S&P 500)
- BTI 44X (2.6X the S&P 500)
- S&P 500 17X
Portfolio Visualizer Premium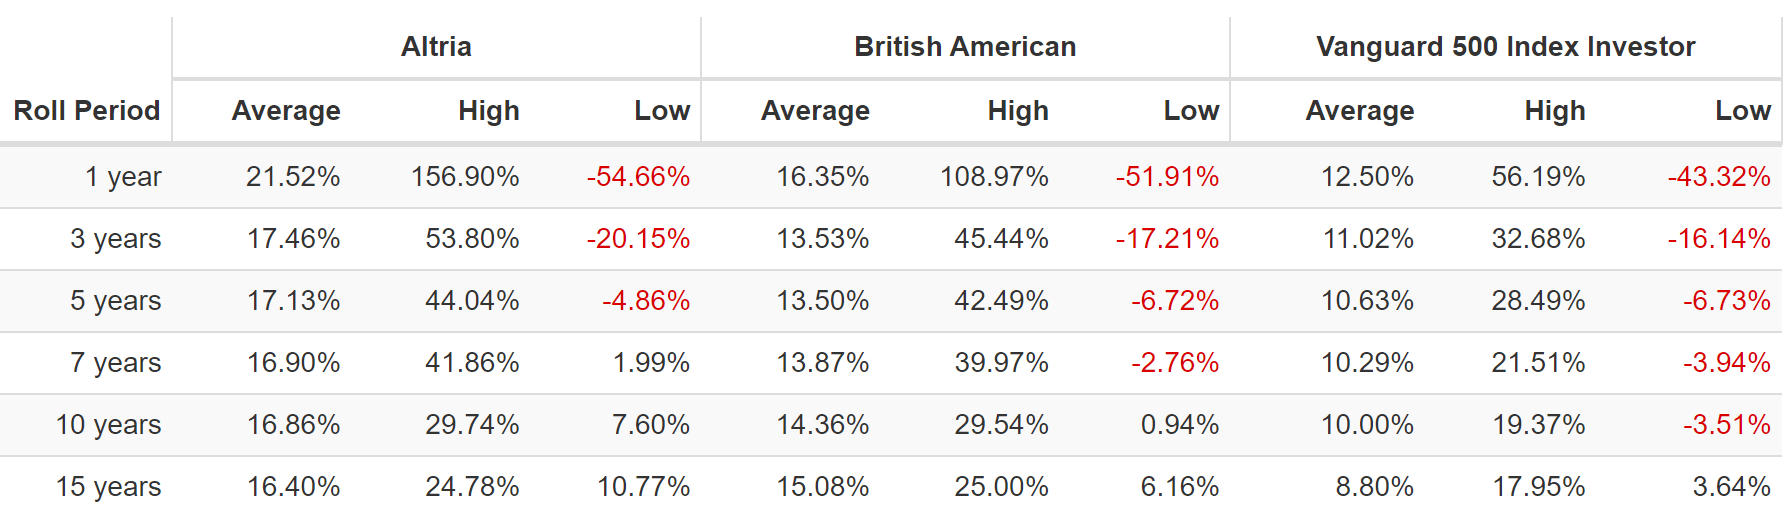
Their average 15-year rolling returns are 16% and 15%, respectively. Analysts expect similar returns in the future from today’s bargain prices.
Recently, several Dividend Kings members asked me to compare and contrast MO and BTI to help them better decide which of these legendary high-yield aristocrats is the better buy.
So let’s examine both, in terms of defensiveness, quality and safety, and valuation/return potential, to help you determine which of these companies is the potentially better buy for your portfolio today.
Altria & British American: Legendary High-Yield Defensive Aristocrats You Can Trust
Ycharts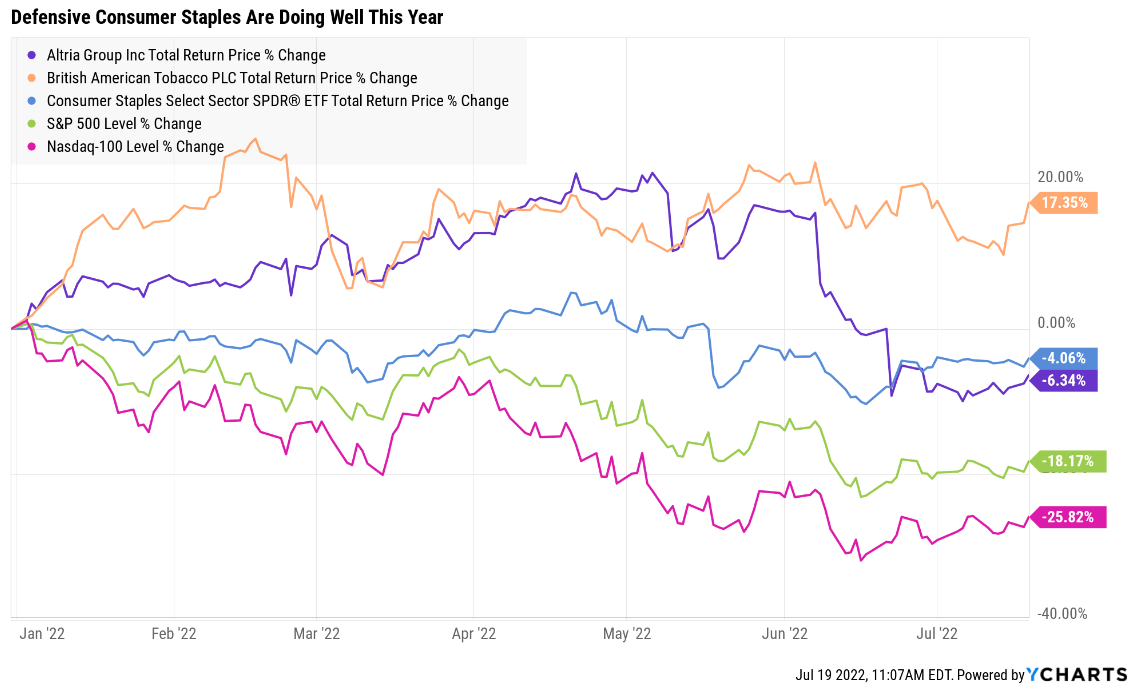
So far in the 2022 bear market, consumer staples is doing a good job of acting defensively, down just 4%. Altria is down a similar amount, even after a recent 25% crash, while BTI is once more a Wall Street darling.
But no company, no matter how defensive, can usually be relied on to go up in a bear market.
Fortune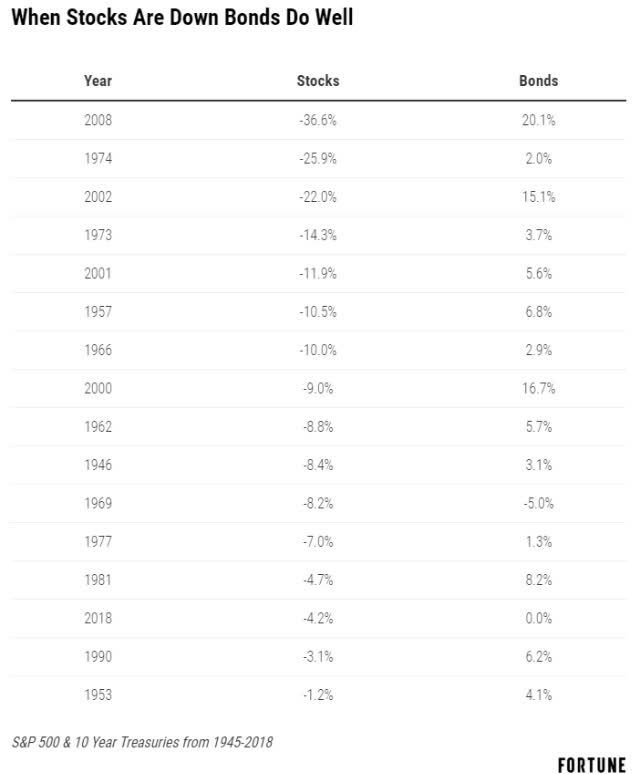
Despite what many people believed for the last decade, stocks are not actually a bond alternative.
- two different asset classes
- owned for two very different reasons
- 92% of the time, stocks fall, bonds are stable and go up
As the old Wall Street adage says, “stocks help us eat well, but bonds help us sleep well.”
In times of extreme market panic, even the most recession-resistant, low volatility aristocrats can fall hard and fast. Consider March 16th, 2020, the 3rd worst day in US market history.
Ycharts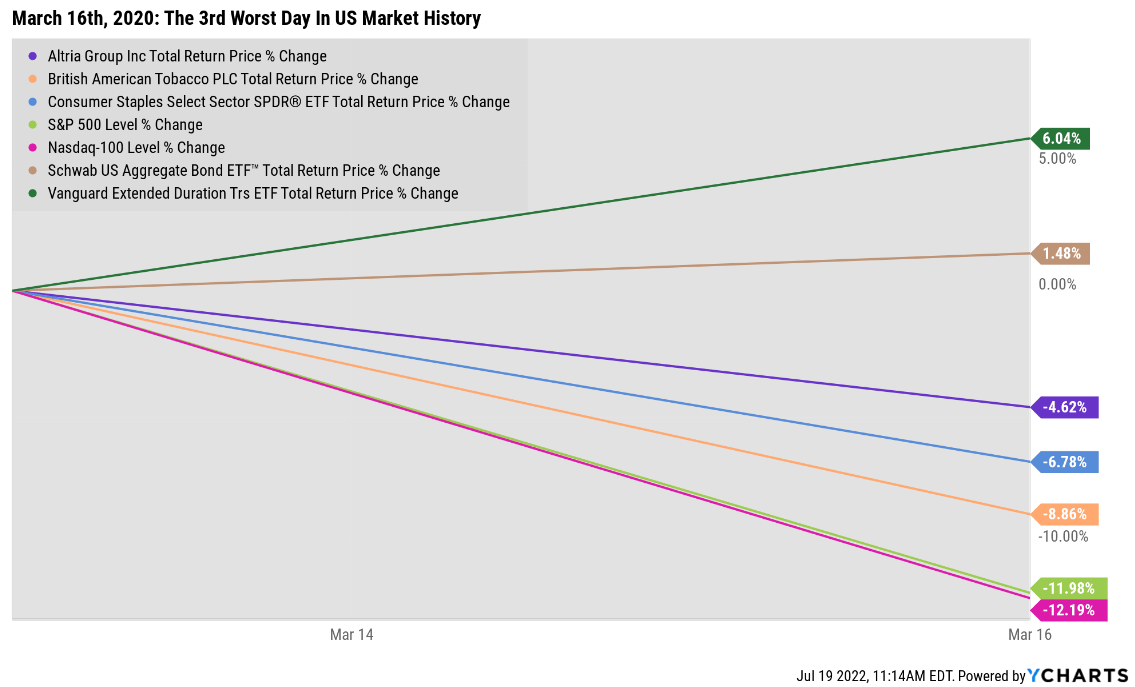
- S&P and Nasdaq -12%
- consumer staples -7%
- MO -5%
- BTI -9%
- bonds: +1.5%
- long bonds: +6%
Mind you MO and BTI did their job, even on this terrifying day, during the darkest days of the Pandemic.
- MO fell just 62% less than the market
- BTI fell 26% less than the market
- consumer staples fell 43% less than the market
What if you used a ZEUS investment strategy outlined in this article?
The basic structure of a ZEUS (long-term recession optimized blue-chip portfolio) is 33% ETFs, 33% cash and bonds, and 33% individual blue-chips.
For example, what if you were invested 33% into MO and BTI (equally allocated to both), 33% in XLP, and 33% in EDV?
How’s This For Sleeping Well At Night?
| Stock | Allocation | March 16th, 2020 Decline |
Weighted Decline |
| MO | 16.67% | -4.62% | -0.77% |
| BTI | 16.67% | -8.86% | -1.48% |
| XLP | 33.33% | -6.78% | -2.26% |
| EDV | 33.33% | 6.04% | 2.01% |
| S&P 500 | 0% | -12.0% | 0.00% |
| Total | 100.00% | -2.49% (79% Less Than S&P) |
(Source: Ycharts)
Now I’m not saying that you should actually put 33% of your portfolio into just two companies, even Ultra SWAN aristocrats like MO and BTI.
I’m just showing how combining high-yield defensive blue-chips, with defensive ETFs and defensive bonds can make for a far less terrifying time when Wall Street loses its mind.
Here’s what a 50/50 defensive portfolio would have done on March 16th, 2020.
| Stock | Allocation | March 16th, 2020 Decline |
Weighted Decline |
| MO | 0.00% | -4.62% | 0.00% |
| BTI | 0.00% | -8.86% | 0.00% |
| XLP | 50.00% | -6.78% | -3.39% |
| EDV | 50.00% | 6.04% | 3.02% |
| S&P 500 | 0% | -12.0% | 0.00% |
| Total | 100.00% | -0.37% (97% Less Than The S&P 500) |
(Source: Ycharts)
The point is that asset allocation is the 1st step to building the right sleep-well-at-night portfolio for your needs. One that withstands even the most horrific of market crashes.
Of course, as terrifying as March 16th, 2020 was, it was just a single day.
Altria & British American During Market Corrections Since 1985
Portfolio Visualizer Premium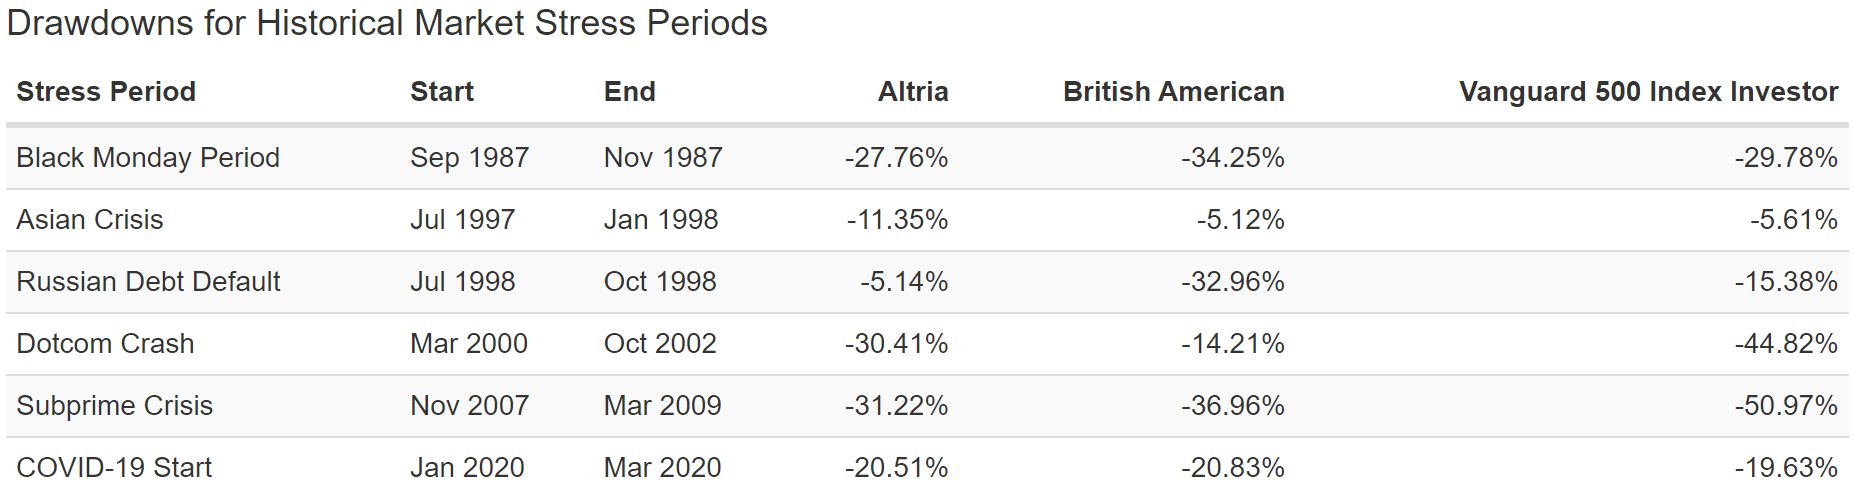
Depending on the correction’s causes, duration, and severity, you can’t necessarily rely on even the most defensive aristocrats to actually act defensively.
During the Black Monday bear market, MO fell 28%, similar to the S&P 500’s 30%, and BTI fell more, 34%.
So BTI fell more than MO both on March 16th, 2020, and during Black Monday’s crash. That means MO is the more defensive stock right?
During the Asian Financial Crisis of 1997, MO fell 11%, twice as much as the S&P 500’s 6% pullback. BTI fell only 5%.
But during the Russian Debt Default of 1998, MO fell 5% and BTI 33%, more than double the S&P 500’s 15%.
In the tech crash, MO fell 30% while BTI just 14%, both a lot less than the S&P 500.
During the Great Recession, both were defensive, falling 31% and 37% while the market was cut in half.
But in the Pandemic, both fell basically as much as the S&P 500.
And, of course, it doesn’t take an S&P correction for individual companies to tank.
MO Peak Declines Since 1985
Portfolio Visualizer Premium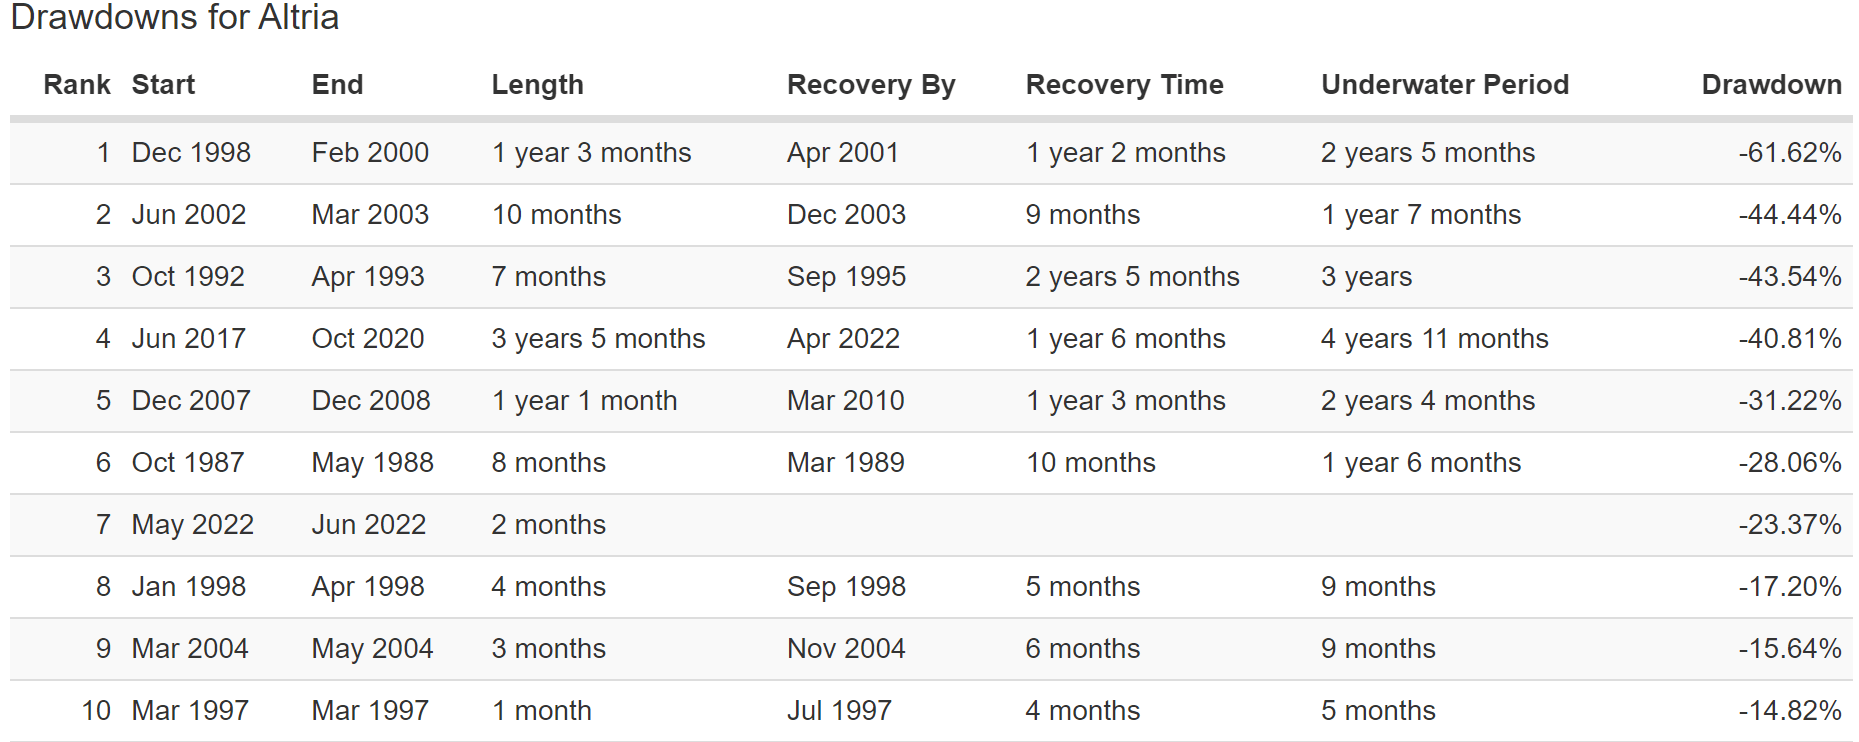
During the Master Settlement period, MO fell 62% in 15 months, its worst bear market since the Great Depression.
- it recovered to new record highs just 14 months later
Today MO is in a 23% bear market, the 7th worst of the last 37 years.
BTI Peak Declines Since 1985
Portfolio Visualizer Premium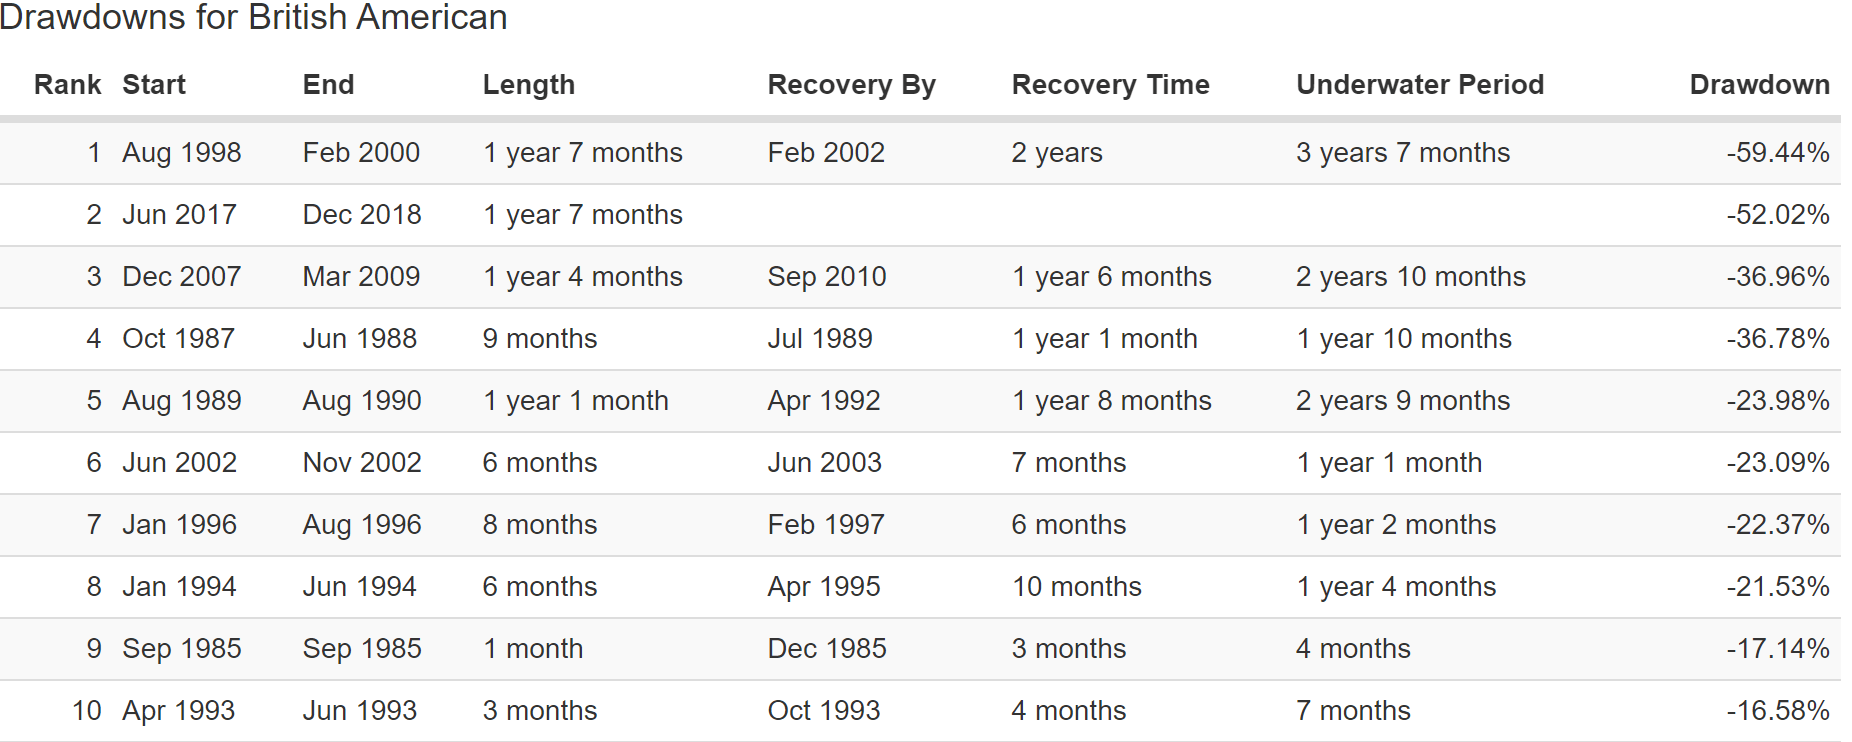
BTI is actually still in the 2nd worst bear market of the last 37 years, which began in mid-2017 when it was 50% historically overvalued.
- MO was 70% overvalued at the time.
FAST Graphs, FactSet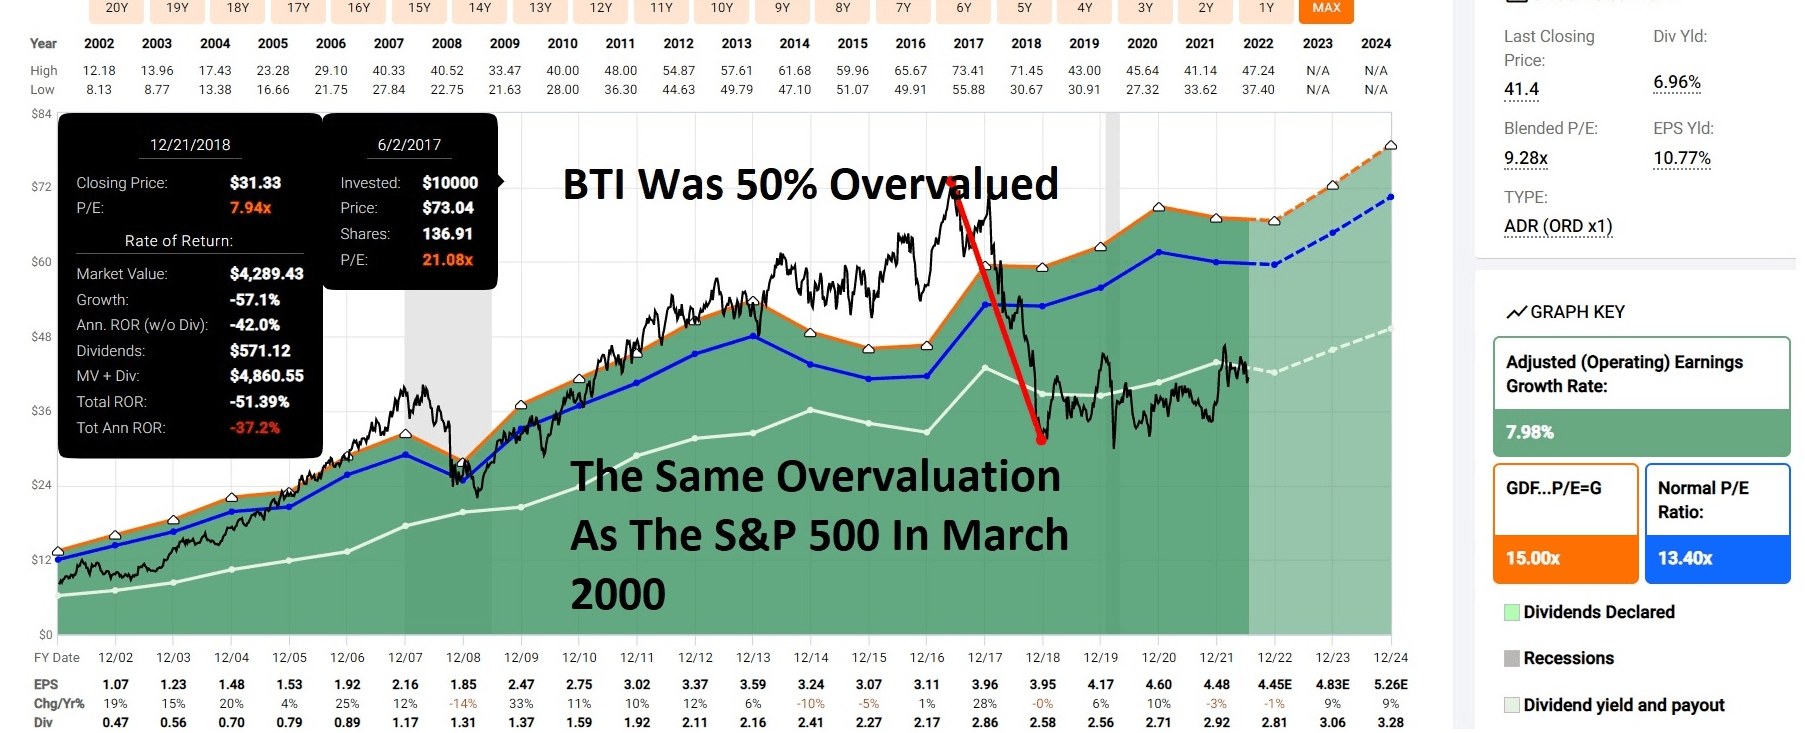
For context, the S&P 500 was 50% historically overvalued on March 24th, 2000, the peak of the tech bubble, the largest bubble in US market history.
That’s why BTI fell 52% in a year and a half and still trades at the best valuations in almost 20 years.
FAST Graphs, FactSet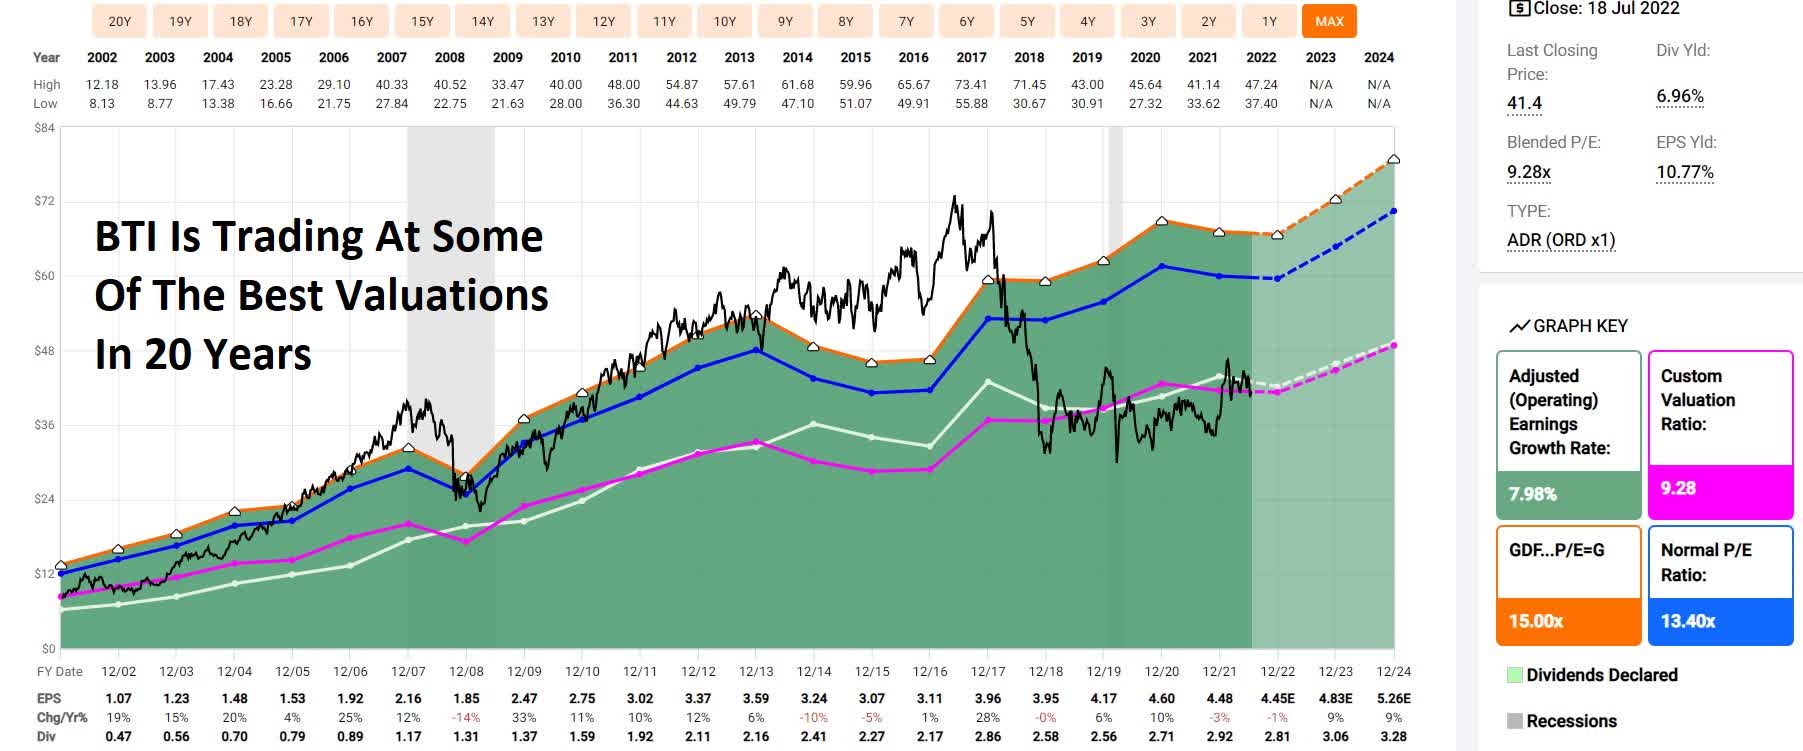
And lest you think that either BTI or MO is “broken” because they are still in bear markets, here’s what the S&P put investors through if they overpaid by 50% in the tech bubble.
It Took 6.25 Years For The S&P To Break Even After The Tech Bubble
Portfolio Visualizer Premium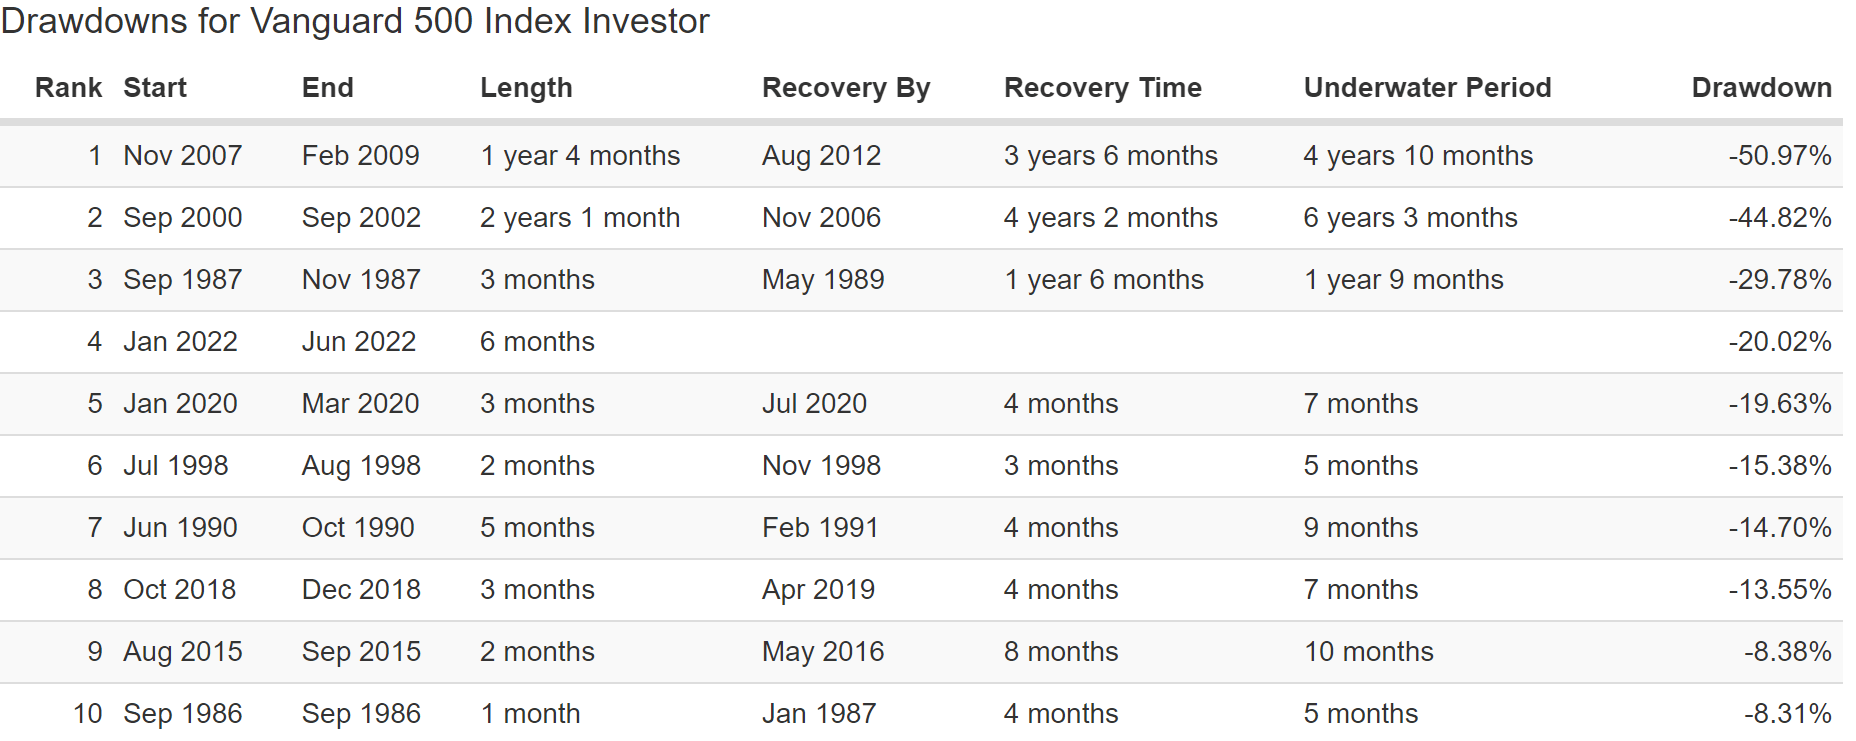
- Altria’s longest bear market is 4 years and 11 months since 1985
- BTI’s longest is 5 years and counting
But the point is that any company, even some of the best performing in history, will experience a bear market. That’s when high-yield compounds the fastest and why they deliver such strong returns.
Or, to put it another way, MO and BTI aren’t two of the best-performing stocks in history despite their bear markets, but precisely because of them.
But there is more to owning defensive companies than just typically smaller volatility in most market downturns (though obviously not all).
Nobody can predict interest rates, the future direction of the economy or the stock market. Dismiss all such forecasts and concentrate on what’s actually happening to the companies in which you’ve invested.”- Peter Lynch (emphasis added)
The recession-resistant nature of their highly predictable businesses makes MO and BTI defensive.
| Year | MO EPS Growth | BTI EPS Growth | S&P EPS Growth | MO Dividend Growth | BTI Dividend Growth |
S&P 500 Dividend Growth |
| Great Recession (2007-2009) | 30% | 29% | -40% | 52% | 17% | -25% |
| Pandemic | 3% | 10% | -14% | 4% | 6% | -2% |
| 2023 (Potential Recession Year) | 6% | 9% | 7% | 8% | 9% | 6% |
| Average | 13.0% | 16.0% | -15.7% | 21.3% | 10.7% | -7.0% |
(Source: FAST Graphs, FactSet)
BTI and MO both managed to grow their earnings by 30% during the Great Recession, almost the mirror image of the S&P 500’s 40% earnings decline.
They grew their dividends by an impressive amount, while the S&P’s dividends were cut 25%.
During the Pandemic, they also delivered positive growth in both the bottom line and their dividends, while the S&P 500’s earnings contracted 14% and dividends fell a modest 2%.
For now, the S&P 500 is expected to deliver positive growth next year, but that could change if we get a recession, which Bank of America, Deutsche Bank, and the bond market think is likely.
But BTI and MO? I have a far easier time believing they can deliver on those consensus forecasts even if the economy is contracting.
- the last time MO delivered negative earnings growth was -2% in 2003
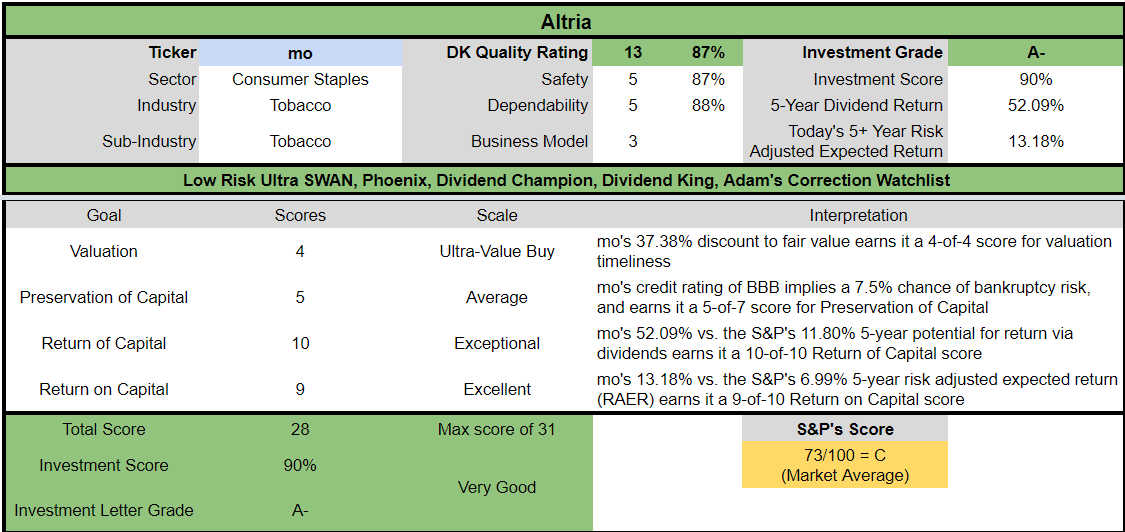
Which is the most defensive company? Based on historical earnings and dividend growth, this round goes to Altria.
Altria Vs. British American: Safety And Quality You Can Trust
See these articles for deep dive examinations of each company’s growth prospects, investment thesis, risk profile, valuation, and return potentials.
- Altria: This 8% Yielding Dividend Aristocrat Could Potentially Double In 3 Years
- 7% Yielding British American Tobacco Is The Perfect Bear Market Buy
Here is a summary of each company’s safety and fundamental quality data.
| Company | Altria | British American | Altria Wins |
British American Wins |
| Yield | 8.4% | 7.0% | 1 | |
| LT Growth Consensus | 5.0% | 9.4% | 1 | |
| Total Return Potential | 13.4% | 16.4% | 1 | |
| LT Risk-Adjusted Expected Return | 8.7% | 10.9% | 1 | |
| Inflation & Risk-Adjusted Expected Return | 6.2% | 8.4% | 1 | |
| Years To Double | 11.6 | 8.5 | 1 | |
| Historical Total Return | 16.8% | 13.7% | 1 | |
| 12-Month Consensus Total Return Potential | 28% | 29% | 1 | |
| 12-Month Fundamentally Justified Total Return Potential | 69% | 63% | 1 | |
| Discount To Fair Value | 38% | 36% | 1 | |
| PE | 8.8 | 9.5 | 1 | |
| DK Rating | Ultra Value Buy | Ultra Value Buy | 1 | 1 |
| Automatic Investment Decision Score | 90% A-, Very Good |
94% A, Excellent |
1 | |
| Quality Score | 87% | 84% | 1 | |
| Safety Score | 87% | 82% | 1 | |
| Dependability Score | 88% | 86% | 1 | |
| Long-Term Risk-Management Industry Percentile | 61% Above-Average | 72% Good | 1 | |
| Credit Rating | BBB Stable | BBB+ Negative | 1 | |
| 30-Year Bankruptcy Risk | 7.50% | 5.00% | 1 | |
| Dividend Growth Streak (Years) | 52 | 23+ | 1 | |
| Return On Capital (12-Months) | 334% | 197% | 1 | |
| Return On Capital Industry Percentile | 92% | 86% | 1 | |
| Return On Capital (13-Year Median) | 416% | 176% | 1 | |
| Return On Capital (5-Year trend) | -24.0% | -4% | 1 | |
| Sum | 13 | 12 |
(Source: DK Zen Research Terminal)
MO is a slightly higher quality company, as confirmed by its longer-dividend growth streak and higher returns on capital.
Ben Graham considered a 20+ year dividend growth streak an important sign of excellent quality
- both companies meet the Graham standard of excellence
Joel Greenblatt considers return on capital his gold standard proxy for quality and moatiness.
- annual pre-tax profit/the money it takes to run the business
- 40% CAGR returns for 21 years using ROC and valuation
The S&P 500’s 2021 ROC was 14.6%, while MO and BTI have ROC of 197% to 334%.
Over the last 13 years, their median ROCs were 416% and 176%, respectively.
BTI’s ROC is currently above its 13-year median, indicating a steadier moat than MO’s, which has declined for several years.
BTI Profit Margin Consensus Forecast
| Year | FCF Margin | EBITDA Margin | EBIT (Operating) Margin | Net Margin | Return On Capital Expansion |
Return On Capital Forecast |
| 2020 | 28.7% | 47.0% | 44.1% | 29.5% | 1.10 | |
| 2021 | 26.8% | 43.1% | 40.5% | 27.4% | TTM ROC | 196.83% |
| 2022 | 31.0% | 47.4% | 44.1% | 30.2% | Latest ROC | 193.21% |
| 2023 | 32.2% | 47.9% | 44.7% | 31.0% | 2025 ROC | 217.31% |
| 2024 | 32.3% | 48.2% | 45.2% | 31.7% | 2025 ROC | 213.31% |
| 2025 | 32.5% | 47.8% | 44.7% | 32.2% | Average | 215.31% |
| 2026 | NA | NA | NA | NA | Industry Median | 60.89% |
| 2027 | NA | NA | NA | NA | BTI/Industry Median | 3.54 |
| Annualized Growth | 3.06% | 0.64% | 0.26% | 1.75% | Vs. S&P | 14.75 |
| Annualized Growth (Ignoring Pandemic) | 6.50% | 3.78% | 2.51% | 4.12% |
(Source: FactSet Research Terminal)
BTI’s margins are expected to grow rapidly in the coming years.
MO Profit Margin Consensus Forecast
| Year | FCF Margin | EBITDA Margin | EBIT (Operating) Margin | Net Margin | Return On Capital Expansion |
Return On Capital Forecast |
| 2020 | 39.1% | 56.1% | 55.7% | 38.9% | 1.04 | |
| 2021 | 39.0% | 57.1% | 55.9% | 40.4% | TTM ROC | 334.17% |
| 2022 | 40.4% | 59.8% | 58.3% | 41.6% | Latest ROC | 762.32% |
| 2023 | 40.3% | 60.6% | 59.2% | 43.0% | 2024 ROC | 346.36% |
| 2024 | 41.5% | 62.0% | 60.1% | 44.0% | 2024 ROC | 790.12% |
| 2025 | 40.6% | 59.5% | 58.0% | 42.4% | Average | 568.24% |
| 2026 | NA | NA | NA | NA | Industry Median | 64.74% |
| 2027 | NA | NA | NA | NA | MO/Industry Median | 8.78 |
| Annualized Growth | 0.73% | 1.17% | 0.80% | 1.69% | Vs. S&P | 38.92 |
| Annualized Growth (Post Pandemic) | 0.99% | 1.05% | 0.90% | 1.22% |
(Sources: FactSet Research Terminal)
MO’s are expected to rise but not as quickly.
- because it’s already a more profitable company
- with 40% free cash margins
So does this mean it’s a good idea to own both MO and BTI?
- assuming you’re comfortable with both company’s risk profiles, yes
- but just remember to size your positions in accordance with your personal risk profile
- 33% max risk cap OR LESS in all tobacco
- most investors are more comfortable with 15%
- so 16.5% each MAX
- but 5% each is the prudent choice for most investors
This brings us to each company’s risk profile.
- see the risk profile for each company in the deep dive articles I linked too
Here is a summary of how six rating agencies consider both companies to manage their long-term fundamental risks.
BTI Long-Term Risk Management Consensus
| Rating Agency | Industry Percentile |
Rating Agency Classification |
| MSCI 37 Metric Model | 58.0% |
BBB, Average, Negative Trend |
| Morningstar/Sustainalytics 20 Metric Model | 85.6% |
26.8/100 Medium-Risk |
| Reuters’/Refinitiv 500+ Metric Model | 99.5% | Excellent |
| S&P 1,000+ Metric Model | 86.0% |
Very Good, Stable Trend |
| FactSet | 50.0% |
Average, Positive Trend |
| Morningstar Global Percentile (All 15,000 Rated Companies) | 50.5% | Average |
| Consensus | 72% |
Low-Risk, Good Risk-Management, Stable Trend |
(Sources: MSCI, Morningstar, S&P, FactSet, Reuters)
BTI is considered a low-risk company by the rating agencies we use to assess long-term risk management.
MO Long-Term Risk Management Consensus
| Rating Agency | Industry Percentile |
Rating Agency Classification |
| MSCI 37 Metric Model | 58.0% |
BBB Average, Positive Trend |
| Morningstar/Sustainalytics 20 Metric Model | 89.3% |
24.6/100 Medium-Risk |
| Reuters’/Refinitiv 500+ Metric Model | 94.7% | Excellent |
| S&P 1,000+ Metric Model | 36.0% |
Below Average, Negative Trend |
| FactSet | 30.0% |
Below Average, Positive Trend |
| Morningstar Global Percentile (All 15,000 Rated Companies) | 58.6% | Average |
| Consensus | 61% |
Low-Risk, Above-Average Risk-Management, Stable Trend |
(Sources: MSCI, Morningstar, S&P, FactSet)
So is MO, though BTI has superior risk management.
Why? Part of the reason is BTI’s superior execution on its reduced-risk product or RRP portfolio.
- RRPs now make up 14% of BTI sales
- up from 5% in 2019 and 8% in 2020
- up to 72% of sales in Sweden
BTI’s RRP customers have been growing steadily.
- +2.5 million in 2019
- +3.0 million in 2020
- +4.8 million in 2021
Today BTI’s smoke-free future plans include:
- vaping
- oral nicotine punches
- heat sticks
- cannabis
In contrast, MO has been counting on two main strategies for evolving to a smoke-free future.
- Juul (vaping)
- iQOs (PM’s heat sticks)
BTI is well ahead of MO in RRPs, and now, with the FDA fighting to pull Juul from the US market entirely (currently stay ordered by a federal court while Juul appeals) and PM potentially looking to go it alone with iQos (some analysts worry about this, most don’t), MO’s smoke-free future plans are on far shakier grounds than BTI’s.
In fact, MO’s biggest downside relative to BTI as far as risk goes, is its 100% US focus.
- FDA is planning on reducing nicotine to non-addictive levels in cigarettes
- not for RRPs
- no problem for tobacco companies with advanced RRP portfolios
- a big problem for any company who lacks RRPs
BTI estimates that the menthol ban in the US will not kick in until 2027.
And the nicotine reduction will similarly take several years.
However, MO is running out of time. If MO’s customers are forced to switch to BTI or PM’s RRPs to get their nicotine fix, then MO could be sunk.
Or to put it another way, MO does face an existential risk, if it can’t find a way to rapidly get its RRP plans back on track.
Do analysts currently think MO is a sinking ship?
MO Medium-Term Consensus Forecast
| Year | Sales | Free Cash Flow | EBITDA | EBIT (Operating Income) | Net Income |
| 2020 | $20,841 | $8,154 | $11,695 | $11,609 | $8,117 |
| 2021 | $21,111 | $8,236 | $12,044 | $11,807 | $8,519 |
| 2022 | $21,007 | $8,484 | $12,560 | $12,240 | $8,747 |
| 2023 | $21,288 | $8,589 | $12,892 | $12,609 | $9,147 |
| 2024 | $21,438 | $8,903 | $13,297 | $12,885 | $9,443 |
| 2025 | $22,052 | $8,949 | $13,118 | $12,783 | $9,341 |
| Annualized Growth | 1.14% | 1.88% | 2.32% | 1.95% | 2.85% |
| Annualized Growth (Post Pandemic) | 1.10% | 2.10% | 2.16% | 2.01% | 2.33% |
| Cumulative Over The Next 4 Years | $85,785 | $34,925 | $51,867 | $50,517 | $36,678 |
(Sources: FactSet Research Terminal)
MO is a slow-growing company, but it is growing, and analysts think it will overcome its RRP challenges.
MO Dividend Growth Consensus Forecast
| Year | Dividend Consensus | EPS Consensus | EPS Payout Ratio | Retained (Post-Dividend) Earnings | Buyback Potential | Debt Repayment Potential |
| 2022 | $3.75 | $4.86 | 77.2% | $2,011 | 2.27% | 6.9% |
| 2023 | $3.97 | $5.15 | 77.1% | $2,138 | 2.41% | 7.4% |
| 2024 | $4.23 | $5.43 | 77.9% | $2,174 | 2.45% | 7.5% |
| 2025 | $4.27 | $5.45 | 78.3% | $2,138 | 2.41% | 7.3% |
| Total 2022 Through 2025 | $16.22 | $20.89 | 77.6% | $8,462.04 | 9.55% | 29.23% |
| Annualized Rate | 4.42% | 3.89% | 0.51% | 2.06% | 2.06% | 1.68% |
(Sources: FactSet Research Terminal)
They also expect the dividend to keep growing steadily, per management’s 80% EPS payout ratio policy.
FactSet Research Terminal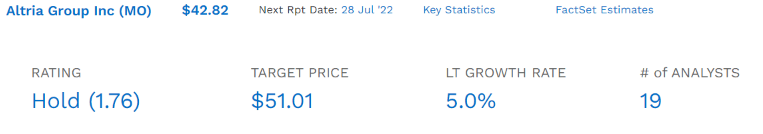
MO’s median growth consensus pre-Juul announcement was 5.4%. It’s now down to 5%.
How accurate are analysts at forecasting MO’s growth? Pretty darn accurate.
FAST Graphs, FactSet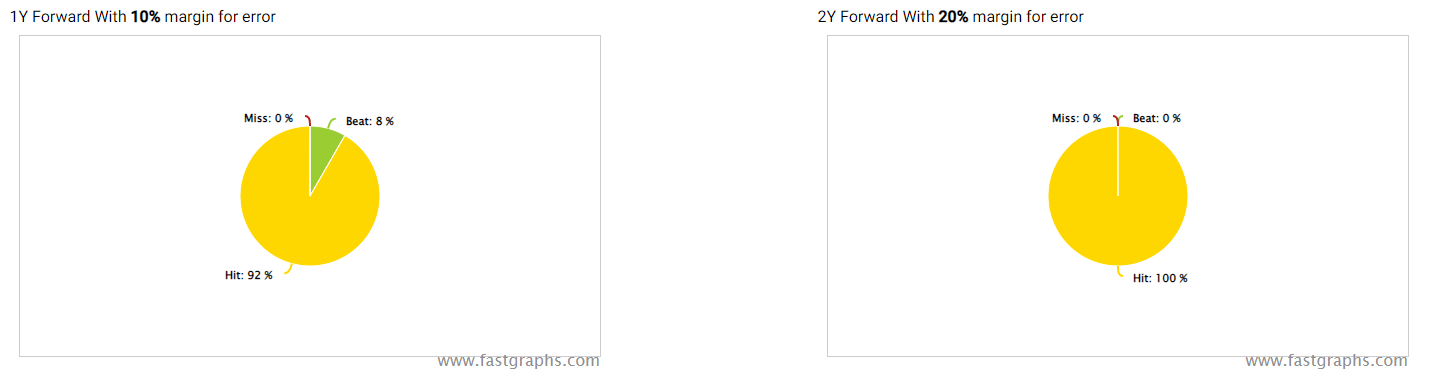
FAST Graphs, FactSet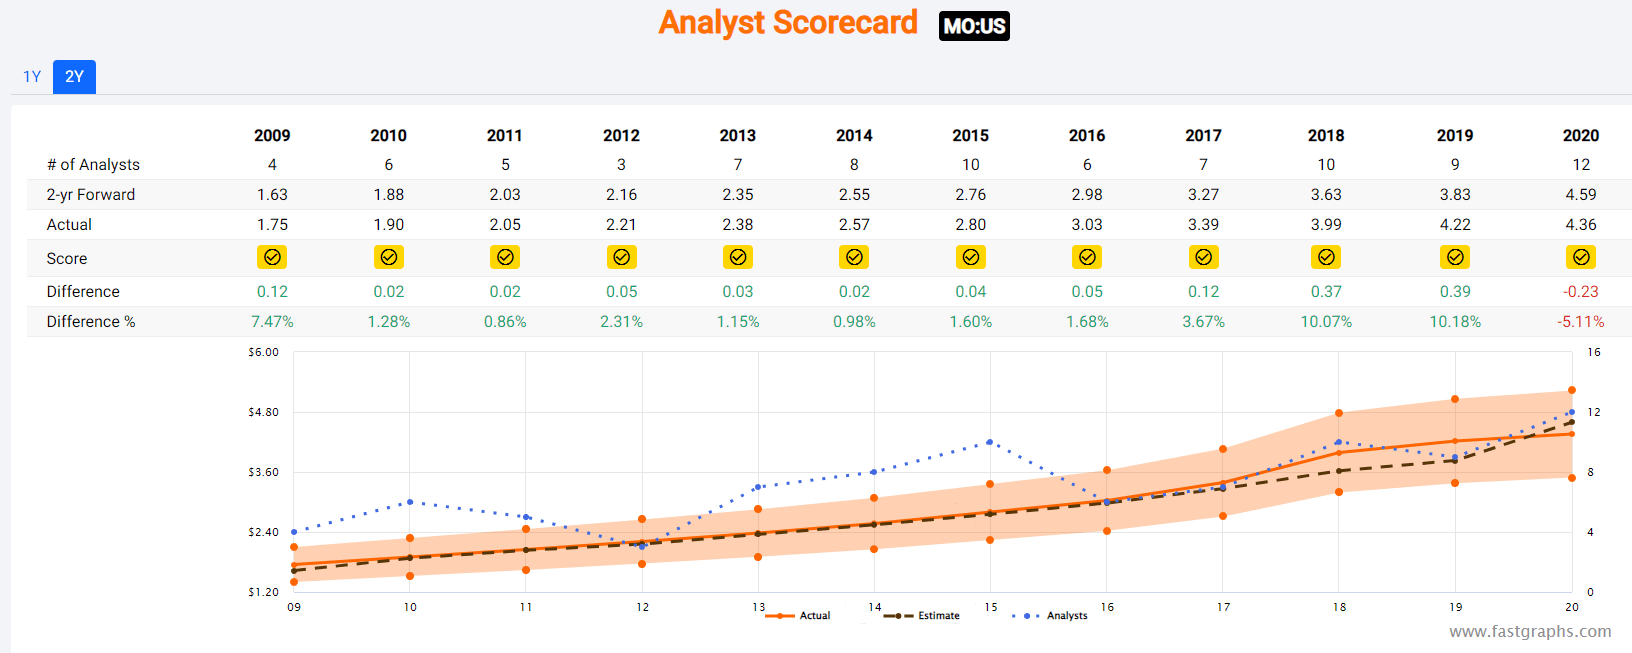
Other than the pandemic, MO hasn’t missed 2-year estimates in a decade.
Margins of error of 5% to the upside and downside.
- 5% to 6% CAGR margin-of-error adjusted growth consensus range
- 70% statistical probability that MO grows at 4% to 6% over time
But this is where the real difference between these two companies comes in, and why I like BTI as a slightly better and lower-risk long-term investment.
Altria Vs. British American: Both Can Help You Potentially Retire In Safety And Splendor
We’ve just seen that analysts are still confident that MO will keep growing by adapting and overcoming its latest challenges.
- just as it has for over 90 years
- when it delivered almost 180,000X inflation-adjusted returns
What about BTI?
FactSet Research Terminal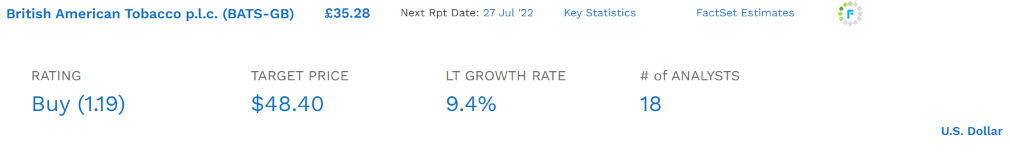
Analysts think that BTI is the growth king of tobacco.
- 20% of PM’s RRP sales were from Ukraine and Russia
- PM’s growth outlook has sunk from 11% to 3.7% following the invasion
FactSet Research Terminal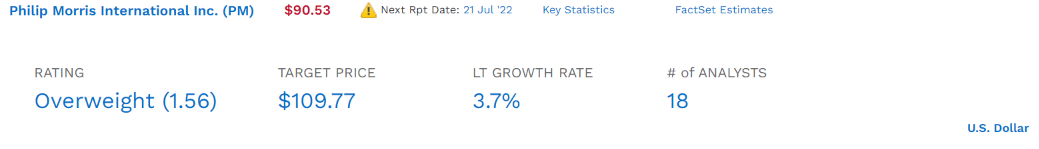
Long-Term Total Return Consensus Forecast (After Valuations Cancel Out)
| Investment Strategy | Yield | LT Consensus Growth | LT Consensus Total Return Potential | Long-Term Risk-Adjusted Expected Return | Long-Term Inflation And Risk-Adjusted Expected Returns | Years To Double Your Inflation & Risk-Adjusted Wealth |
10-Year Inflation And Risk-Adjusted Expected Return |
| British American | 7.0% | 9.4% | 16.4% | 11.5% | 9.0% | 8.0 | 2.37 |
| Altria | 8.4% | 5% | 13.4% | 9.4% | 6.9% | 10.4 | 1.95 |
| Nasdaq | 1.0% | 12.7% | 13.7% | 9.6% | 7.1% | 10.1 | 1.99 |
| Dividend Aristocrats | 2.6% | 8.6% | 11.2% | 7.8% | 5.4% | 13.4 | 1.69 |
| S&P 500 | 1.7% | 8.5% | 10.2% | 7.1% | 4.7% | 15.4 | 1.58 |
(Sources: Morningstar, FactSet, Ycharts)
Analysts currently expect BTI to deliver 3% higher annual returns than MO, thanks to its superior growth profile.
Mind you, once MO hikes its dividend in August (6% to 7% consensus), its 9% yield would raise its consensus return potential to 14% and close that gap a bit.
- assuming MO raises the dividend as expected
What does Nasdaq-like return over the long-term potentially mean for long-term high-yield investors in both companies?
Inflation-Adjusted Long-Term Consensus Return Potential (Ignoring Valuation): $1,000 Initial Investment
| Time Frame (Years) | 7.7% CAGR Inflation-Adjusted S&P Consensus | 10.9% Inflation-Adjusted MO Consensus | 13.9% CAGR Inflation-Adjusted BTI Consensus | Difference Between Inflation-Adjusted MO Consensus Vs BTI Consensus |
| 5 | $1,451.05 | $1,679.75 | $1,919.51 | $239.76 |
| 10 | $2,105.56 | $2,821.57 | $3,684.52 | $862.96 |
| 15 | $3,055.27 | $4,739.53 | $7,072.48 | $2,332.95 |
| 20 | $4,433.36 | $7,961.23 | $13,575.69 | $5,614.46 |
| 25 | $6,433.04 | $13,372.89 | $26,058.68 | $12,685.79 |
| 30 | $9,334.69 | $22,463.14 | $50,019.91 | $27,556.78 |
(Source: DK Research Terminal, FactSet Consensus)
Analysts expect MO to deliver 22.5X inflation-adjusted returns over the next 30 years, while BTI could potentially 50X.
| Time Frame (Years) | Ratio BTI/MO Consensus |
| 5 | 1.14 |
| 10 | 1.31 |
| 15 | 1.49 |
| 20 | 1.71 |
| 25 | 1.95 |
| 30 | 2.23 |
(Source: DK Research Terminal, FactSet Consensus)
That’s potentially more than 2X real returns from BTI than MO.
- and from a globally diversified company
- with a far more developed RRP profile
But that doesn’t mean that investors in either company can’t expect to potentially earn fantastic short to medium-term returns in the next few years.
Altria 2024 Consensus Return Potential
FAST Graphs, FactSet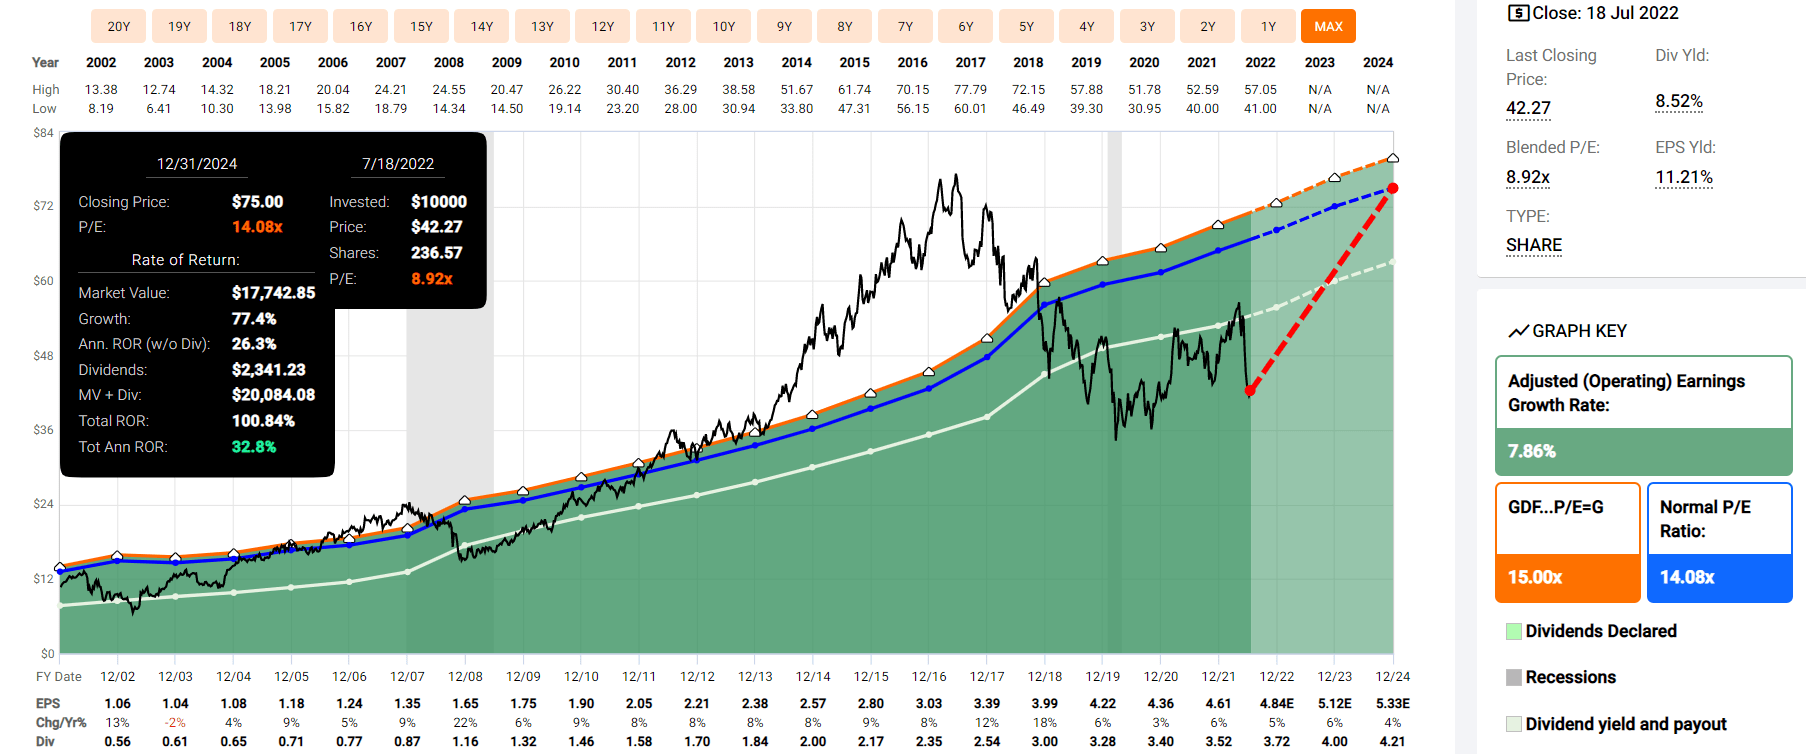
If MO grows as expected (it almost always does), and returns to its historical fair value within 2.5 years, then investors will enjoy 100% total returns or 33% annualized.
- 3X the S&P 500 consensus
- Buffett-like returns from a blue-chip aristocrat bargain hiding in plain sight
British American 2024 Consensus Return Potential
FAST Graphs, FactSet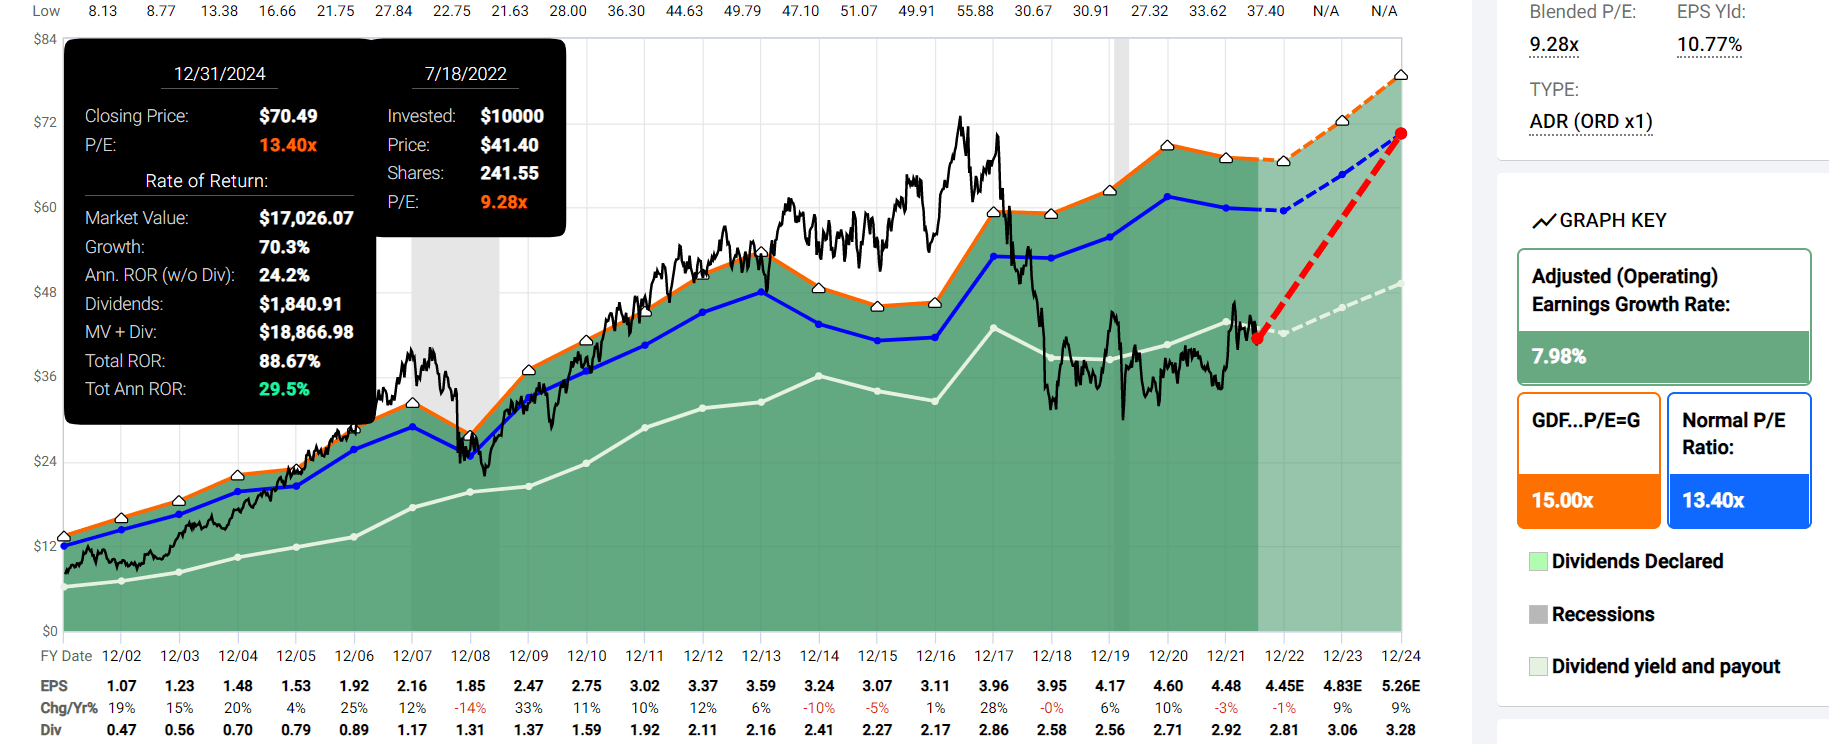
BTI is undervalued, growing as analysts expect (about 20% through 2024) and returning to its historical 13.4X earnings, could deliver 89% total returns over the next 2.5 years, or 30% annually.
- 2.5X the S&P 500 consensus
- Buffett-like return potential from a high-yield global aristocrat bargain hiding in plain sight
Altria 2027 Consensus Return Potential
FAST Graphs, FactSet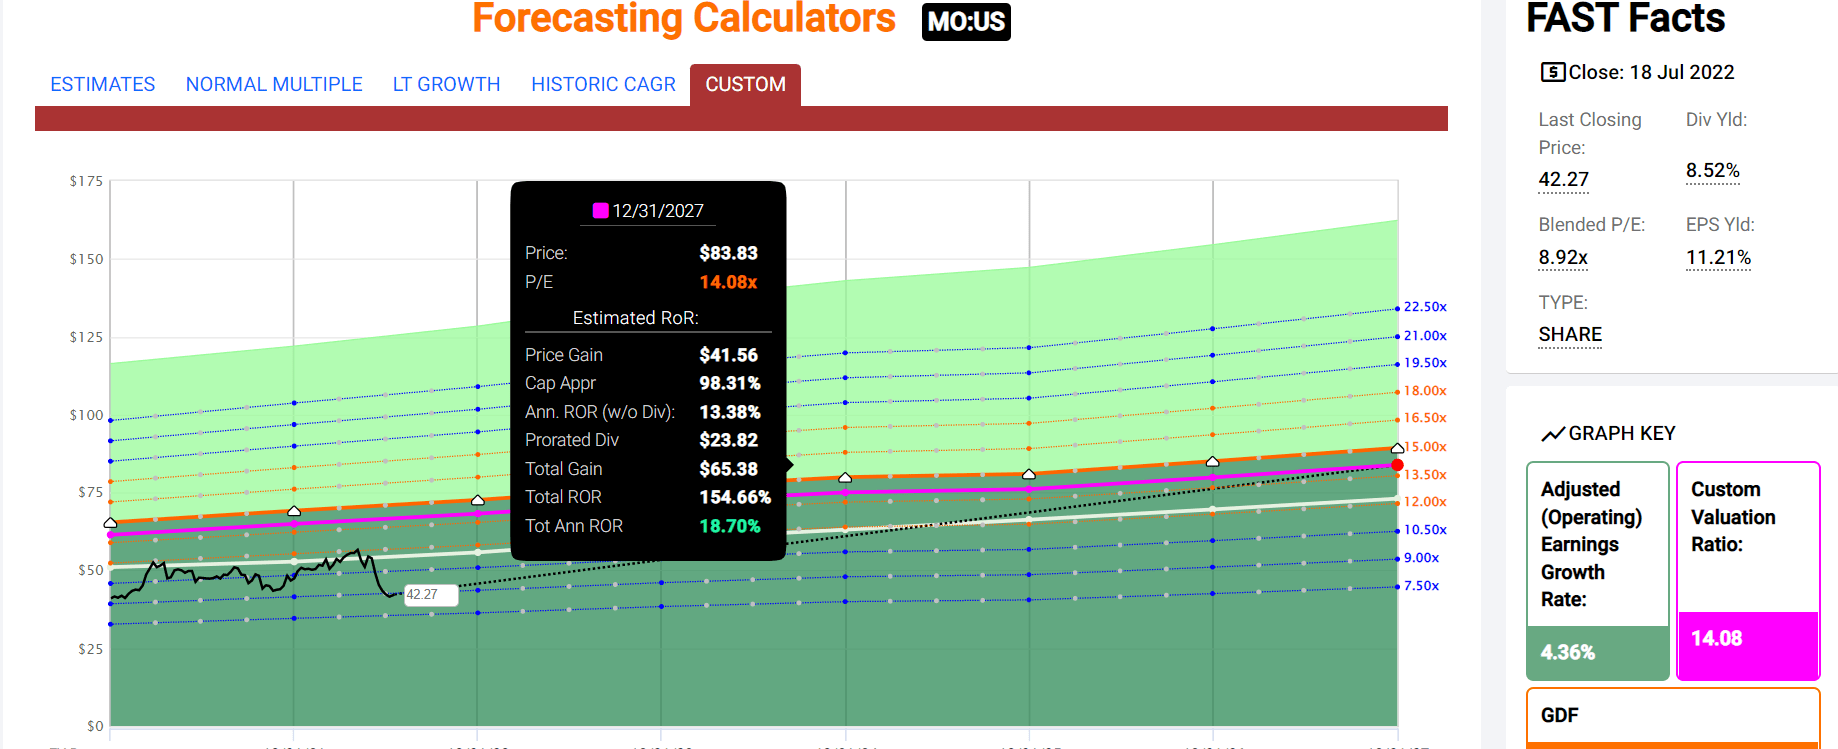
Analysts think MO could potentially deliver 155% total returns or 19% CAGR over the next five years.
- 3X the S&P consensus
- Buffett-like return potential from an aristocrat bargain hiding in plain sight
British American 2027 Consensus Return Potential
FAST Graphs, FactSet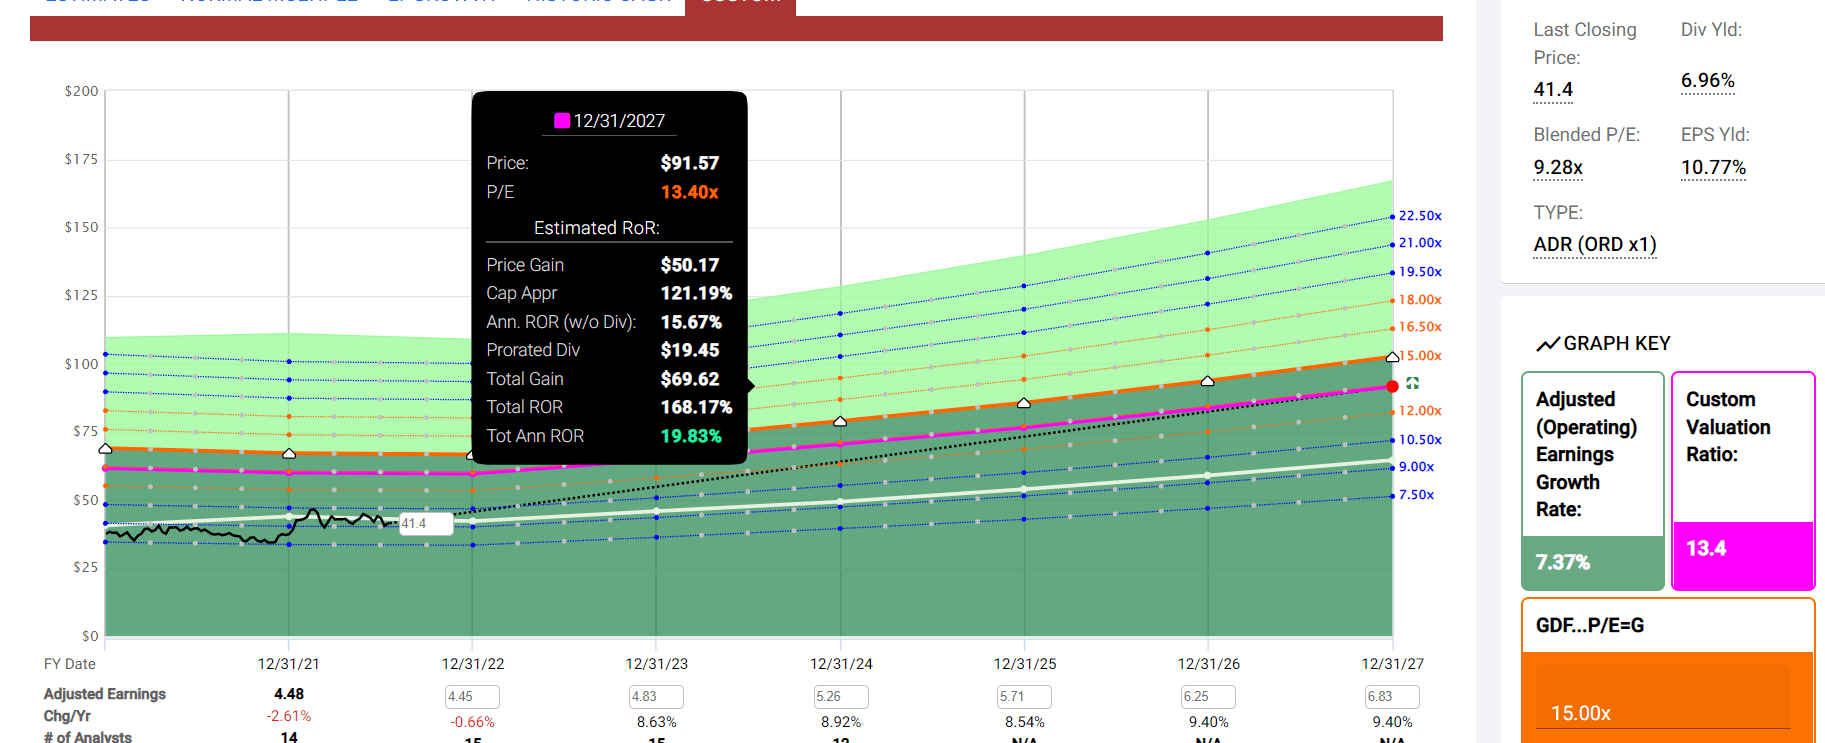
BTI, if it grows as expected and returns to historical fair value within five years, could deliver 168% total returns, or 20% annually.
- over 3X more than the S&P 500
- similar to MO (which is more undervalued but slower growing)
- Buffett-like return potential from a high-yield defensive aristocrat bargain hiding in plain sight.
Here’s how that compares to the S&P 500.
S&P 2024 Consensus Total Return Potential
FAST Graphs, FactSet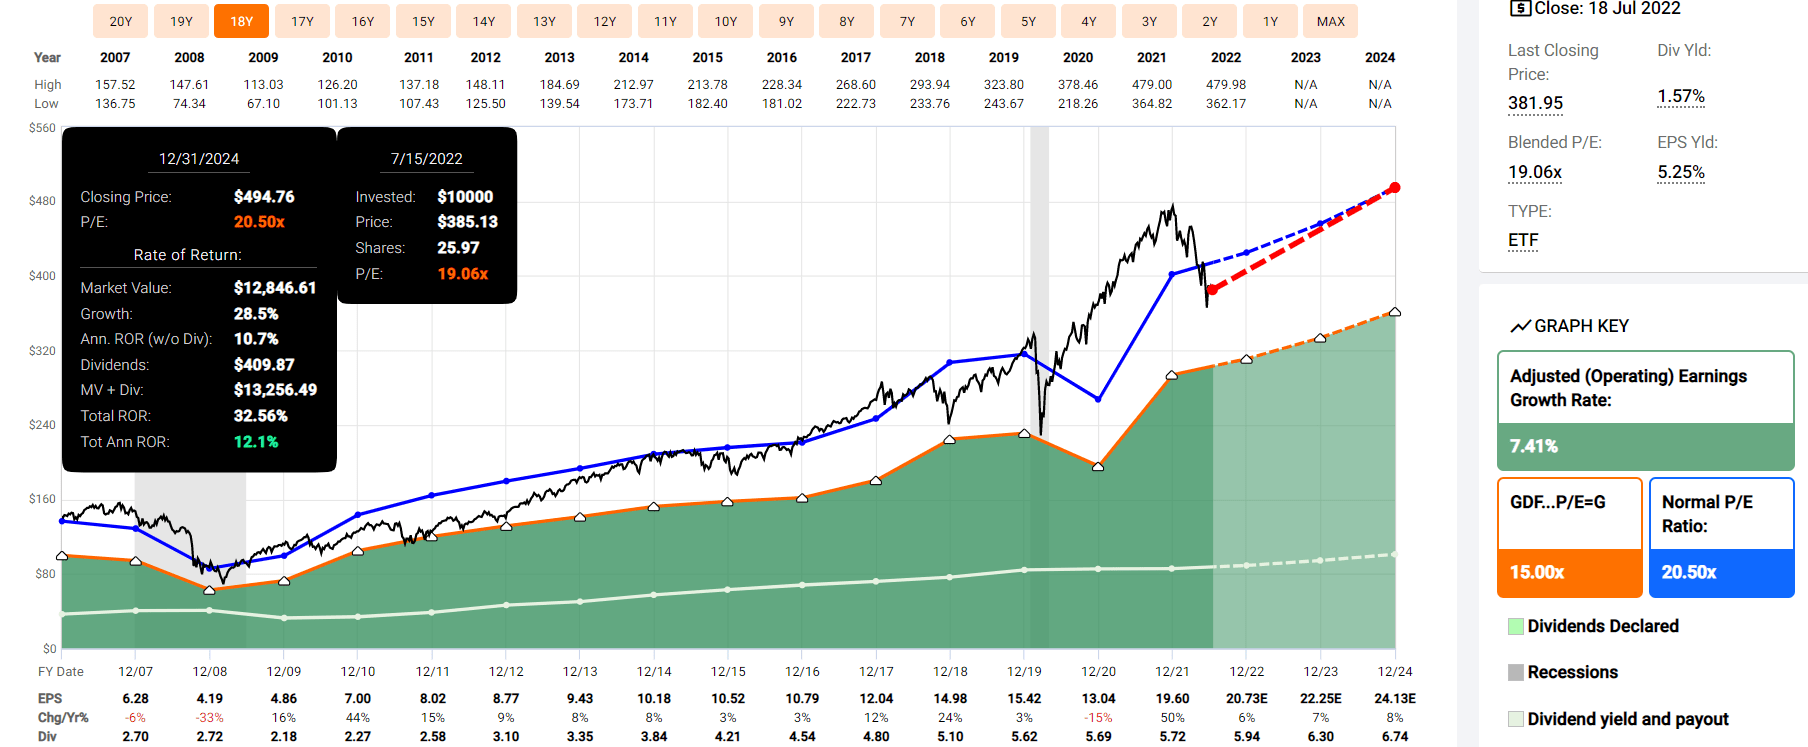
Analysts currently expect attractive 12% total returns through the end of 2024 from today’s modestly undervalued market levels.
S&P 500 2027 Consensus Total Return Potential
| Year | Upside Potential By End of That Year | Consensus CAGR Return Potential By End of That Year | Probability-Weighted Return (Annualized) | Inflation And Risk-Adjusted Expected Returns |
Expected Market Return Vs. Historical Inflation-Adjusted Return |
| 2027 | 56.22% | 9.33% | 7.00% | 4.90% | 72.06% |
(Source: Dividend Kings S&P 500 Valuation & Total Return Tool)
And 9.3% annual returns through 2027, though on a risk and inflation-adjusted basis, it’s a more modest 4.9%.
Bottom Line: Both Of These High-Yield Aristocrats Can Help You Retire In Safety And Splendor, But BTI Is The Slightly Safer Choice Today
For anyone comfortable with the risk profile of the tobacco industry, BTI and MO are the best blue-chip bargains you can buy today.
DK Dividend Kings Automated Investment Decision Tool
Dividend Kings Automated Investment Decision Tool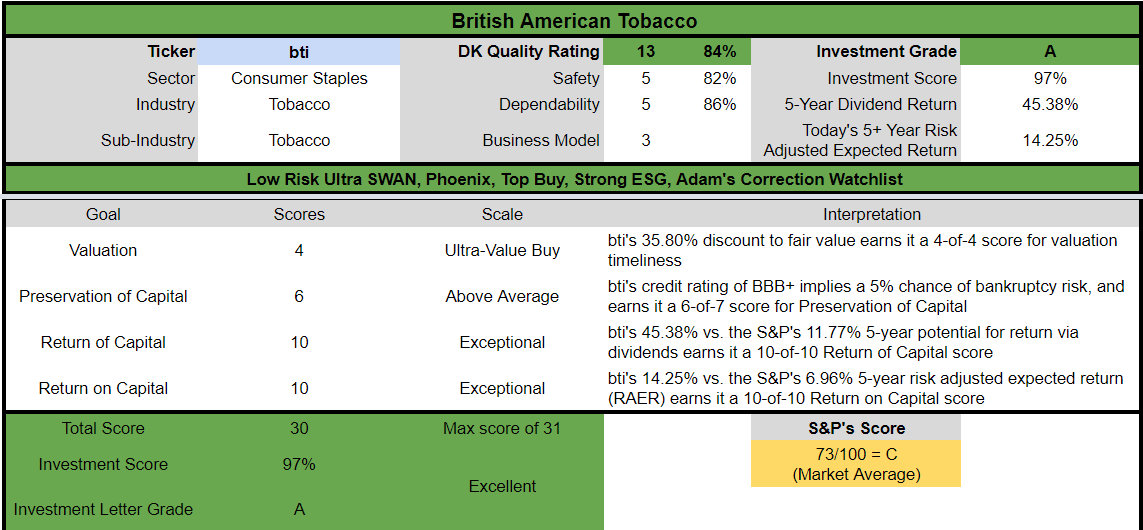
- low-risk Ultra SWAN quality dividend kings and global aristocrats
- highly defensive, recession-resistant business models that grew earnings and dividends at robust rates in the Great Recession
- grew earnings and dividends during the Pandemic
- are expected to grow earnings and dividends in the mild 2023 recession, the bond market is expecting
Altria is slightly higher quality, based on profitability and dividend growth streaks (the Greenblatt and Graham standards of excellence).
Altria is also slightly more undervalued at 8.8X earnings vs. BTI’s still highly attractive 9.5X.
- MO’s cash-adjusted PE is 8.0
- BTI’s cash-adjusted PE is 9.0
MO yields a very safe 8.4% today, and the consensus from analysts is it will yield 9.0% come the annual August increase. MO is growing at a modest 5% and struggling with its RRP portfolio.
BTI yields a very safe 7.0% today and, thanks to very strong RRP execution, has the strongest growth consensus in the industry, 9.4% (7% to 9% management guidance).
This means that MO offers 13.4% to 14% long-term return potential if it can successfully overcome the Juul setback.
BTI offers a 16.9% long-term return potential.
Both companies are expected to deliver similar market-smashing returns as they have for the last 37 years.
That’s four decades of bear markets, numerous regulatory scares, and bears loudly proclaiming that tobacco is dead.
The investment thesis for MO, BTI, and PM has nothing to do with tobacco and everything to do with the pivot to RRPs, cannabis, and medical devices (for PM).
In other words, just as they have for nearly a century, tobacco companies are adapting and overcoming the challenges and risks they face to help deliver generous, very safe, and steadily growing dividends.
And just as they have for nearly 100 years, in which tobacco delivered the best total returns of any industry, analysts think that patient high-yield investors will be richly rewarded in the years and decades to come.
Today BTI and MO offer similar short and medium-term total return potential.
- approximately 100% through 2024 = 32% CAGR = 3X the S&P consensus
- approximately 160% through 2027 = 20% CAGR = 3X the S&P consensus
I personally own a lot of both companies in my retirement portfolio, though I own about 2X as much BTI. If I had to only buy one, I would go with BTI.
That’s thanks to its superior long-term risk profile:
- global diversification
- far more advanced RRP profile
- more developed investments into cannabis
- slightly better long-term risk management (72nd percentile vs. 61st for MO)
- BBB+ credit rating vs BBB for MO (5% 30-year bankruptcy risk vs 7.5% for MO)
As long as you’re comfortable with the industry risk profile and size your positions appropriately within a diversified and prudently risk-managed portfolio, it’s tough to go wrong with either of these high-yield rich retirement aristocrats.
Be the first to comment