

Spotmatik
This article was published on Dividend Kings on Monday, February 6th, 2023.
——————————————————————————
Dividend aristocrats are the most dependable income investments in history, and the only thing better are dividend kings, companies with 50+ year dividend growth streaks.
Justin Law 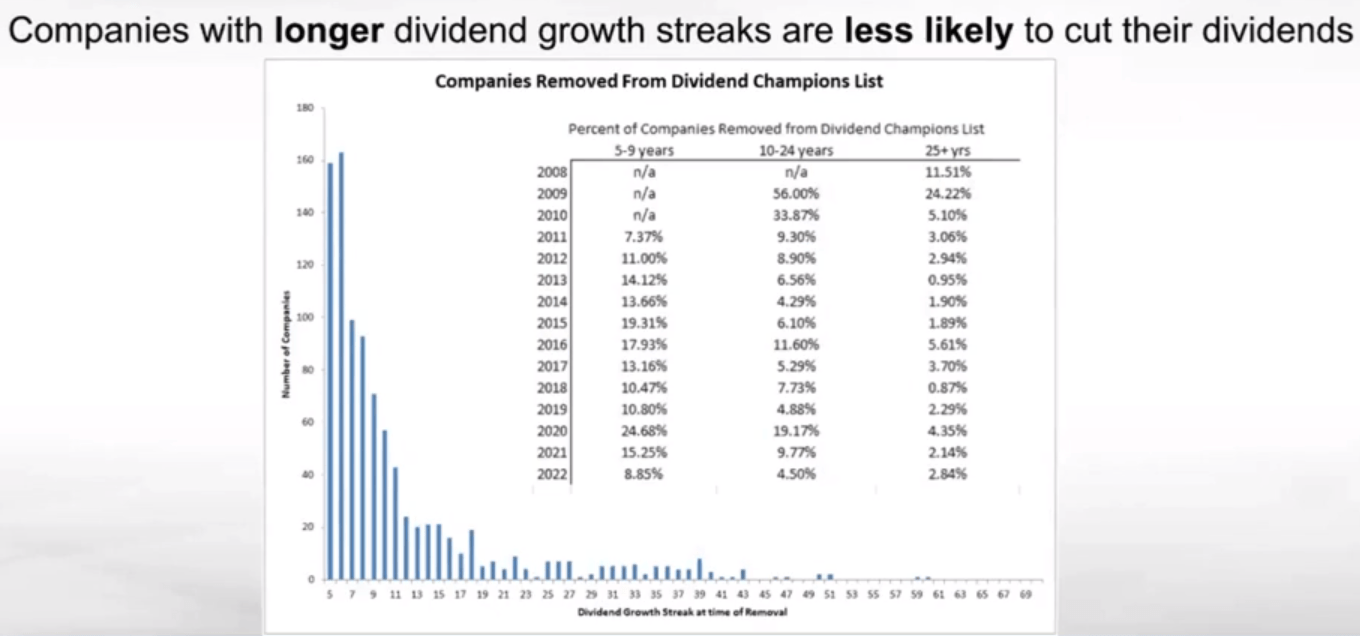
Even in the most extreme economic conditions, like the Great Recession, dividend aristocrats were half as likely to cut their dividends as the average stock.
In the Pandemic? They were 5X less likely to cut and we’re not even talking about dividend kings, but just aristocrats.
A company doesn’t get to a 50-year streak without a solid balance sheet, adaptable management team, good long-term risk management, and cash flow that’s stable enough to ride out the tough times.
Altria Group, Inc. (NYSE:MO) is one of the most celebrated dividend kings in history. Not just for its incredible 53-year dividend growth streak, but also because it’s the single best-performing stock in history.
- turning $1 invested 90 years ago into $173,000 today, adjusted for inflation.
But of course, you can’t drive towards the retirement of your dreams only looking in the rearview mirror. Altria just delivered better-than-expected earnings, which sent shares soaring 6% in a single day.
Let’s take a look at both the good and bad things in those earnings and why Altria ultimately continues to deliver the goods where it matters most.
In other words, while keeping a keen eye on the risks ahead, I’ll show you why Altria remains one of my favorite ultra-yield aristocrat retirement dream stocks for the years ahead.
Earnings: Better Than Expected But With An Important Catch
What sent Altria rocketing higher by 6% on the day of earnings?
The market’s big rally courtesy of the Fed’s “dovish” press conference didn’t hurt, but it was mostly about earnings.
Seeking Alpha 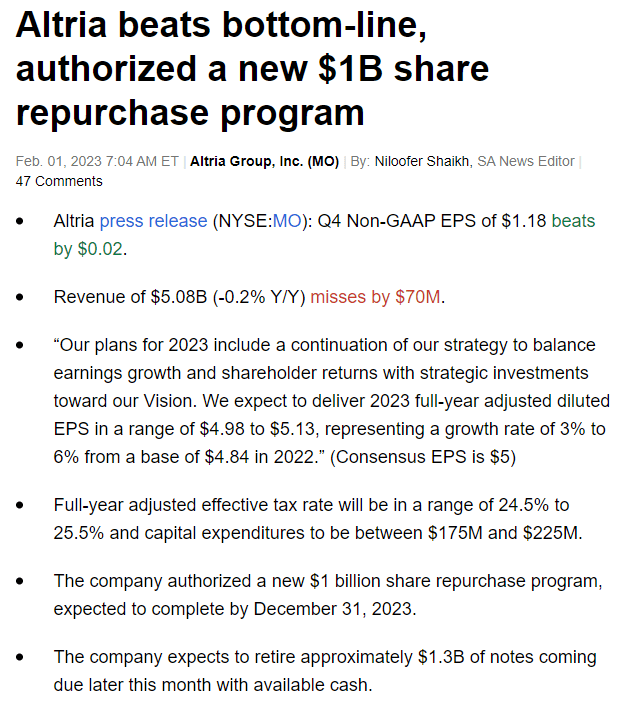
This is a highly predictable business, so the beats or misses are single-digit percentages. MO beat expectations by about 2% on its bottom line. More importantly for Wall Street, management guided for about 4.5% growth in 2023, compared to the 4% that analysts were expecting.
Another $1 billion in planned buybacks (1.2% of shares at current valuations) added to the optimism.
When a dividend aristocrat is this undervalued, Wall Street doesn’t take much to get excited; such is the nature of coiled spring deep value blue-chip investing.
Now from Wall Street’s reaction, you might think that Altria didn’t report any bad news. And that’s not true.
MO’s volume declines in Q4 were surprisingly bad, at 12%. The company was able to mostly offset this with 9% price increases for the quarter and 9.5% for the entire year, higher than the 8% inflation rate of 2022.
But naturally, such price hikes aren’t sustainable in a recession in 2023, and inflation is still well elevated.
However, our valuation does not support continued double-digit volume declines. As consumers feel the pinch of inflation, we expect softer price increases in 2023 than the 9% realized in the fourth quarter to ease the pressures on volume from the deep discount category.” – Morningstar
The good news is that when adjusted for the calendar and inventory levels, the actual volume declines were elevated by quite as frightening an amount as the headline figure indicates.
earnings presentation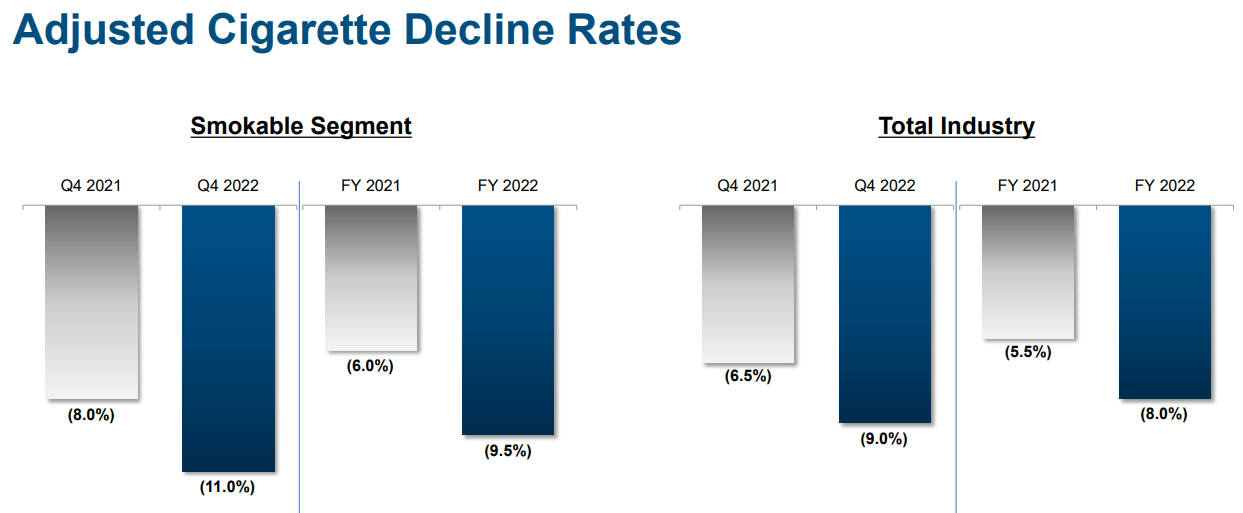
MO lost some market share in 2022 as consumers hit by inflation traded down to discount brands.
- MO’s market share in the U.S. is 47.4% at the end of 2022.
Neither Morningstar nor the overall analyst consensus is too concerned about the elevated volume declines in 2022. But rest assured, I’m watching the volume decline closely because 4% to 6% was the former management guidance back when 4% to 7% EPS growth was the guidance growth rate.
That was the rate at which MO was supposed to be able to generate modest cigarette volume growth, which, combined with cost-cutting and buybacks, should allow it to keep growing on a per-share basis long enough for reduced-risk products or RRPs, to get it through the transition to a smoke-free future.
- Morningstar estimates a 5% annual volume decline; MO has about 20 to 25 years before it can no longer raise prices to keep cigarette revenue stable
- at 10% decline rates, it’s about 10 to 12.5 years and makes the RRP portfolio even more important.
How Management Plans To Adapt To Declining Cigarette Volumes
Despite a 9.5% decline in volumes in 2022, MO’s cigarette revenue was flat, thanks to raising its prices by 9.5%.
FactSet Research Terminal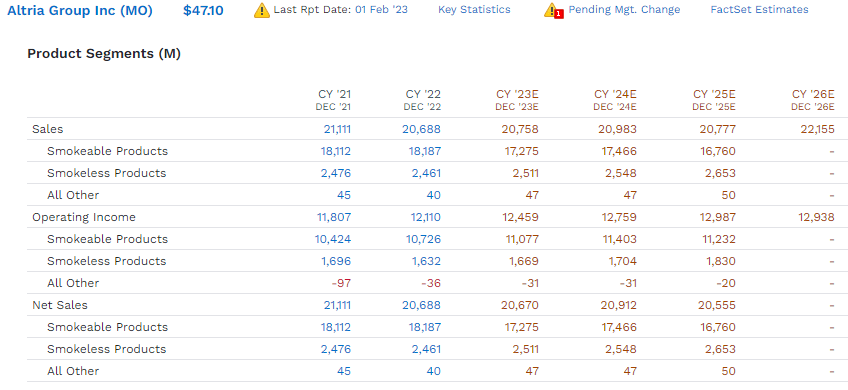
But that’s expected to be no longer the case starting in 2023. Unlike Morningstar, which expects MO’s smokeable revenue to remain relatively flat for the foreseeable future, analysts expect cigarette revenue to decline from $18.2 billion in 2022 to $16.8 billion in 2025.
- -2.6% per year
- at the former price hike guidance of approximately 7% implying volume declines of about -10% per year through 2025.
OMG! The bears were right! Altria’s prices have reached a point where they can’t maintain stable revenue from their core product! Doomsday is here for Altria at last!;)
Actually, while the bears appear to be right on negative cigarette sales growth, at least according to the 19 analysts covering MO on Wall Street, they appear to be wrong about everything else.
Are cigarette revenues expected to fall every year from now on? So it would seem.
But what about overall revenue? 1.8% annual revenue growth through 2026.
Even if you assume that the 2026 estimate is a single lone analyst, the estimates for revenue through 2025 are flat. How is that possible if cigarette revenue is in terminal decline?
Because of smokeless products, including RRPs, those sales are expected to grow by 3.9% annually and keep MO’s sales flat or grow modestly (back loaded as RRPs launch).
earnings presentation 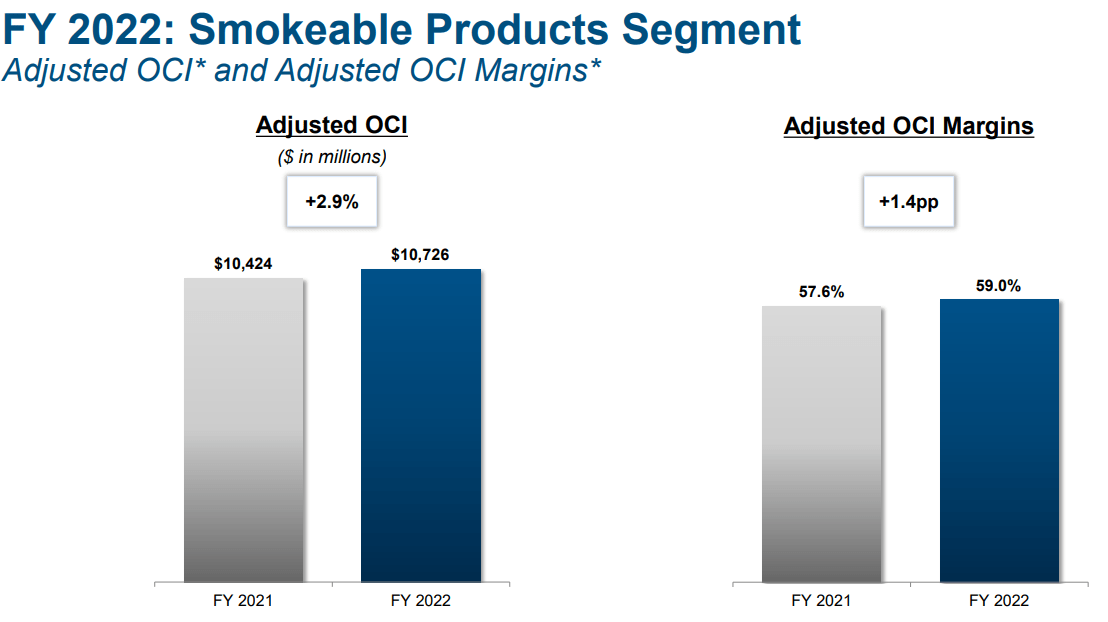
And in the meantime, let’s not forget that dividends aren’t paid out of revenue but earnings and cash flow…per share.
While MO’s cigarette revenue was flat in 2022, it boosted operating margins by 1.4%, resulting in about 3% growth in cigarette operating earnings.
So what are MO’s RRP plans? The thing meant to get them past the eventual banning of menthol by the FDA and regulating nicotine to non-addictive levels?
Horizon is optimizing for the U.S. market and plans to begin regulatory preparations later this year. We’re excited about the opportunity and are working diligently to bring Ploom to smokers in the U.S…
We also look forward to unveiling this exciting new product at our Investor Day next month as well.” – MO CEO, Q4 earnings call
MO has a joint venture with Japan Tobacco (OTCPK:JAPAF) to market its Horizon heat sticks through its retail network in the U.S. as soon as the FDA approves them.
That’s expected to happen in late 2023, or early 2024, and MO has a 75% revenue share from that deal.
It’s also planning on launching its own vaping product, which will be unveiled at its March investor day.
earnings presentation 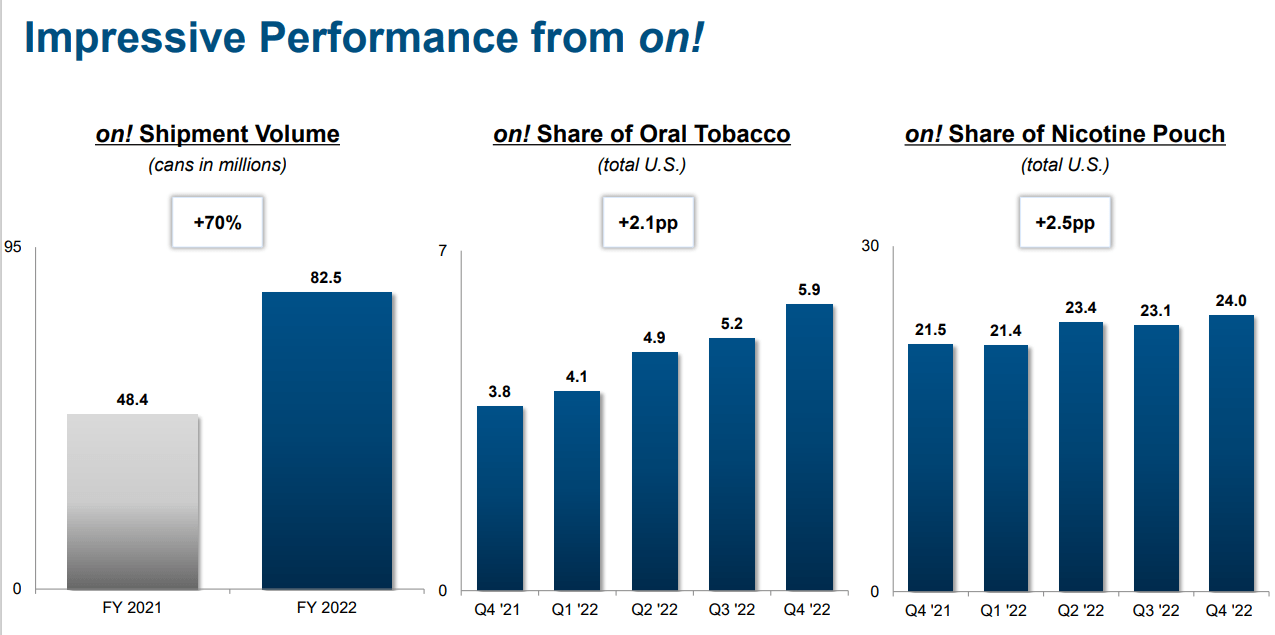
It’s on! Oral nicotine pouches are growing at 70% though granted from a small base. Still, it’s achieved a 6% market share of the oral tobacco market, and its market share in this fast-growing part of the industry is slowly but steadily rising.
Granted, compared to Philip Morris (PM) and British American (BTI), MO is still a major laggard in RRPs. BTI’s RRPs are growing from 30% to 50%, and PM is the global titan with over 50% market share worldwide.
MO needs to execute very well on RRPs because it lacks the geographic and regulatory diversification of its two larger peers.
- BTI estimates that the FDA might ban menthol as early as 2027 in the U.S.
There is one other component of MO’s growth plan, which is 100% within its control.
FactSet Research Terminal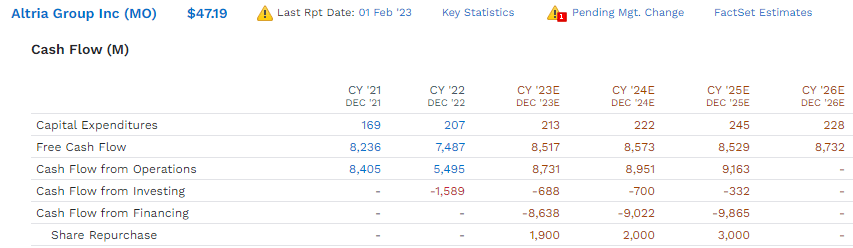
MO is expected to use its prodigious free cash flow (41% free cash flow margins) to buy back stock at an accelerating rate.
- 1% growth in free cash flow through 2026.
Analysts expect $1.9 billion in buybacks in 2023, $2 billion in 2023, and $3 billion in 2025.
- $7 billion in buybacks in 3 years
- 8% of shares at current valuations
- 2.4% annual rate.
How can MO afford to keep buying back stock like this?
earnings presentation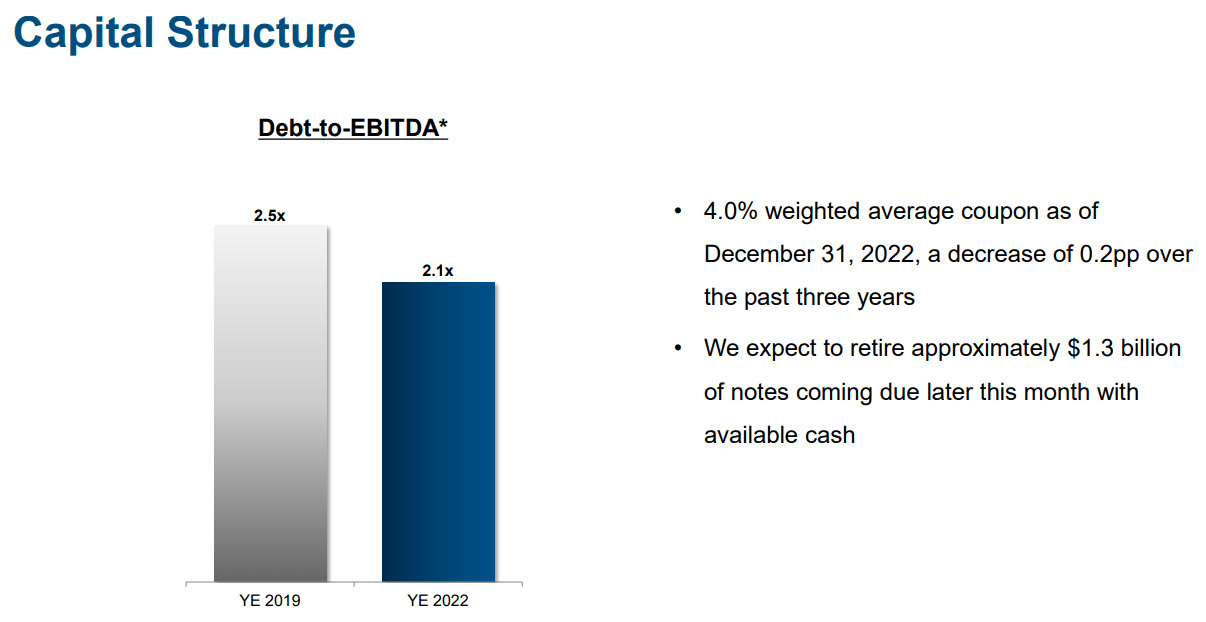
Because it’s finished de-leveraging after acquiring Juul and Cronos back in 2018.
- rating agencies consider 3.0X net debt/EBITDA safe for this industry
- MO’s net debt/EBITDA is now 2.0X.
What about the future?
- 2025 consensus leverage ratio: 2.1 (same as today).
In other words, while Juul and Cronos were a mistake, which management has admitted, the balance sheet damage has since been fixed.
So what does all this mean for MO’s earnings and dividends per share, the only thing that ultimately matters to Wall Street and investors and the stock price?
FactSet Research Terminal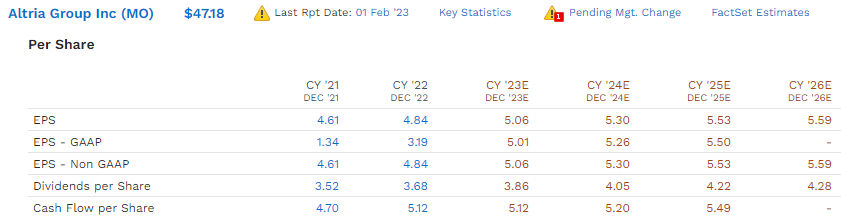
Steady growth in earnings, cash flow, and dividends per share every year through 2026.
- 2.5% annual growth in EPS
- 2.4% growth in cash flow per share
- 3.9% annual dividend growth.
MO’s policy targets an 80% EPS payout ratio (85% is safe, according to rating agencies).
That’s why the dividend is expected to grow slightly faster than earnings through 2026, while the payout ratio in 2026 is expected to be 77%, still below management’s long-term target.
Wait, isn’t 3% earnings growth slower than what management is guiding for in 2023? Yup. Isn’t that pretty weak? Yup. So why am I confident enough to still own over $100K worth of MO and be willing to buy more on weakness?
Because analysts are confident that MO’s smoke-free future plans will succeed. How do I know?
FactSet Research Terminal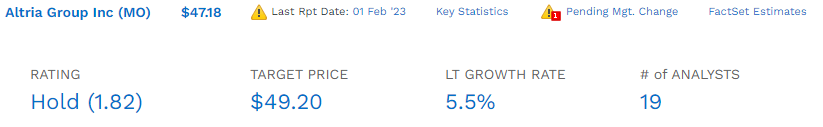
Before earnings MO’s long-term (post-2026) median growth consensus was 5.0%. Now it’s 5.5%.
So analysts are more optimistic post-earnings than pre-earnings that MO’s future RRP plans will succeed. Do you know who else is?
FactSet Research Terminal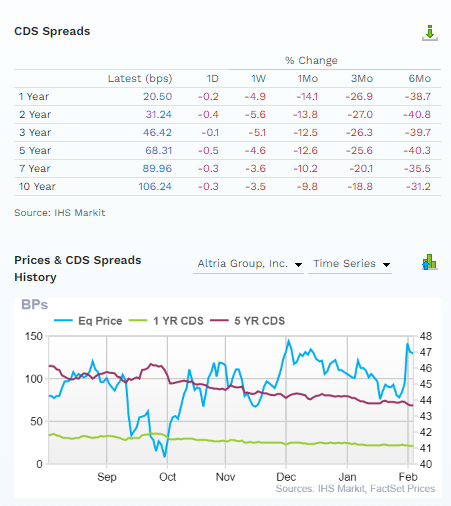
The bond market, via credit default swaps, tells us its real-time fundamental risk assessment of Altria. Every day I can see the exact market pricing of MO’s short to long-term default risk.
Bond investors care only about fundamental risk and aren’t swayed by stock price gyrations. And the bond market estimates that MO’s fundamental risk has decreased by about 30% to 40% in the last six months.
Do you know what else the bond market can tell us?
FactSet Research Terminal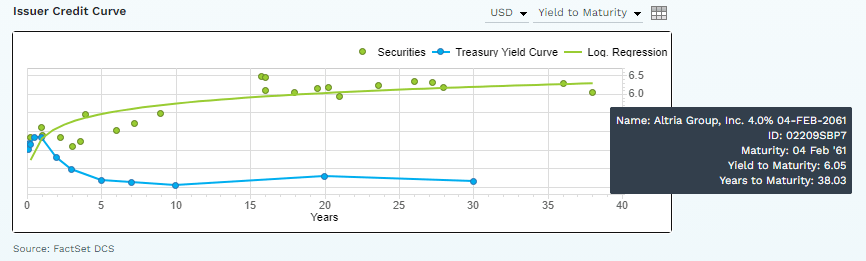
They are willing to bet millions that MO will still be around and repaying its debts in 2061, almost 40 years from now.
Do you know what U.S. cigarette sales will likely be in 2061? Zero. So how can MO survive for four decades if its current core business is extinct? Because the RRP-based smoke-free future will succeed.
And don’t just take my word for it; that’s according to:
- 19 analysts
- three credit rating agencies
- the bond market.
OK, so maybe MO won’t go to zero within 40 years, but what if it doesn’t grow at 5% to 6% like analysts currently think, once it gets its RRPs scaled up?
What if it only grows at 1% to 2%, similar to what Verizon is growing at?
- in that case long-term returns would be 8% yield + 1% to 2% growth = 9% to 10%.
And what if MO does grow at 5.5%, as analysts think?
Long-Term Consensus Return Potential
| Investment Strategy | Yield | LT Consensus Growth | LT Consensus Total Return Potential | Long-Term Risk-Adjusted Expected Return |
| Altria | 8.0% | 5.5% | 13.5% | 9.5% |
| ZEUS Income Growth (My family hedge fund) | 4.1% | 9.3% | 13.4% | 9.4% |
| REITs | 3.9% | 6.1% | 10.0% | 7.0% |
| Schwab US Dividend Equity ETF | 3.6% | 8.6% | 12.2% | 8.5% |
| Qualcomm | 2.3% | 7.8% | 10.1% | 7.1% |
| Vanguard Dividend Appreciation ETF | 2.2% | 10.0% | 12.2% | 8.5% |
| 60/40 Retirement Portfolio | 2.1% | 5.1% | 7.2% | 5.0% |
| Dividend Aristocrats | 1.9% | 8.5% | 10.4% | 7.3% |
| S&P 500 | 1.7% | 8.5% | 10.2% | 7.1% |
| Nasdaq | 0.8% | 10.9% | 11.7% | 8.2% |
(Source: DK Research Terminal, FactSet, Morningstar).
MO’s risk-adjusted expected returns are superior to any ETF you can buy and even my family hedge fund.
- Which is why it’s an 8% holding right now.
OK, but how accurate are analysts at forecasting MO’s growth over time?
FAST Graphs, FactSet
Within a reasonable margin of error, MO hasn’t missed analyst growth estimates for 20 years. Know why? Because analyst targets are based on management guidance, management knows this very stable business well.
When management says MO can deliver around 4% to 5% EPS growth this year, you can pretty much bet that is how fast it will grow. And when analysts say MO can grow 5% to 6% long-term, because its RRP plans will succeed?
Well, I’m more than happy to take that high-probability bet, especially when I’m getting paid a very safe 8.0% yield.
In other words, with a margin of safety this high, there is almost no downside to MO as long as it can grow EPS at zero over time.
- In fact, MO would have to grow at -8.1% or worse for long-term investors to lose money
- assuming they don’t become forced sellers for emotional or financial reasons.
Valuation: The 5th Most Undervalued Dividend Aristocrat You Can Buy
| Metric | Historical Fair Value Multiples (all years) | 2022 | 2023 | 2024 | 2025 | 2026 |
12-Month Forward Fair Value |
| 25-year average yield | 5.47% | $64.35 | $68.74 | $68.74 | $74.22 | $78.24 | |
| Earnings | 13.98 | $64.45 | $70.74 | $74.09 | $77.31 | $78.15 | |
| Average | $64.40 | $69.72 | $71.32 | $75.73 | $78.20 | $69.91 | |
| Current Price | $47.13 | ||||||
|
Discount To Fair Value |
26.82% | 32.41% | 33.91% | 37.77% | 39.73% | 32.58% | |
|
Upside To Fair Value (Including Dividends) |
36.64% | 47.94% | 51.32% | 60.69% | 65.92% | 56.31% | |
| 2023 EPS | 2024 EPS | 2021 Weighted EPS | 2022 Weighted EPS | 12-Month Forward EPS | 12-Month Average Fair Value Forward PE | Current Forward PE |
Current Forward Cash-Adjusted PE |
| $5.06 | $5.30 | $4.48 | $0.61 | $5.09 | 15.4 | 9.3 | 8.5 |
MO is trading at 8.5X cash-adjusted earnings, pricing it for literally zero growth.
- an anti-bubble valuation.
What if MO does grow at zero? Then long-term, you’ll make 8% returns, still better than a 60/40 and better than almost any bond.
- junk bonds average 34% default risk, MO just 7.5% according to S&P.
And if it grows at least 2.3% over time? Then you’ll beat the S&P while earning almost 5X the much safer yield on day one.
| Rating | Margin Of Safety For Medium-Risk 13/13 Ultra SWAN Quality Companies | 2023 Fair Value Price | 2024 Fair Value Price | 12-Month Forward Fair Value |
| Potentially Reasonable Buy | 0% | $69.72 | $71.32 | $69.91 |
| Potentially Good Buy | 5% | $66.24 | $67.75 | $66.41 |
| Potentially Strong Buy | 15% | $59.27 | $60.62 | $59.42 |
| Potentially Very Strong Buy | 25% | $49.68 | $53.49 | $52.43 |
| Potentially Ultra-Value Buy | 35% | $45.32 | $46.36 | $45.44 |
| Currently | $47.13 | 32.41% | 33.91% | 32.58% |
| Upside To Fair Value (Including Dividends) | 55.92% | 59.30% | 56.31% |
MO is a potentially very strong buy for anyone comfortable with its risk profile.
FAST Graphs, FactSet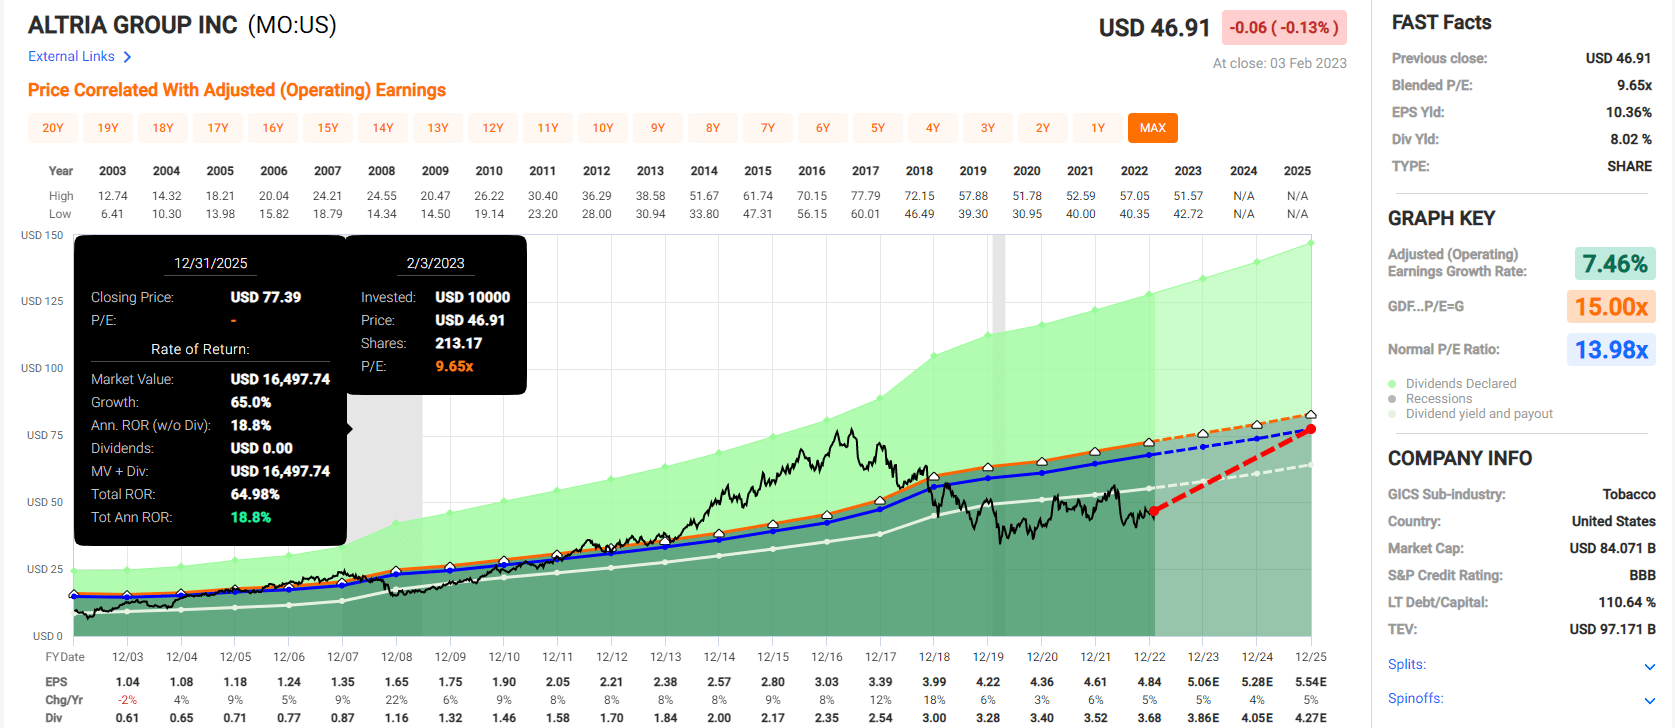
Risk Profile: Why Altria Isn’t Right For Everyone
There are no risk-free companies, and no company is right for everyone. You have to be comfortable with the fundamental risk profile.
MO’s Risk Profile Summary
Investors in tobacco companies should have the stomach for fat-tail risk, particularly those holding shares in a single-market pure play like Altria. Overall, we believe the risk of a significant adverse event is lower than it was one or two decades ago, but the shifting sands of regulation have created some new risks to Altria’s business model in recent years and our uncertainty rating is medium.
Litigation risk still remains, but adverse judgments have been manageable recently. While it is almost impossible to forecast the magnitude of any awards against the tobacco industry, we expect payouts to be within Altria’s annual free cash flow.
The FDA regulates the tobacco industry in the U.S. The recent ban on flavored nicotine liquids demonstrates the FDA is willing to take significant steps to prevent the uptake of nicotine products by new consumers. The menthol cigarette category has had the sword of Damocles hanging over it for several years, although prohibition is yet to come to fruition. We estimate that 20% of Altria’s revenue and operating profit is generated in the menthol category, although it is likely that most menthol volume would switch to non-menthol in the event of a ban. The potential for limits on the nicotine levels in cigarettes is a relatively new risk, with the FDA announcing in the summer of 2017 that it will investigate the potential for nicotine control. We do not believe such controls are a foregone conclusion, however, because it could have unforeseen consequences such as increasing cigarette volumes.
The social impact of tobacco products is rated as a severe risk in Sustainalytics’ ESG risk rating of Altria. We assume a mid-single-digit volume decline rate in the cigarette industry, but we flex this assumption in our scenario analysis to reflect the risk that the decline rate could accelerate. Although the externalities of smoking have largely been internalized, the risk remains of increased taxation and/or operating costs.”– Morningstar (emphasis added).
MO’s Risk Profile Includes
- regulatory risk (plain packaging laws, menthol ban, nicotine level regulation, reduced risk product taxation)
- smoke-free transition execution #1 risk, the whole ball game
- margin compression risk: RRPs could have lower margins than legacy products
- M&A execution risk (Juul and Cronos investments thus far have not gone well)
- labor retention risk (tightest job market in over 50 years).
One of MO’s biggest risks is that it doesn’t scale up reduced-risk product sales as quickly as its peers.
- PM plans 50% of sales from RRPs by 2025
- analysts expect just 14% from MO.
MO also has to contend that the FDA plans to lower nicotine in cigarettes to non-addictive levels and ban menthol.
- BTI thinks this will take until 2027 to be implemented.
In other words, MO needs to accelerate its RRP plans quickly and scale them aggressively if it’s going to achieve the 5% to 6% growth rate analysts currently expect.
How do we quantify, monitor, and track such a complex risk profile? By doing what big institutions do.
Long-Term Risk Management Analysis: How Large Institutions Measure Total Risk Management
DK uses S&P Global’s global long-term risk-management ratings for our risk rating.
- S&P has spent over 20 years perfecting their risk model
- which is based on over 30 major risk categories, over 130 subcategories, and 1,000 individual metrics
- 50% of metrics are industry specific
- this risk rating has been included in every credit rating for decades.
The DK risk rating is based on the global percentile of how a company’s risk management compares to 8,000 S&P-rated companies covering 90% of the world’s market cap.
MO scores 45th Percentile On Global Long-Term Risk Management
S&P’s risk management scores factor in things like:
- supply chain management
- crisis management
- cyber-security
- privacy protection
- efficiency
- R&D efficiency
- innovation management
- labor relations
- talent retention
- worker training/skills improvement
- occupational health & safety
- customer relationship management
- business ethics
- climate strategy adaptation
- sustainable agricultural practices
- corporate governance
- brand management.
MO’s Long-Term Risk Management Is The 344th Best In The Master List 31st Percentile In The Master List)
| Classification | S&P LT Risk-Management Global Percentile |
Risk-Management Interpretation |
Risk-Management Rating |
| BTI, ILMN, SIEGY, SPGI, WM, CI, CSCO, WMB, SAP, CL | 100 | Exceptional (Top 80 companies in the world) | Very Low Risk |
| Strong ESG Stocks | 86 |
Very Good |
Very Low Risk |
| Foreign Dividend Stocks | 77 |
Good, Bordering On Very Good |
Low Risk |
| Ultra SWANs | 74 | Good | Low Risk |
| Dividend Aristocrats | 67 | Above-Average (Bordering On Good) | Low Risk |
| Low Volatility Stocks | 65 | Above-Average | Low Risk |
| Master List average | 61 | Above-Average | Low Risk |
| Dividend Kings | 60 | Above-Average | Low Risk |
| Hyper-Growth stocks | 59 | Average, Bordering On Above-Average | Medium Risk |
| Dividend Champions | 55 | Average | Medium Risk |
| Altria | 45 | Average | Medium Risk |
| Monthly Dividend Stocks | 41 | Average | Medium Risk |
(Source: DK Research Terminal.)
MO’s risk-management consensus is in the bottom 31% of the world’s best blue chips and is similar to:
- Exxon Mobil (XOM): blue-chip aristocrat
- General Dynamics (GD): Super SWAN dividend aristocrat
- Honeywell (HON): Ultra SWAN
- Costco (COST): Ultra SWAN
- Leggett & Platt (LEG): blue-chip dividend king.
The bottom line is that all companies have risks, and MO is average at managing theirs, according to S&P.
How We Monitor MO’s Risk Profile
- 19 analysts
- three credit rating agencies
- 22 experts who collectively know this business better than anyone other than management
- the bond market for real-time fundamental risk assessment.
When the facts change, I change my mind. What do you do, sir?” – John Maynard Keynes
There are no sacred cows at iREIT or Dividend Kings. Wherever the fundamentals lead, we always follow. That’s the essence of disciplined financial science, the math behind retiring rich and staying rich in retirement.
Bottom Line: Despite Rising Challenges, Altria Continues To Deliver For High-Yield Dividend Growth Investors
Let me be clear: I’m NOT calling the bottom in Altria (I’m not a market-timer).
Blue-chip quality and even Ultra SWAN quality do NOT mean “can’t fall hard and fast in a bear market.”
Fundamentals are all that determine safety and quality, and my recommendations.
- over 30+ years, 97% of stock returns are a function of pure fundamentals, not luck
- in the short term; luck is 25X as powerful as fundamentals
- in the long term, fundamentals are 33X as powerful as luck
While I can’t predict the market in the short term, here’s what I can tell you about these this legendary dividend king.
- one of the highest quality and safest 8% yields in the world
- solid growth plans to get beyond tobacco that analysts, rating agencies, and the bond market believes in
- 5% to 6% long-term growth outlook
- 13% to 14% long-term return potential (better than the Nasdaq)
- BBB stable credit rating (7.5% fundamental risk of going to zero over 30 years)
- 45th percentile risk management according to S&P (even with the Juul and Cronos mistakes)
- 33% undervalued (56% upside to fair value).
What if MO’s volume declines continue to accelerate? Then the growth outlook will slow.
What if MO isn’t able to succeed in its smoke-free plans? What if BTI and PM eat their RRP lunch in the US? Then we’ll see that in the data in future earnings.
What if its risk/reward ratio shifts to the downside? Then I’ll tell you, sell MO and shift my high-yield blue-chip bucket to the following allocation.
- 4.2% BTI (up from 3.33% today)
- 4.2% ENB
- 4.2% BAM
- 4.2% NEP.
The point is that there are no sacred cows at Dividend Kings, iREIT, on Wall Street, or in my family hedge fund.
If MO becomes a failed thesis aristocrat, I’ll know it, and you’ll know it too, and I’ll adjust my recommendations (and portfolio) accordingly.
But for now, I can confidently say that all the best data points to one clear thing. Altria remains an 8% yielding rich retirement dream aristocrat that continues to deliver where it counts.
Editor’s Note: This article discusses one or more securities that do not trade on a major U.S. exchange. Please be aware of the risks associated with these stocks.
Be the first to comment