

cemagraphics/E+ via Getty Images
Return on invested capital spiked to the highest level since 1998 for the NC 2000[1] in 1Q22. All eleven sectors in the NC 2000 saw a year-over-year (YoY) improvement in ROIC as well. Most of this improvement comes from higher net operating profit after-tax (NOPAT) margins though invested capital turns rose, too.[2],[3]
This report is an abridged and free version of All Cap Index & Sectors: Inflation Inflates ROICs for 1Q22, one of our quarterly reports on fundamental market and sector trends.
NC 2000 ROIC Rises Year-Over-Year in 1Q22
The NC 2000’s ROIC rose from 7.2% in 1Q21 to 9.3% in 1Q22. The NC 2000’s NOPAT margin rose from 10.4% in 1Q21 to 12.1% in 1Q22 and invested capital turns rose from 0.69 in 1Q21 to 0.77 in 1Q22.
Two key observations:
- Margins are, no doubt, getting an artificial boost from inflation as profits today are based on higher prices for goods sold than the cost of the goods sold. This boost will continue while high levels of inflation persist but will rapidly reverse when inflation slows.
- WACC has increased by less than the yields for AAA corporate bonds. That lag implies companies have shortened the maturities of their outstanding bonds to benefit from the steepness of the yield curve. Shortening maturities might lower the cost of debt and WACC in the near term, but it leaves firms exposed to sharply rising financing costs if interest rates keep rising.
As a result, the “record” return on capital is a bit of a mirage, and the trend in ROIC could reverse soon.
Key Details on Select NC 2000 Sectors
The Energy sector performed best over the past twelve months as measured by change in ROIC, with its ROIC rising over 720 basis points. Given the impact COVID-19 had on energy companies and energy prices in 2020 and the strength of the rebound, this trend is not surprising.
On the flip side, the Telecom Services sector, at only 3 basis points, saw the slightest YoY improvement in ROIC over the past twelve months.
Overall, the Technology sector earns the highest ROIC of all sectors, by far, and the Utilities sector earns the lowest ROIC.
Below, we highlight the Technology sector, which has highest ROIC in the NC 2000.
Sample Sector Analysis: Technology
Figure 1 shows the Technology sector ROIC rose from 18.1% in 1Q21 to 20.9% in 1Q22. The Technology sector NOPAT margin rose from 17.4% in 1Q21 to 18.6% in 1Q22, while invested capital turns rose from 1.04 in 1Q21 to 1.12 in 1Q22.
Figure 1: Technology ROIC vs. WACC: Dec 1998 – 5/16/22
NC 2000 Technology Sector ROIC & WACC Since 1998 (New Constructs, LLC)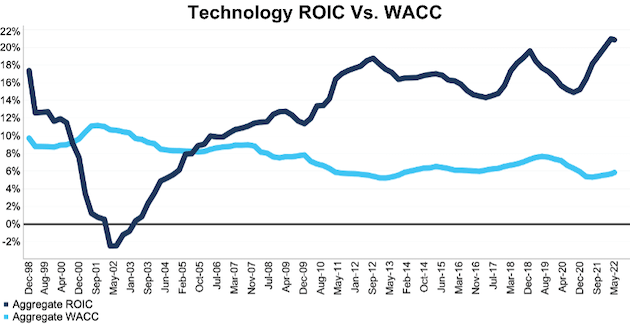
Sources: New Constructs, LLC and company filings. The May 16, 2022 measurement period uses price data as of that date for our WACC calculation and incorporates the financial data from 1Q22 10-Qs for ROIC, as this is the earliest date for which all the 1Q22 10-Qs for the NC 2000 constituents were available.
Figure 2 compares the trends in NOPAT margin and invested capital turns for the Technology sector since December 1998. We sum the individual NC 2000/sector constituent values for revenue, NOPAT, and invested capital to calculate these metrics. We call this approach the “Aggregate” methodology.
Figure 2: Technology NOPAT Margin Vs. IC Turns: Dec 1998 – 5/16/22
NC 2000 Technology Sector NOPAT Margins & Invested Capital Turns Since 1998 (New Constructs, LLC)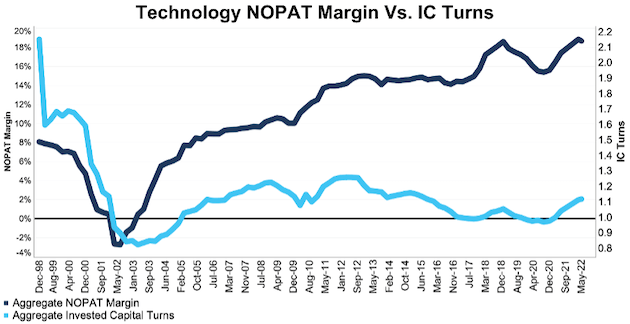
Sources: New Constructs, LLC and company filings. The May 16, 2022 measurement period uses price data as of that date for our WACC calculation and incorporates the financial data from 1Q22 10-Qs for ROIC, as this is the earliest date for which all the 1Q22 10-Qs for the NC 2000 constituents were available.
The Aggregate methodology provides a straightforward look at the entire sector, regardless of market cap or index weighting and matches how S&P Global (SPGI) calculates metrics for the S&P 500.
For additional perspective, we compare the Aggregate method for ROIC with two other market-weighted methodologies: market-weighted metrics and market-weighted drivers. Each method has its pros and cons, which are detailed in the Appendix.
Figure 3 compares these three methods for calculating the Technology sector’s ROICs.
Figure 3: Technology ROIC Methodologies Compared: Dec 1998 – 5/16/22
NC 2000 Technology Sector ROIC Analysis Since 1998 (New Constructs, LLC)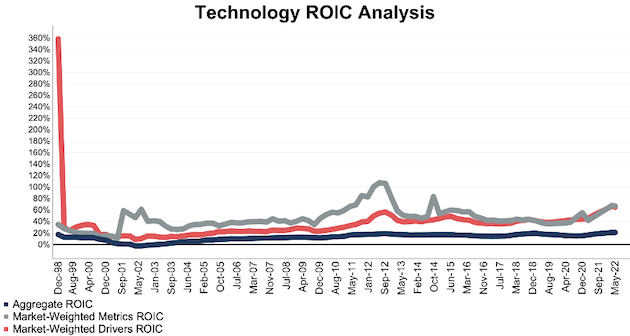
Sources: New Constructs, LLC and company filings. The May 16, 2022 measurement period uses price data as of that date for our WACC calculation and incorporates the financial data from 1Q22 10-Qs for ROIC, as this is the earliest date for which all the 1Q22 10-Qs for the NC 2000 constituents were available.
This article originally published on June 2, 2022.
Disclosure: David Trainer, Kyle Guske II, and Matt Shuler receive no compensation to write about any specific stock, style, or theme.
Appendix: Analyzing ROIC with Different Weighting Methodologies
We derive the metrics above by summing the individual NC 2000/sector constituent values for revenue, NOPAT, and invested capital to calculate the metrics presented. We call this approach the “Aggregate” methodology.
The Aggregate methodology provides a straightforward look at the entire sector, regardless of market cap or index weighting and matches how S&P Global calculates metrics for the S&P 500.
For additional perspective, we compare the Aggregate method for ROIC with two other market-weighted methodologies:
- Market-weighted metrics – calculated by market-cap-weighting the ROIC for the individual companies relative to their sector or the overall NC 2000 in each period. Details:
- Company weight equals the company’s market cap divided by the market cap of the NC 2000/its sector
- We multiply each company’s ROIC by its weight
- NC 2000/Sector ROIC equals the sum of the weighted ROICs for all the companies in the NC 2000/each sector
- Market-weighted drivers – calculated by market-cap-weighting the NOPAT and invested capital for the individual companies in the NC 2000/each sector in each period. Details:
- Company weight equals the company’s market cap divided by the market cap of the NC2000/its sector
- We multiply each company’s NOPAT and invested capital by its weight
- We sum the weighted NOPAT and invested capital for each company in the NC 2000/each sector to determine the NC 2000/sector’s weighted NOPAT and weighted invested capital
- NC 2000/Sector ROIC equals weighted NC 2000/sector NOPAT divided by weighted NC 2000/sector invested capital
Each methodology has its pros and cons, as outlined below:
Aggregate method
Pros:
- A straightforward look at the entire NC 2000/sector, regardless of company size or weighting.
- Matches how S&P Global calculates metrics for the S&P 500.
Cons:
- Vulnerable to impact of by companies entering/exiting the group of companies, which could unduly affect aggregate values despite the level of change from companies that remain in the group.
Market-weighted metrics method
Pros:
- Accounts for a firm’s size relative to the overall NC 2000/sector and weights its metrics accordingly.
Cons:
- Vulnerable to outsized impact of one or a few companies, as shown below in the Consumer Non-cyclicals sector. This outsized impact tends to occur only for ratios where unusually small denominator values can create extremely high or low results.
Market-weighted drivers method
Pros:
- Accounts for a firm’s size relative to the overall NC 2000/sector and weights its NOPAT and invested capital accordingly.
- Mitigates potential outsized impact of one or a few companies by aggregating values that drive the ratio before calculating the ratio.
Cons:
- Can minimize the impact of period-over-period changes in smaller companies, as their impact on the overall sector NOPAT and invested capital is smaller.
[1] The NC 2000 consists of the largest 2000 U.S. companies by market cap in our coverage. Constituents are updated on a quarterly basis (March 31, June 30, September 30, and December 31). We exclude companies that report under IFRS and non-U.S. ADR companies.
[2] We calculate these metrics based on SPGI’s methodology, which sums the individual NC 2000 constituent values for NOPAT and invested capital before using them to calculate the metrics. We call this the “Aggregate” methodology.
[3] Our research is based on the latest audited financial data, which is the 1Q22 10-Q in most cases. Price data is as of 5/16/22.
Be the first to comment