

RichVintage/E+ via Getty Images
Introduction
I use atypical investing approaches. This often leads to me writing atypical investing articles. This article will be no exception. Typically, stock investment commentary is divided into two categories. One category focuses on macroeconomic conditions. The people who study these conditions and trends are usually referred to as strategists. And another group focuses on the stocks of individual businesses. The people who study these are usually referred to as analysts. My approach blends these two categories together into a hybrid approach that is not easily categorized.
Sometimes I start with the broad macro and political conditions and that tells me something about the wider business environment, while other times I start with individual stocks and the patterns I see there tell me something about the macro environment. Both approaches can be useful at different times.
As a writer and commentator about the stock market, generally speaking, I don’t find 90% of macroeconomic commentary particularly useful for the individual stock investor. The reason for that is usually these articles tend to be broad prognostications that don’t contain any real actionable information for individual stock investors. Because of this, as a writer, I prefer to use examples of individual stocks that represent broader patterns within the market. My view is that if readers can learn these basic principles and patterns as demonstrated with an individual stock, then they can apply those principles to other stocks that have a similar profile. That said, I think stock analysts that only focus on the individual stocks and totally disregard the macro are making a mistake as well. It’s very important for investors to have a rough understanding of where we are in the business cycle and economic cycle, and how government policy could affect businesses because many stocks are extremely sensitive to these conditions. So, investors need to both understand broad cycles and also how individual stocks relate to them if they wish to avoid big investing mistakes and achieve above average returns.
In keeping with my preferred article format, today I’m going to use Align Technology (NASDAQ:ALGN) as a prime example of several investing lessons that can be more broadly applied beyond Align itself. As part of this article, I’ll also explain how I am currently valuing ALGN, and what I would like to see happen before I buy the stock during the current downcycle.
Lesson #1: Dividend records and name recognition are not important if earnings growth is good
I first purchased Align Technology on 3/19/20, near the bottom of the COVID crash. I wrote about the purchase publicly several weeks later in my May 2020 article “Stocks I Bought On The Dip: Align Technology“. I sold Align just four months later on 7/30/20, and wrote about that sale as well in my article “My Process For Taking Profits In Align Technologies“. (Read those articles in order to understand both my buying and selling process at the time.) My returns over those 4 months were very good:
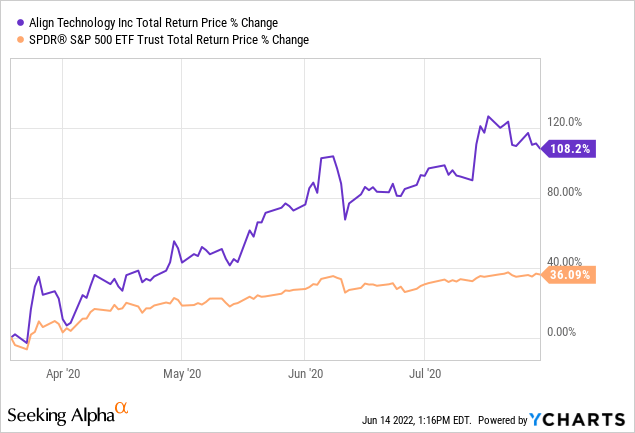
I had more than a double in absolute returns and roughly tripled the return of the S&P 500 if it was held over the same time period.
One of the interesting patterns I noticed during the March 2020 sell-off was that many of the stocks that I purchased did not meet three criteria that are popular with other investors. Many of the stocks I bought at the time either did not pay dividends, were not household name brands, and/or they did not have very large market caps. However, they were all reasonably high quality and had strong earnings growth histories.
My working theory for these stocks selling off to buyable levels when larger, more well-known stocks didn’t in March of 2020 is that there are so many boomers in or nearing retirement in a low-bond-yielding environment, that over the past 10 years, high-quality, large-cap, name-brand stocks that have a long history of paying dividends have become very popular. This has caused the stocks that fit into this category to trade at premium prices in the market, thereby lowering their long-term returns. While that has been good for investors who have owned these stocks for a very long time, it is not good for investors looking to put cash to work today. The likely future returns of the high-quality and most well-known dividend stocks are extremely low today in my view, and even during the March 2020 sell-off, few, if any of those popular stocks fell to prices that I thought would produce above-average, dependable, long-term returns.
The stocks that did tend to fall to buyable levels in March of 2020 tended to still have the same earnings quality profile, but what they tended not to have was long-term dividend records, large market-caps, and/or extremely well-known name recognition. Align didn’t fit any of these categories even though it had a history of growing earnings at 20% or more leading up to the pandemic. And it was these types of stocks, generally speaking, that sold off deep enough to buy in March of 2020.
Many other stocks I bought in March of 2020 didn’t fit into the popular categories as well. Stocks like FLIR, Eaton Vance, Microchip Technologies (MCHP), Texas Roadhouse (TXRH), Hologic (HOLX), Ozark Bank (OZK), UMB Financial (UMBF), Ameriprise Financial (AMP), Cantel Medical, Kennametal (KMT), Astec Industries (ASTE), and Sysco (SYY). All of these returned roughly 100% or more returns for me and I’ve taken profits in all of them already. I also still own Tractor Supply (TSCO) which is up nearly 200%, and AutoZone (AZO), which doesn’t pay a dividend even though it is well-known, and is up 175%, and these were bought during the March 2020 sell-off as well. While some of these stocks are in the S&P 500, they are far lesser-known than the high-quality dividend and brand name favorites that never fell low enough to buy during the March sell-off. Yet they have all provided market-beating returns. Align Technology was one of these stocks.
The lesson here is that quality earnings growth purchased at a good price is more important than market cap, brand name, or dividend history when it comes to producing above-average returns. It would take a 3-4% yielding dividend stock growing at a decent rate 20 years to pay you the amount of money these stocks produced for me in less than 2 years.
#2: Medium-term earnings are more predictable than short-term sentiment
Investors who have owned Align stock for a while are aware that it has experienced a pretty significant boom and bust over the past two years. After I took profits in Align at the end of July 2020 based on valuation, the stock price continued to rocket higher:
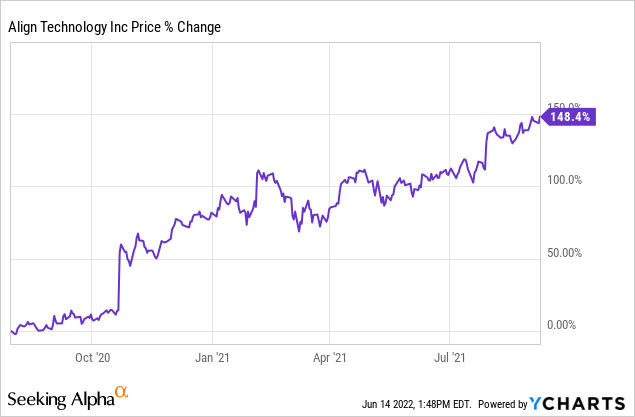
The stock price rose an additional +150% over the next year after I had taken profits. I took profits in Align after I had roughly doubled my money, but if I had waited and sold near the very top, I could have had a +400% return. This raises the question of whether I made a mistake when I sold my stock.
For what it’s worth, I don’t think I did. I purchased Align mostly based on its future earnings expectations, as well as historical mean reversion. It was identified as a “buy” because of a valuation process. When I sold Align a few months later, I was simply using the very same process. I use that process not because it is always 100% correct over the short-term (which I generally consider being two years or less), but because I know that over the medium-term, within 2-5 years I have about an 85% to 90% success rate of producing positive returns on any given investment using this strategy. Likewise, the vast majority of the time, I know that when I take profits in an expensive stock, as I did with Align in July of 2020, usually it underperforms the market over the medium-term, and often it will produce negative returns. At the time I sold, I had already nearly tripled the return of the S&P 500, produced over a 300% annualized return, and more than doubled my money in absolute terms. I had to trust my process.
If I had held onto Align for longer, I would not have had a process in place to signal to me when I should sell the stock. It would have been total guesswork, and there was no guarantee the stock would keep rising. When I sold it there were no COVID vaccines yet, a second COVID wave was coming that fall, and there was no more stimulus money coming, either. There wasn’t any macro reason to think that the stock should go higher and stay there. All those reasons would come later.
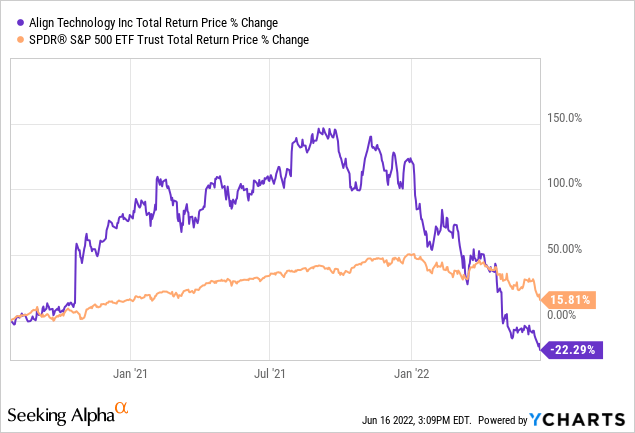
Above is a chart of Align’s returns since I sold compared to the S&P 500 though today. Align is down nearly -22% and SPY is up around +15%. I didn’t know if or when this would happen, but I knew that Align’s long-term earnings pattern did not support continuing to hold the stock when I sold it.
Ultimately, once we get into the 2-5 year range in the future, it’s the earnings trend that typically determines the price of the stock. And for most businesses that I consider buying, conditions exist in the real world that allows a business to relatively consistently produce a certain amount of earnings. And while these conditions are always changing, they usually don’t change super fast. This creates some limits both on the top and bottom ends of expectations that can be reasonably estimated, and that’s what I do. We are now seeing this play out in practice with Align stock.
The main lesson here is to understand what is predictable and what isn’t. I couldn’t predict the additional +150% rise in Align’s stock price after I sold it, but I could predict the decline the stock is currently experiencing because there are limits to how much a business like this can earn over a given time period.
There is an important caveat to this, however, which I will cover in the next lesson.
#3: Booms are followed by busts
FAST Graphs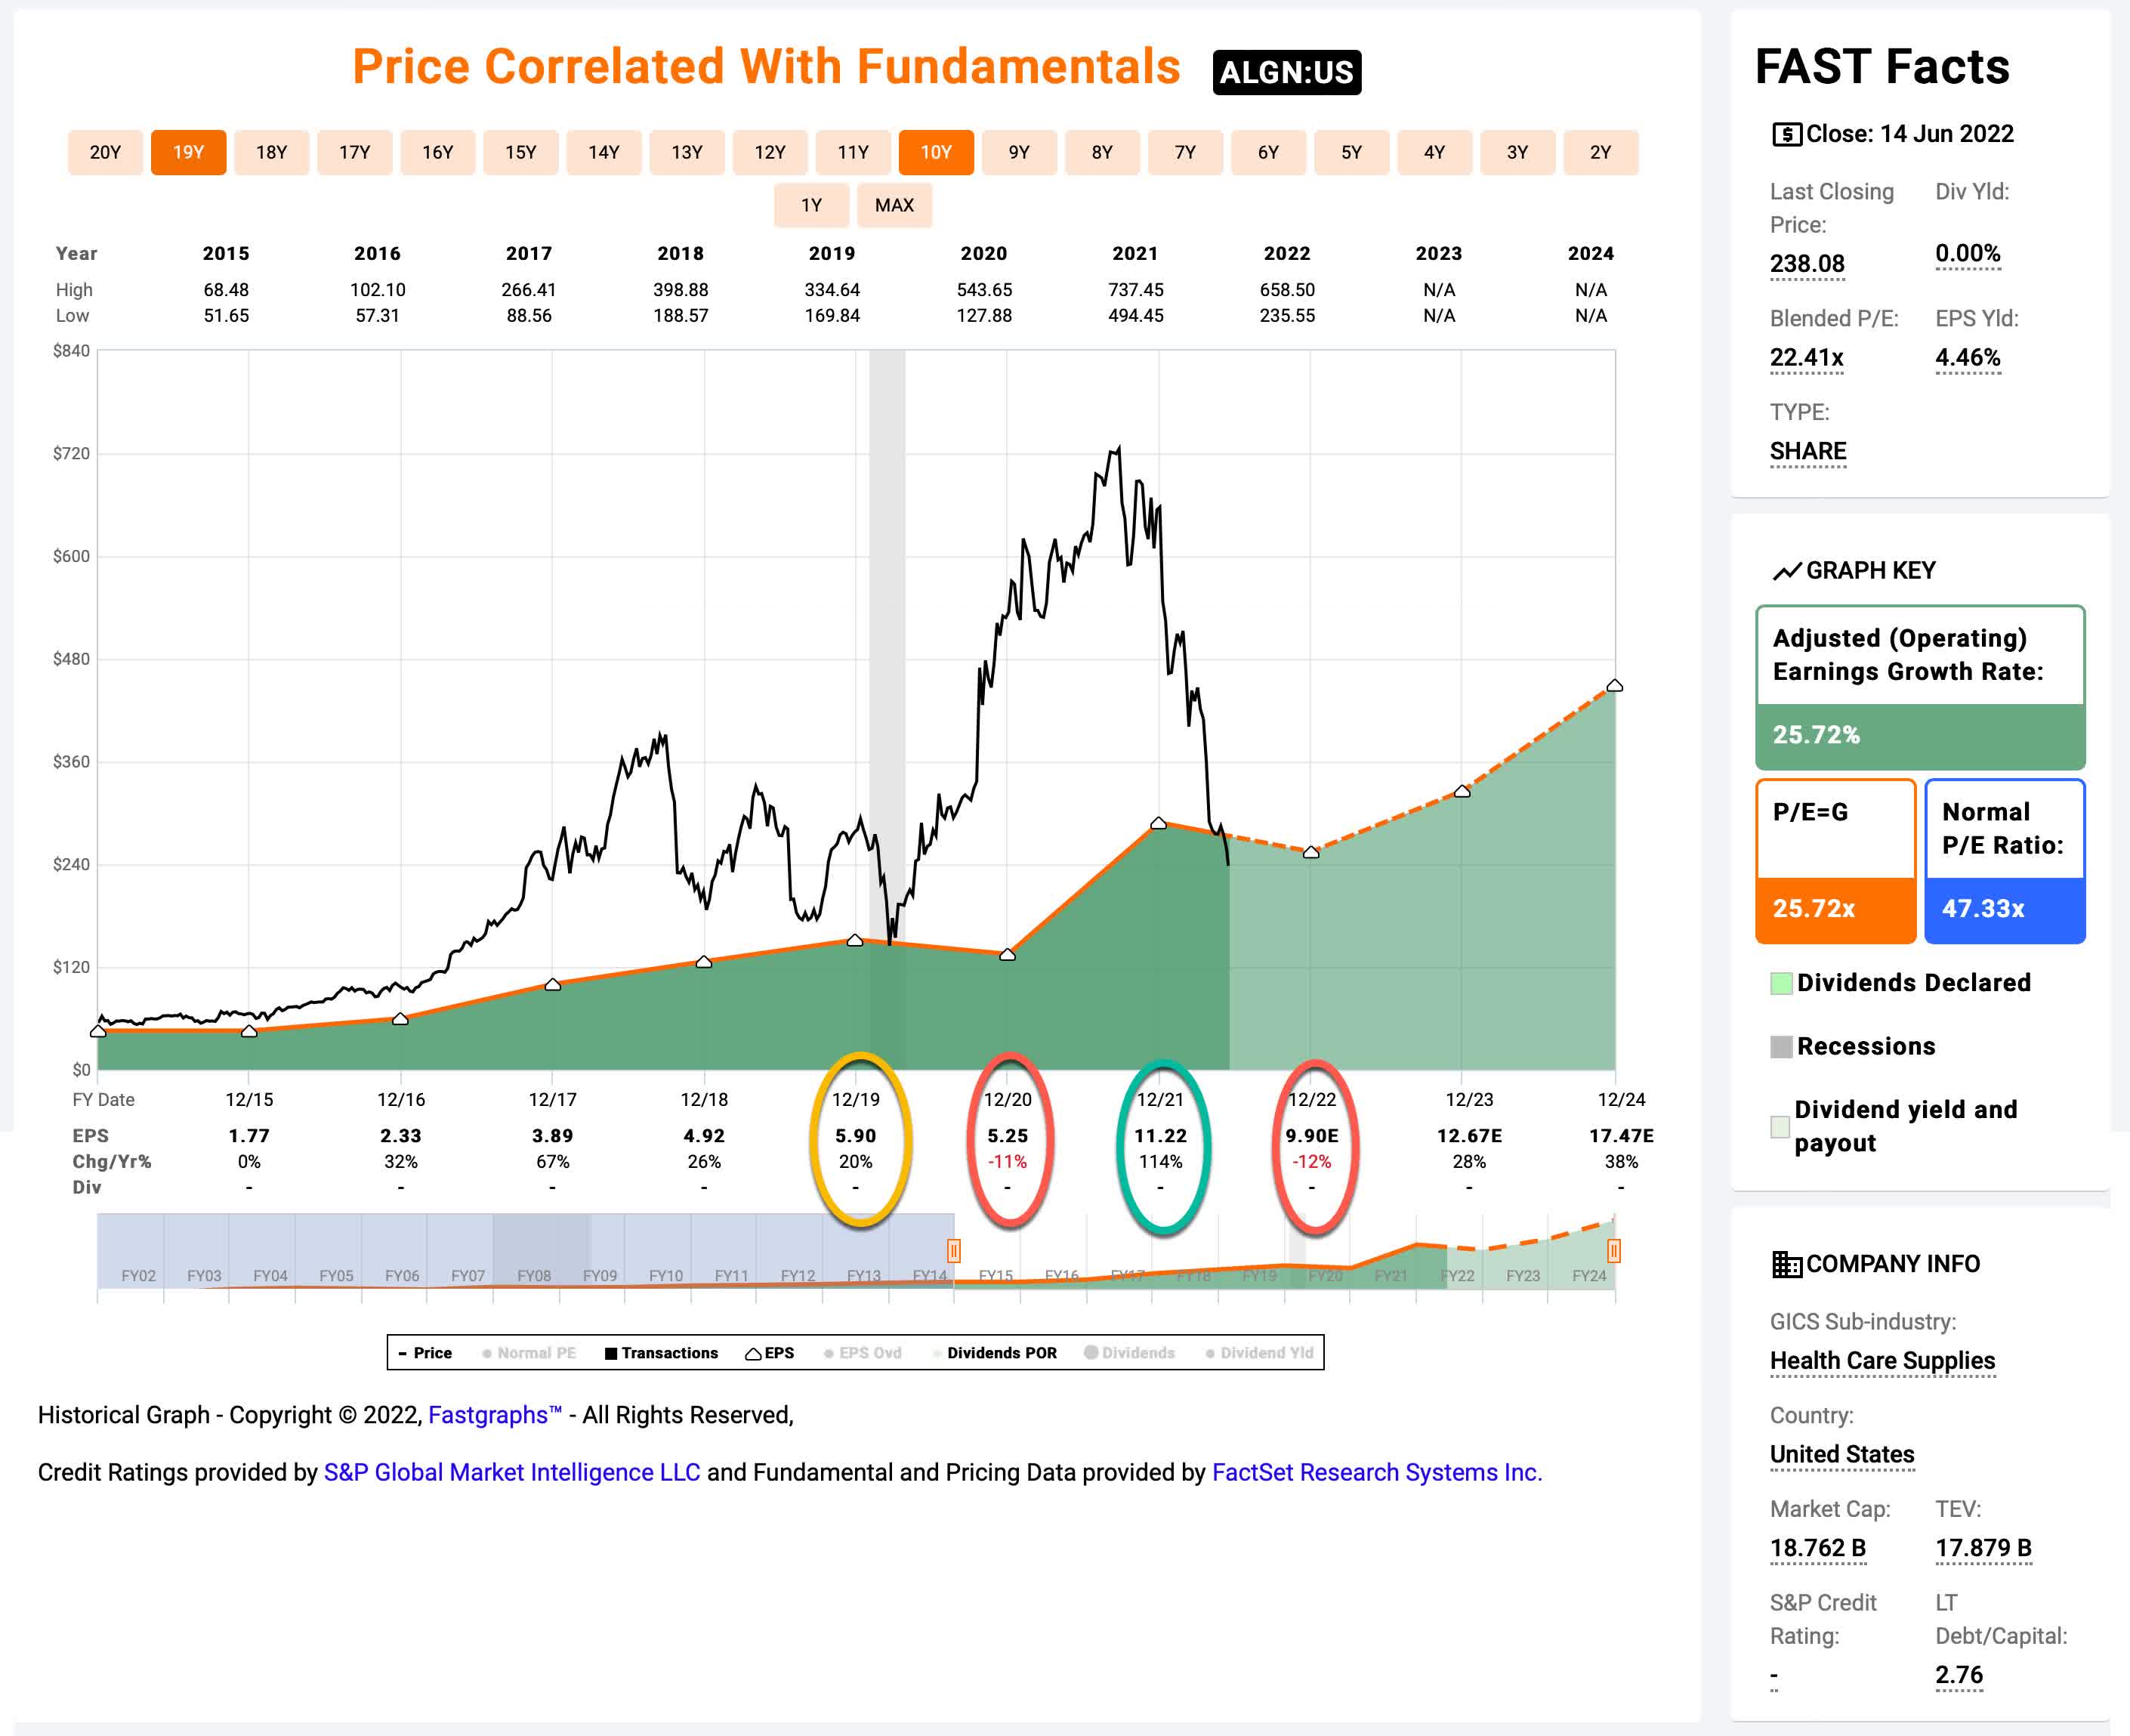
One of the underlying assumptions I make when I analyze a stock using this method is that there is some underlying demand for the company’s products in the market and they are likely to grow at some roughly estimable rate over the medium term. In Align’s case, I assumed that they could probably grow 2019’s earnings of $5.90 per share at 20% over the next decade, and that estimate is what I based both my initial purchase price and my eventual selling price on. Align became a value because the market in March of 2020 did not think they could achieve those estimates. And, indeed, over the short term, the market was correct. In 2020 Align’s EPS fell -11%. Interestingly, after vaccine development and two additional rounds of government stimulus and an accommodative central bank, in 2021, Align’s EPS dramatically surpassed my estimates of 20% average growth and earnings grew a whopping +114%. In this respect, at least over the short term, when the market sent Align’s price much higher after I sold it, the market was not being completely irrational. Earnings growth was phenomenal. But, the market was being irrational when it priced the stock as if that level of earnings growth would last for a very long time.
I have written about this dynamic and warned investors a lot about it this year, but because the economic stimulus was abruptly cut off in January of this year, it basically ensured that the stimulus boom would be followed by a “bust”. I laid out my case publicly about this starting in January of this year, but most clearly in my February article “Apple & Alphabet Will Not Side-Step A Deep Bear Market“. When earnings jump over 100% for a business in one year and the business isn’t typically deeply cyclical in nature, and then the money that funded that EPS jump is cut off, bad things happen. Now, this year Align’s EPS is expected to fall -12%.
The main lesson here has to do with only narrowly focusing on a single business. Investors who did that with Align last year had very good current fundamentals to justify (at least to some degree) buying or holding Align’s stock. Earnings growth was fantastic after all. In order to more clearly understand the boom/bust danger, they needed to zoom out and look at the bigger picture and understand the macro-environment in which this was taking place was temporary. A great deal of this was very predictable and clear for everyone to see at least as early as January of this year when I started writing about it.
#4: Medium-term is the best valuation time frame to use for fundamental analysis
The fourth lesson or takeaway from Align is that one’s time frame really matters when performing fundamental-based analysis. My experience is that very short time-frames of less than 2 years and very long time-frames of more than 10 years, do not work well because over the short-term sentiment is hard to predict (as we have seen with Align) and over the very long term, earnings are hard to predict (because changes happen to the business environment). For me, at least, the medium-term is the sweet spot where sentiment often meets reasonably predictable fundamentals.
One way to see this is to look at Align’s actual collective three-year earnings for 2020, 2021 and 2022’s estimates, and to compare them to my basic expectation of 20% EPS growth off $5.90 of earnings in 2019.
| Year | Cory’s EPS Estimates | Actual + 2022 Analysts’ Estimates |
| 2020 | $7.08 | $5.25 |
| 2021 | $8.50 | $11.22 |
| 2022 | $10.20 | $9.90 estimate |
| Total | $25.78 | $26.37 |
Just glancing at this we can see that 2021 probably partially made up for lost earnings in 2020 and also partially pulled forward some earnings from 2022. And if 2022’s actual earnings come up just a little bit short of expectations, they will be right in line with the estimates I used back in March of 2020 for this 3-year period. Over the medium term, this is what tends to happen with most steady-earning stocks, they revert to their average earnings trends.
I couldn’t predict what would happen over the short term of less than 2 years, and I don’t think I can predict what will happen 15 or 20 years into the future for this business. But I can often get pretty close over that 2-5 year window, sometimes stretching as far as 10 years. And over time, the price will almost always align itself with earnings and earnings growth expectations so if you get those right over the medium term you can make pretty good stock price predictions.
#5: Fast-Growth businesses eventually experience P/E multiple compression
So far, in this article, I have used examples and patterns from the past to illustrate my points. In this section, I will look forward. There is an important understanding that all fundamentally based investors should understand, and that is it is extremely difficult for a business to grow earnings by more than 20% each year for a very long period of time. Eventually, growth businesses grow all that they can. And that’s okay. At that point, they can return money to shareholders via dividends or develop other products and services. But as investors, we have to be aware that stocks will almost never trade at P/E ratios over 30 for very long periods of time. So, if we have a stock like Align where I assume 20% earnings growth and it has traded at an average P/E ratio of 47 since 2015, we should not assume that it will ever trade at a 47 P/E ratio ever again. It might. But we should not count on it if we are deciding whether to invest today.
If you read my other two Align articles, you’ll see that part of my process involves assuming a P/E mean reversion. If I were to assume that Align would at some point over the next 10 years revert to a 47 P/E, then Align would be a strong buy at today’s price. However, fast-growth stocks almost always go through multiple compression at some point because earnings growth cannot keep growing at 30%+ forever, it makes sense to set this part of my standard analysis off to the side and not use it to estimate Align’s value today.
I have found it’s important to do two things when it comes to fast-growth stocks (I consider “fast” as EPS growth greater than 20%). The first is even if EPS is growing faster than 20% at the current point in time, never assume as part of the valuation process it will grow consistently at more than 20% for 10 years. 20% growth is my maximum assumption. Right now analysts think ALGN will grow 2023 earnings at 28% and 2024 earnings at 38%… and Align very well might do that. But I assume that if they do, perhaps in year 5 or 6 or 7 into the future they might only grow at 15% or 10%. So, when I calculate a very long-term average, it has a reasonable chance of coming close to my estimate of 20% even if the early years are faster than that.
The second thing is to be aware that average P/E ratios cannot sustain at 40 or 50 or 60, so there comes a point where we should not assume they will revert that high. Sure, in the early stages of a growth company, it might make sense if the stock has a deep and quick sell-off that one day it could trade at a high multiple again, but we should always be on watch for a company maturing, and we should always ask the question if it’s reasonable to assume the P/E will revert that high. And in Align’s case, I think it’s much more reasonable to assume it probably will not, particularly given the macro environment of rising interest rates.
When to potentially buy Align during this downturn?
There are two important factors that I care about when it comes to potentially buying Align stock again. The first is how much in earnings they are likely to produce over the next decade. The second, because we are likely entering a deep bear market and a recession, is what sort of discounted price the market might give me. So, I want to make sure I’m buying at a price I’ll get an adequate return, and I also want to maximize that return to the degree that actually has a high probability of occurring.
FAST Graphs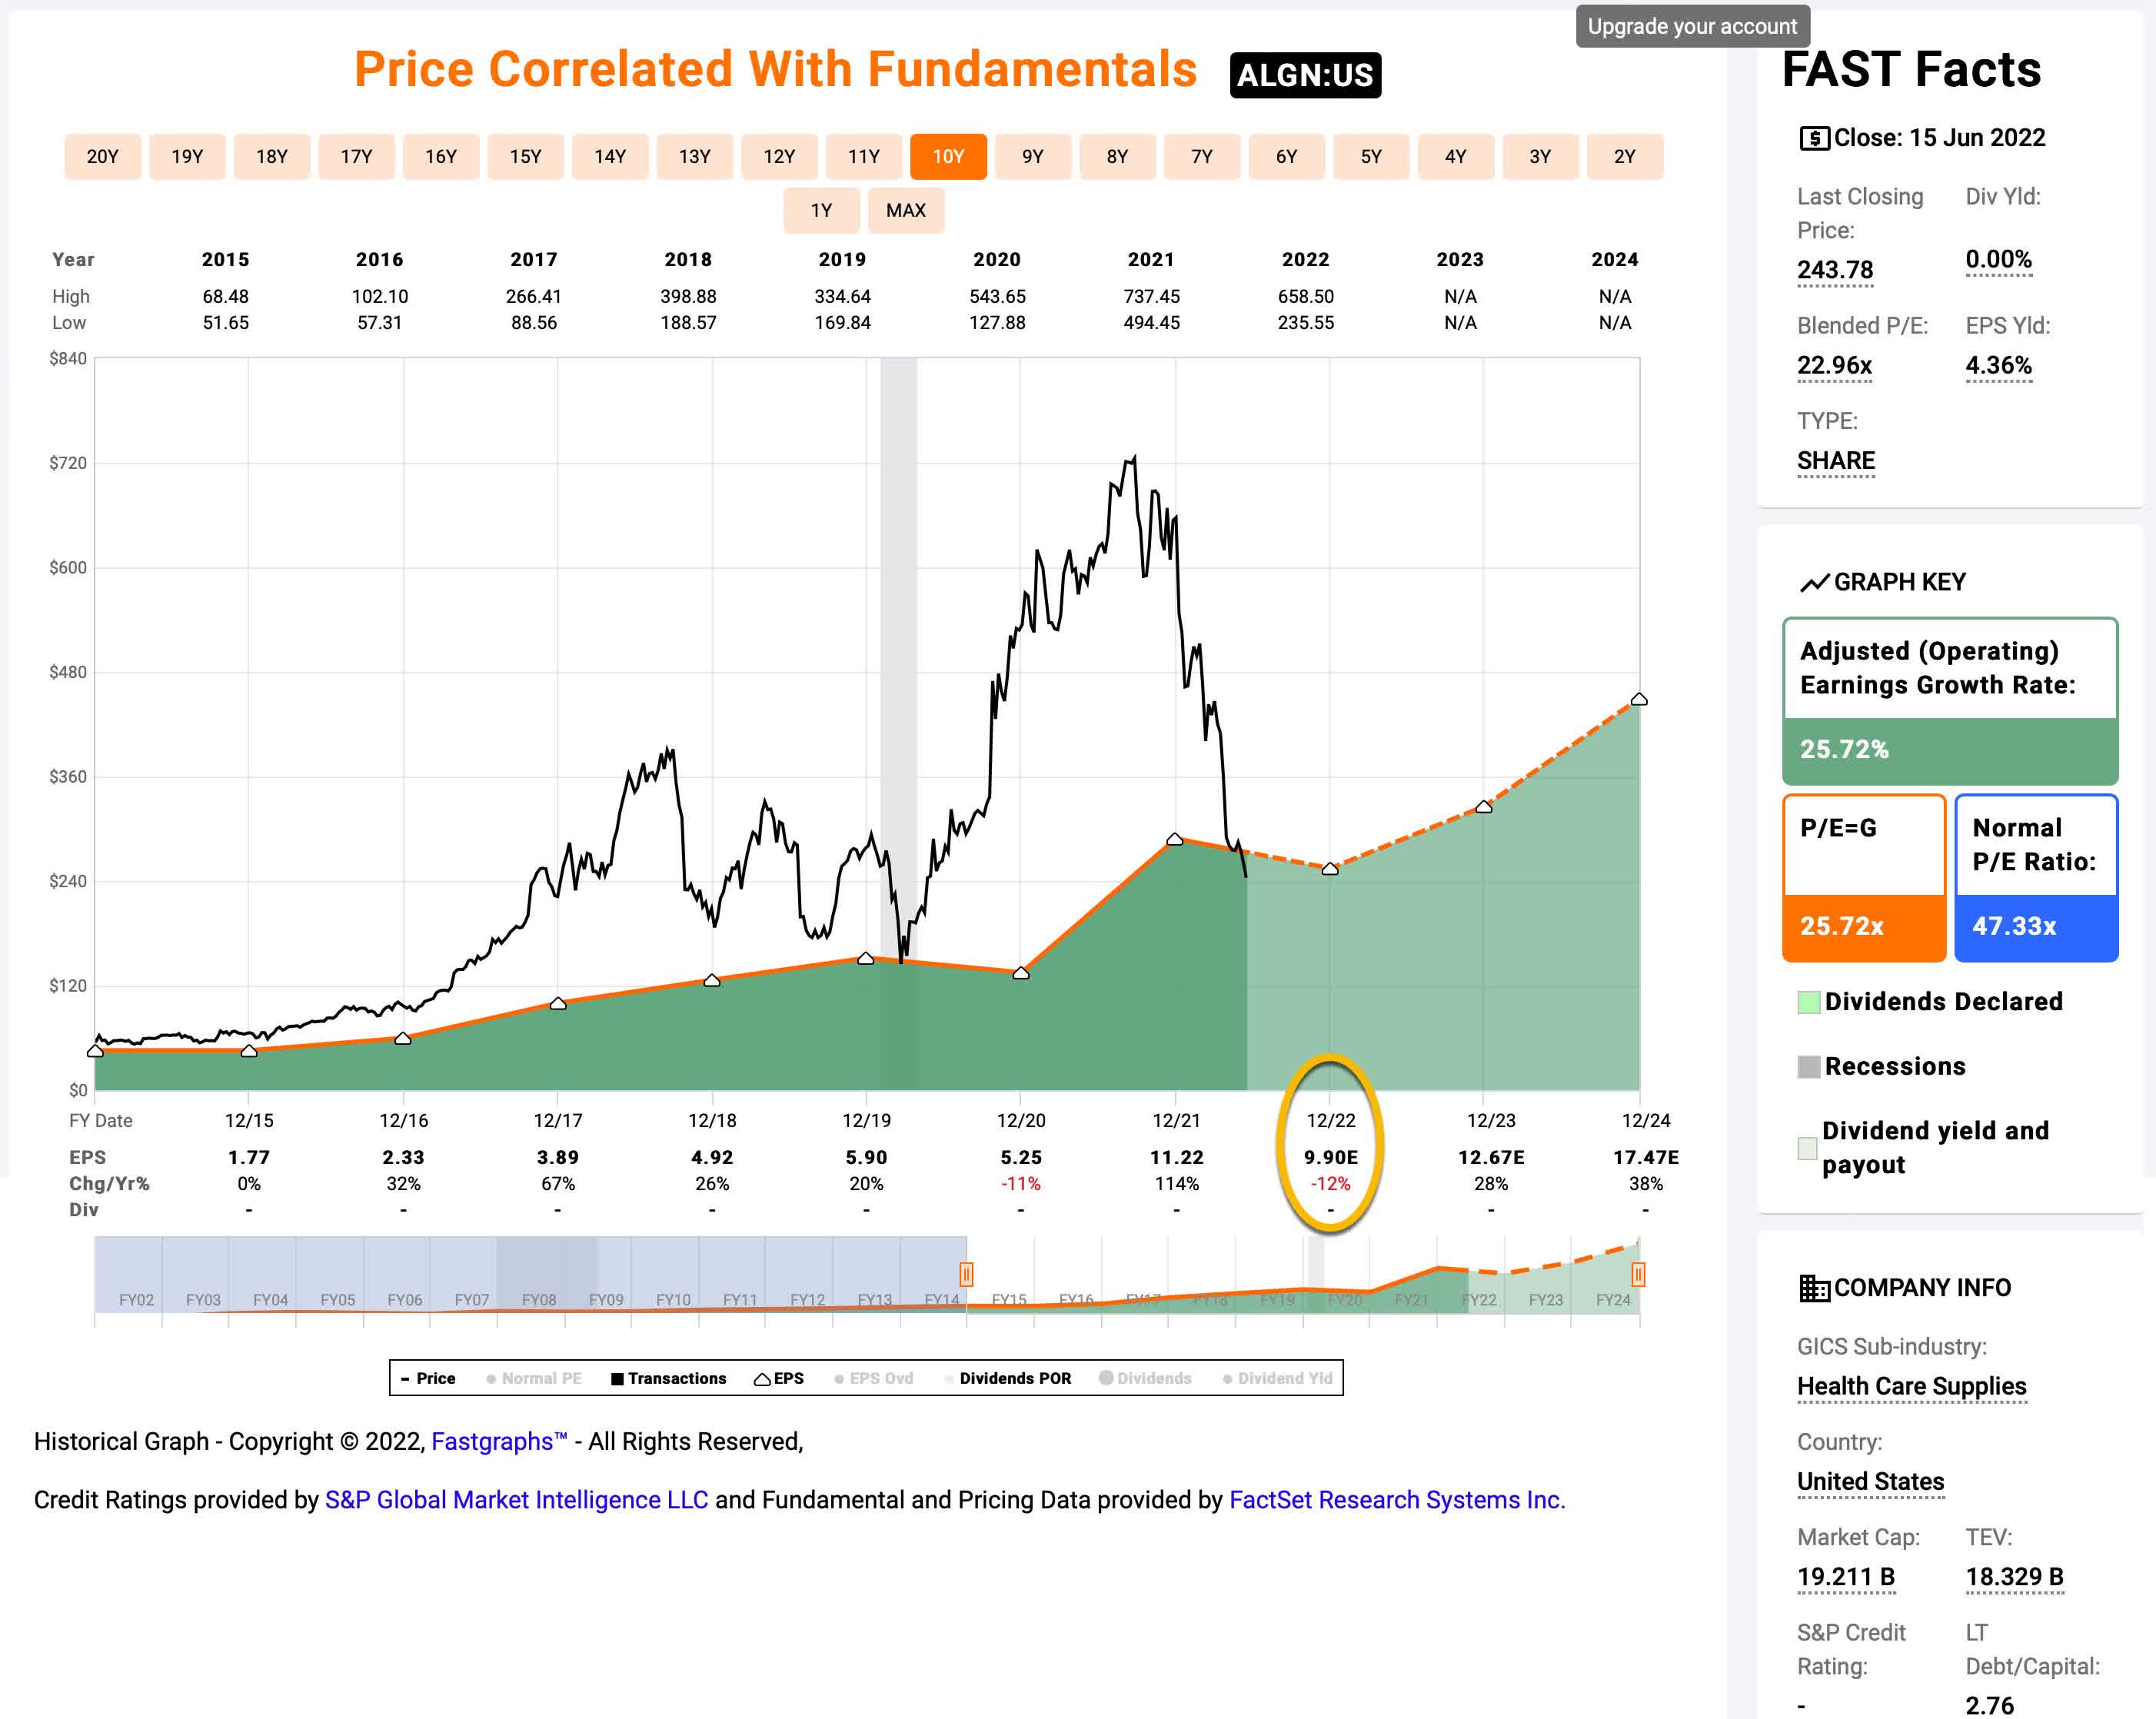
In order to estimate Align’s future 10-year earnings CAGR, I take their current forward earnings estimate of $9.90, along with their price (as I write this, it’s $231.20) and produce an earnings yield (an inverted P/E ratio, so the E/P ratio). When I do that, I get an earnings yield of +4.33%. Next, I want to know the earnings growth from 2015 through 2022 (controlling for buyback and negative growth years like 2020 and 2022). When I estimate that earnings growth rate I get exactly 24%. But, as I noted earlier in the article, I always limit my long-term earnings growth expectations to 20% so that I have a margin of safety, so 20% is what I will assume for this analysis.
The way I like to think about this is if I bought Align’s whole business for $100, it would pay me $4.33 per year and that amount would grow at 20% every year. What I want to know is if I pulled forward the first year’s earnings how much money would I collect after 10 years if I kept all the earnings for myself. And I calculate that after 10 years, including my initial $100, I would have $234.66. When I put that into a CAGR calculator I get a 10-Year CAGR expectation of +8.90%. My typically buying threshold when only using business earnings as I am here is above a 9% CAGR is a buy, so Align is basically right at my normal buying threshold here.
However, because we are likely going into a recession, and the price is likely to drop lower from here (especially if earnings disappoint) I add an additional factor that I call the “Recession P/E” into the mix. This factor is the monthly average P/E that the stock has experienced during past recessions. Align is a little different than most stocks because its low P/E actually came a little bit after the 2008/9 recession. It occurred in September of 2011 and the low P/E that month was 16.19. Since Align’s current P/E is 23.13, assuming the earnings stay the same, the price would need to drop about -30% for it to produce that recession P/E, and if that happened then I would be willing to buy the stock again.
That buy price, if the earnings estimates hold, would be about $161 per share. The stock bottomed at about $128 per share in March of 2020, and they’ve grown earnings an average of about 20% per year for three years since then, so $161 seems like a reasonable entry point that also has a pretty good chance of hitting. It’s possible that buy price could go lower if earnings estimates disappoint over the next few months, so that’s probably the highest price I would be willing to pay between now and February of next year when we have more clarity on the nature of the current bear market and possibility of a recession.
Conclusion
I told you this would be an unusual article. I didn’t even mention what it is that Align does. The reason for that is because it doesn’t matter that much. What matters is 1) how cyclical their earnings have been historically (not very cyclical in this case), and 2) how much money they are likely to make over time. I listed a lot of the stocks I bought during the March 2020 sell-off that produced great returns. It’s not an exclusive list, but notice the wide variety of businesses that were represented there. I am not an expert in any one of those industries. My method is to understand historical earnings patterns and then use that information to predict future earnings and prices for stocks. I have a very high success rate, but about 1 in 5 investments don’t work out very well. I don’t know which ones they will be, but I do know the overall outcomes I’ve historically had. So, the way I make up for my lack of deep work on individual businesses is to take small, 1% equally-weighted positions, never more than 2% weighted. It’s possible that even though I’ve had success with Align stock in the past that something comes up in the future and the investment doesn’t work out. That’s okay, as long as I have other investments to make up for that loss. I wouldn’t recommend using my method of investing for heavily weighted positions. For that, I suggest doing much deeper work.
Hopefully, you found some useful investing principles in this article that you can apply to similarly situated stocks, and these methods help you to find quality stocks when they are trading at good prices. Best of luck!
Be the first to comment