

William_Potter/iStock via Getty Images
Thesis
My last comparison article on Alibaba Group Holding Limited (NYSE:BABA, OTCPK:BABAF) and JD.com, Inc. (NASDAQ:JD) was co-produced with Sensor Unlimited and published back in May 2022. That article focused on the similarities and differences in their business fundamentals and the megatrend in the Asian-Pacific regions.
In this article, I want to compare them again, but from a completely different angle and for a completely different purpose. This time, I want to compare them to address many of the risks facing BABA. Some of these risks have been often mentioned by BABA bears (like the “China risk”), while some of them are less mentioned (like BABA’s profitability sustainability and platform role). All these risks are 100% valid to me. So, the point of this article is not to prove the bears to be wrong. To the contrary, their concerns are 100% valid to me. I am here to hear them out and provide my thoughts so both bulls and bears can all make informed decisions.
After all, the hallmark of a first-rate mind is the ability to hold conflicting views at the same time without losing the ability to act.
And we will start with the elephant in the room first – the “China Risk.”
The China risk
The implied argument here is that the BABA thesis does not depend much on its business fundamentals. Instead, the Chinese government (or the CCP, or the VIE structure, et al) is a central part (or even all) of the thesis.
As just mentioned, it is a 100% valid argument to me, and I am not here to dismiss it or prove it wrong. I am here to provide my perspective for a full view. And I invite BABA investors or potential BABA investors to consider the following aspects.
First, I feel the argument is border-lining a political or ideological discussion. Not say political or ideological considerations are not important in investment decisions – to the contrary, they are very important. However, they are difficult to quantify. To me, investing is pretty much all about PRICING risks. It is hard to put a price tag on risks that you cannot quantify. As such, I won’t dwell more on this issue here myself. I recommend Ray Dalio’s recent book entitled “Principles for Dealing with the Changing World Order” for readers who are interested in his view on politics and ideologies. I feel he has deeper insights about China than most Chinese themselves. And, of course, he understands the West deeper than most westerners too. A few quotes from his book are provided below:
- “I urge those of you who have not spent considerable time in China to look past the caricatured pictures that are often painted by biased parties and rid yourself of any stereotypes you might have that are based on what you thought you knew about the old “communist China” – because they are wrong.
- “As an aside, I think the widespread medium distortions and the blind and the near-violent loyalties that stand in the way of the thoughtful exploration of our different perspectives are a frightening sign of our times.”
Second, this is where JD enters the picture. If the “China risk” is valid, then it should apply to all other major Chinese firms too, such as BABA’s close peer JD. After all, they all operate in the same country and are governed by the same laws (or lack of laws, as many have bears argued). If BABA’s business fundamentals don’t mean much to the investment thesis, then neither should JD’s.
However, reality does not seem to confirm. The following chart shows a simple counterexample in terms of stock price actions. As you can see from the below chart, over the past year, JD suffered a total loss of around 4%, totally within the range of random fluctuations. On the other hand, BABA’s stock price suffered a total loss of more than 46% in the past years.
And as you already know, JD is still trading at a healthy (or even lofty) valuation with a P/E around 35x. This leads us to the next risk associated with BABA, its profitability. And we will discuss this next.
Seeking Alpha
But BABA also has higher margins
The next bearish argument is that due to the regulatory changes, BABA’s good old days are gone and its profitability couldn’t sustain in the future. Therefore, its valuation should be discounted correspondingly.
A very valid argument again. And moreover, this argument is indeed supported by data, as you can see from the top panel in the next chart. To net profit margin as an example, BABA’s margin has been quite stable and fluctuated in a narrow range between about 20% to 30% in the past before the tech crackdown started in 2020. Then it declined all the way to the current level of 6.4%.
But as advised by Charlie Munger, being smart is all about actively looking for disconfirming evidence, not confirming evidence. And JD’s margin, shown in the bottom panel of this chart, is an easy disconfirming evince to find. You can see JD’s net margin has declined (and in a more dramatic fashion) since 2021, it is currently in the negative (-1%), and its long-term average is nowhere near BABA’s. In terms of long-term averages, BABA’s margin of 23% is 13x higher than JD’s 1.7%. Even when we compared BABA’s current margin of 6.4% against JD’s long-term average (kind of unfair), BABA is still ahead by about 3.8x.
And this leads us yet to the next bears’ argument associated with BABA, which goes more or less like this: margins (or profitability in general) are not the whole story, and their business models are not entirely comparable. And we will address this next.
Seeking Alpha
Business model comparison
A few key differences here. First, even though BABA is better known and bigger than JD in market-cap (by almost 3x), JD’s revenues are actually larger than BABA. JD is China’s largest direct retailer in terms of revenue. Second, JD relies almost exclusively on a single source of revenue while BABA is more diversified. JD’s retail business represents 94% of its total sales and almost 100% of its total profits. BABA’s core eCommerce operation “only” accounts for about 87% of its total sales, with the rest coming from other segments such as its cloud service.
Now, even within the e-commerce segment, they are very different. JD’s main operation is its first-party marketplace. It sells its own goods and keeps its own inventories. In contrast, BABA’s main role is to provide a platform and act as a third party. For reference, Amazon (AMZN) is more of a hybrid. Its Third-Party Sales and First-Party Sales are about an even split in recent years.
The focus of this article is not trying to argue which model (first-party, third-party, or a hybrid) is better, although that would be a fascinating topic for another article. The point is to acknowledge the bears’ point that net profit margin is not the entire picture because of the differences in business fundamentals
Or to put it differently, margins do not entirely determine profitability. Intuitively, the reasons are summarized by the following simple example used in one of our earlier articles:
If you buy an orange today for $1 and sell it tomorrow for $1.01, your margin is a meager 1% but your ROIC (which is your true profitability) would be an astronomical 365%. There are three knobs that management can turn to drive up profitability: profit margin (“PM”), asset turnover ratio (“ATR”), and leverage. And PM is only one of the 3 knobs.
And different business models lead to different ATR, as you can clearly see from the following chart. Because of its third-party dominant model, BABA’s ATR has been on average about 0.45x in the past five years (although note that the trend has been improving). In contrast, JD’s ATR is much higher. It has fluctuated in a range from 1.97x to about 2.46x in the past five years, with an average of 2.23x. So, because of its first-party dominant model, JD can operate its asset much more effectively than BABA, on average by about a factor of almost 5x.
Seeking Alpha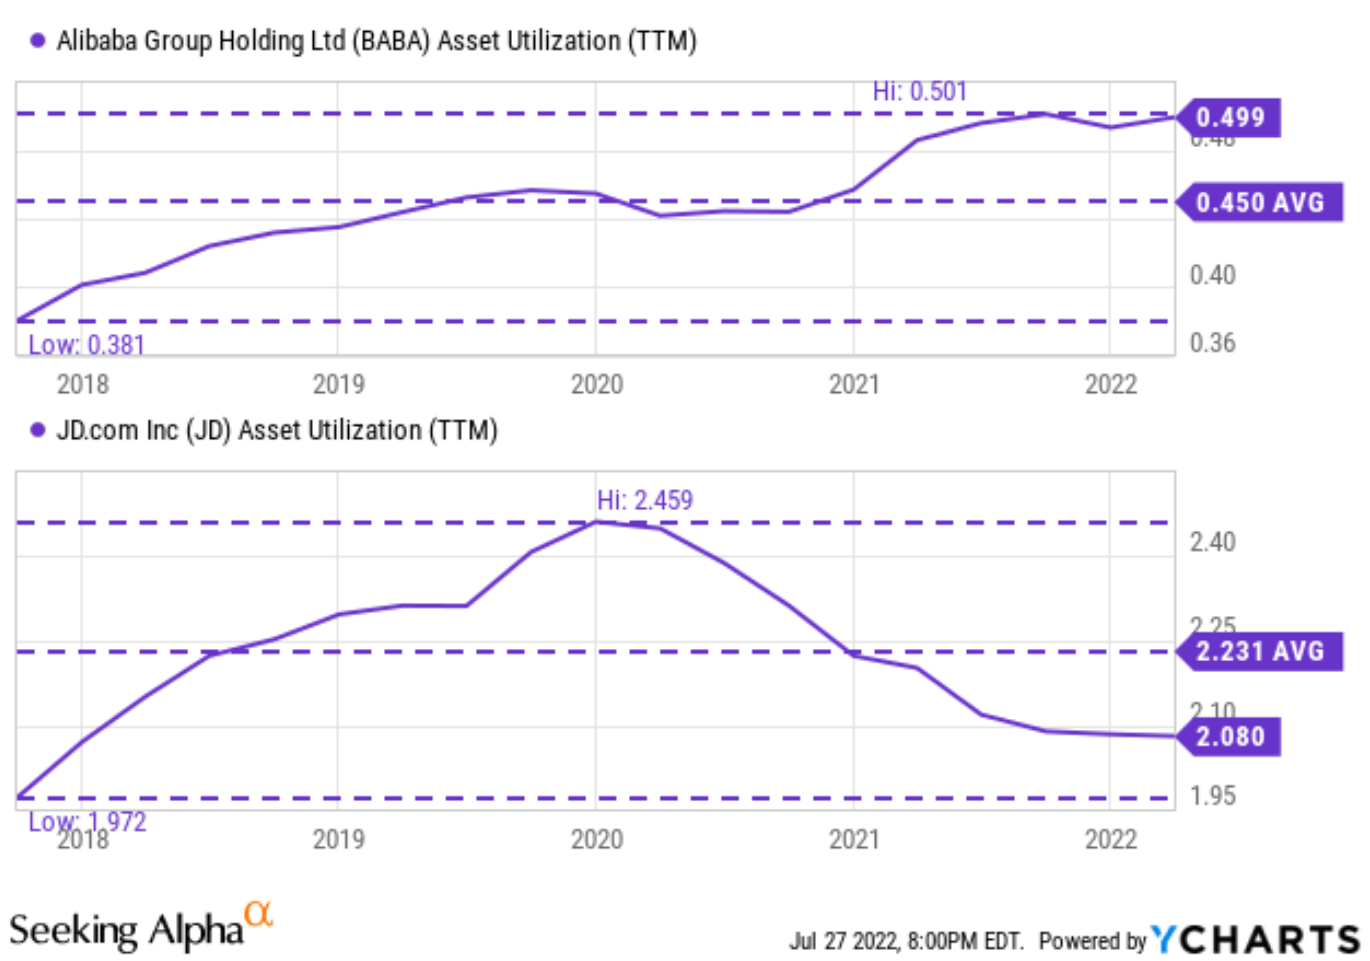
True profitability comparison
The next chart compares their return on capital employed (“ROCE”), a comprehensive measure of profitability combining the effects of all three knobs as detailed in my free blog article here. As seen, their current ROCE is on the same order of magnitude – both are at terrific levels. They are not different by 3.8x as net margin would suggest or by 5x as asset utilization would. BABA’s ROCE currently stands at about 95%, and JD at about 85%. Both JD and BABA’s ROCEs have been in decline since 2020 while BABA’s decline is more dramatic.
Author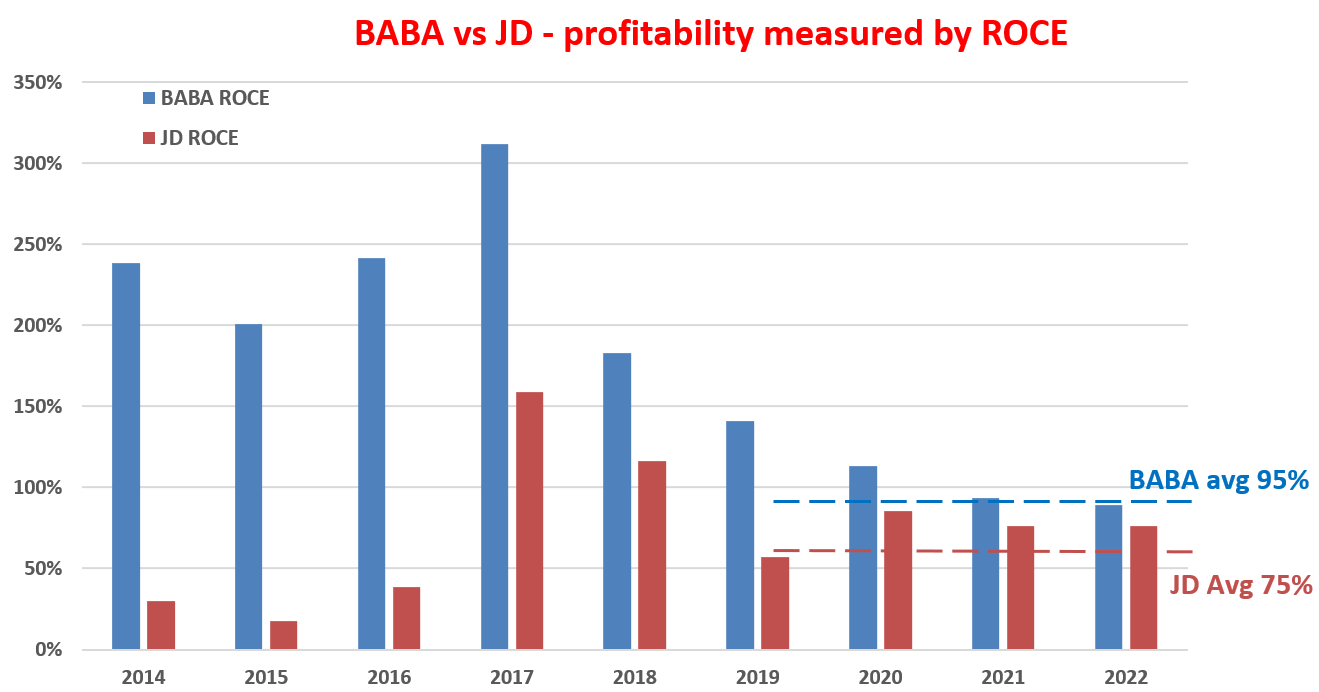
Yet BABA P/E is less than ½ of JD
The comparable ROCE now leads me to the following valuation comparison. As you can see, despite very comparable ROCE (BABA is actually higher), BABA’s valuation is less than ½ of JD by most metrics. Let me cite a few examples. BABA’s FY1 P/E of 13.8x is almost only 1/3 of JD’s 35x. Its FY2 P/E of 11.5x is less than 1/2 of JD’s 23.8x.
And next, we will see that the valuation discount is a bit less than what’s on the surface because of the differences in their balance sheets.
Seeking Alpha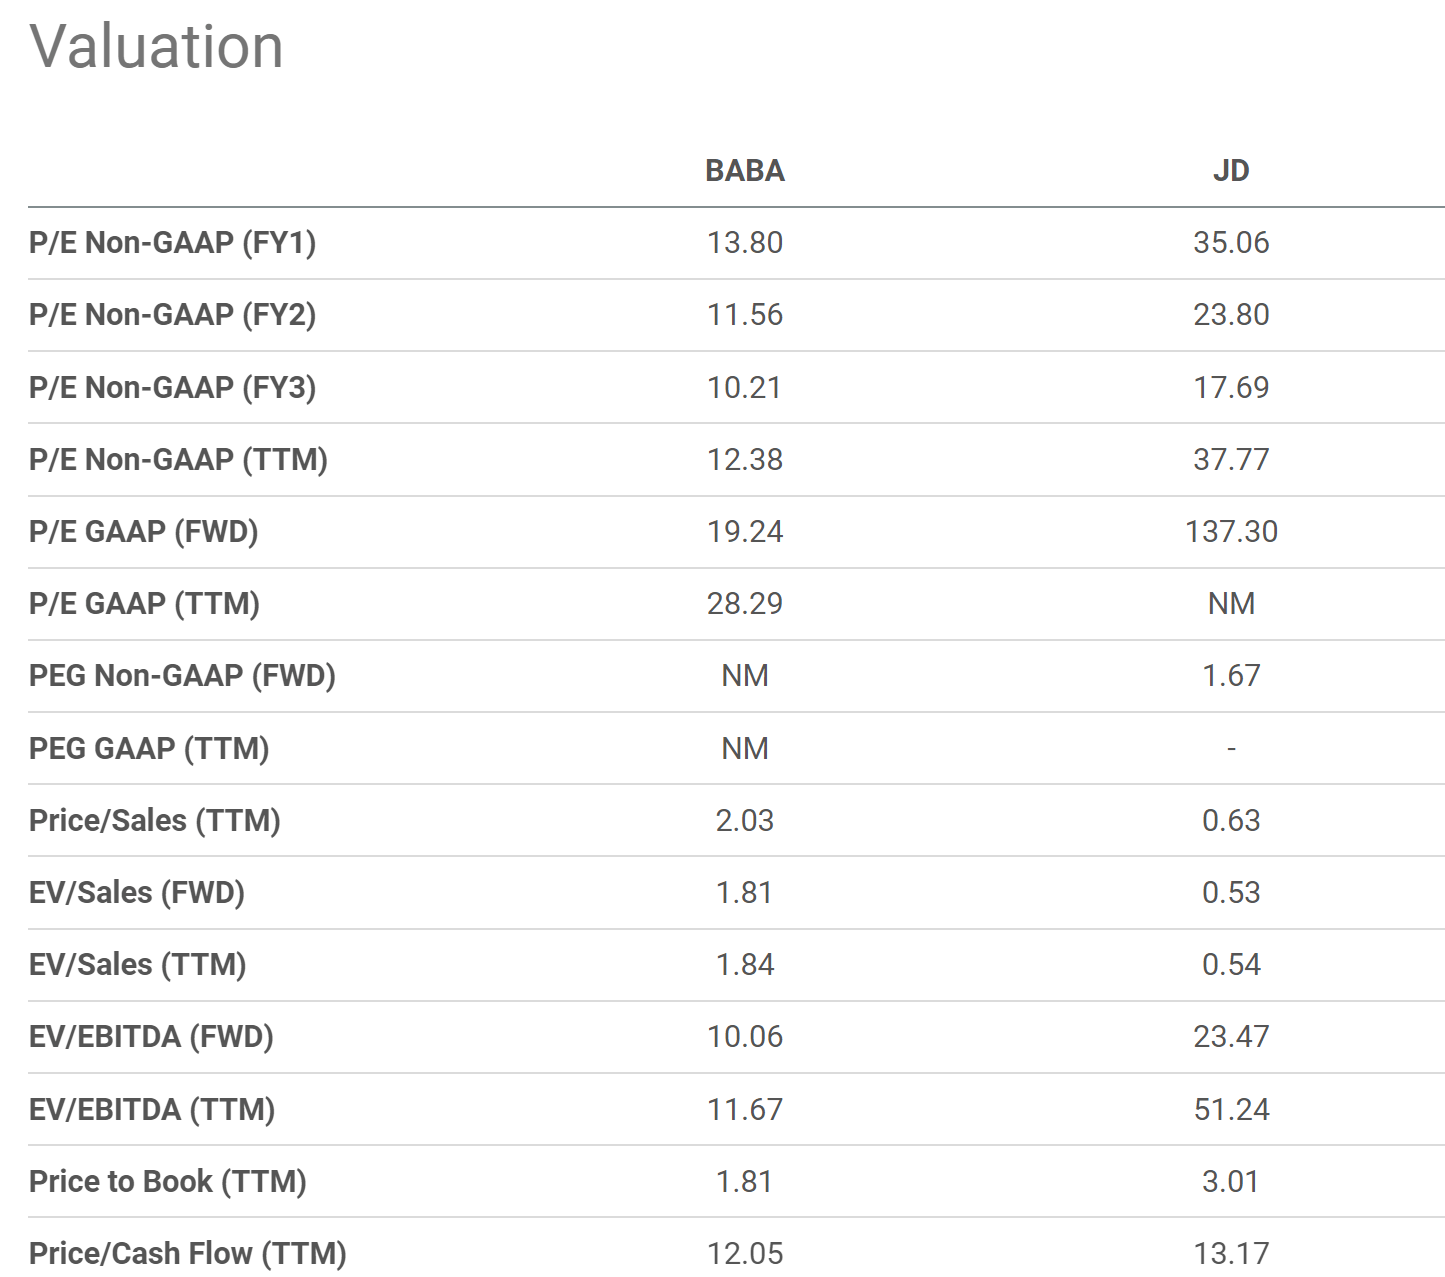
Balance sheet and adjusted P/E
Currently, BABA has about $72 billion of cash on its ledger and JD about $28 billion, translating into $26.8 per share for BABA and about $18.6 dollars per share for JD. Both of them also have some debt but the debt is both lower than the cash position. As a result, both carry a net cash position (a quite sizable one) on their ledger. The net cash position for BABA is about $44.5 billion and for JD about $8.3 billion.
In other words, at their current market cap ($274 billion for BABA and $96 billion for JD), about 16% of BABA’s market cap is just its cash and the percentage is about 20.8% for JD.
When we subtract the cash out of the stock price, their Pes would both become lower. For BABA, the FY1 P/E would become only 11.6x after adjusting for its cash position. And for JD, the FY1 P/E would become 27.7x, still more than 2x above BABA.
Seeking Alpha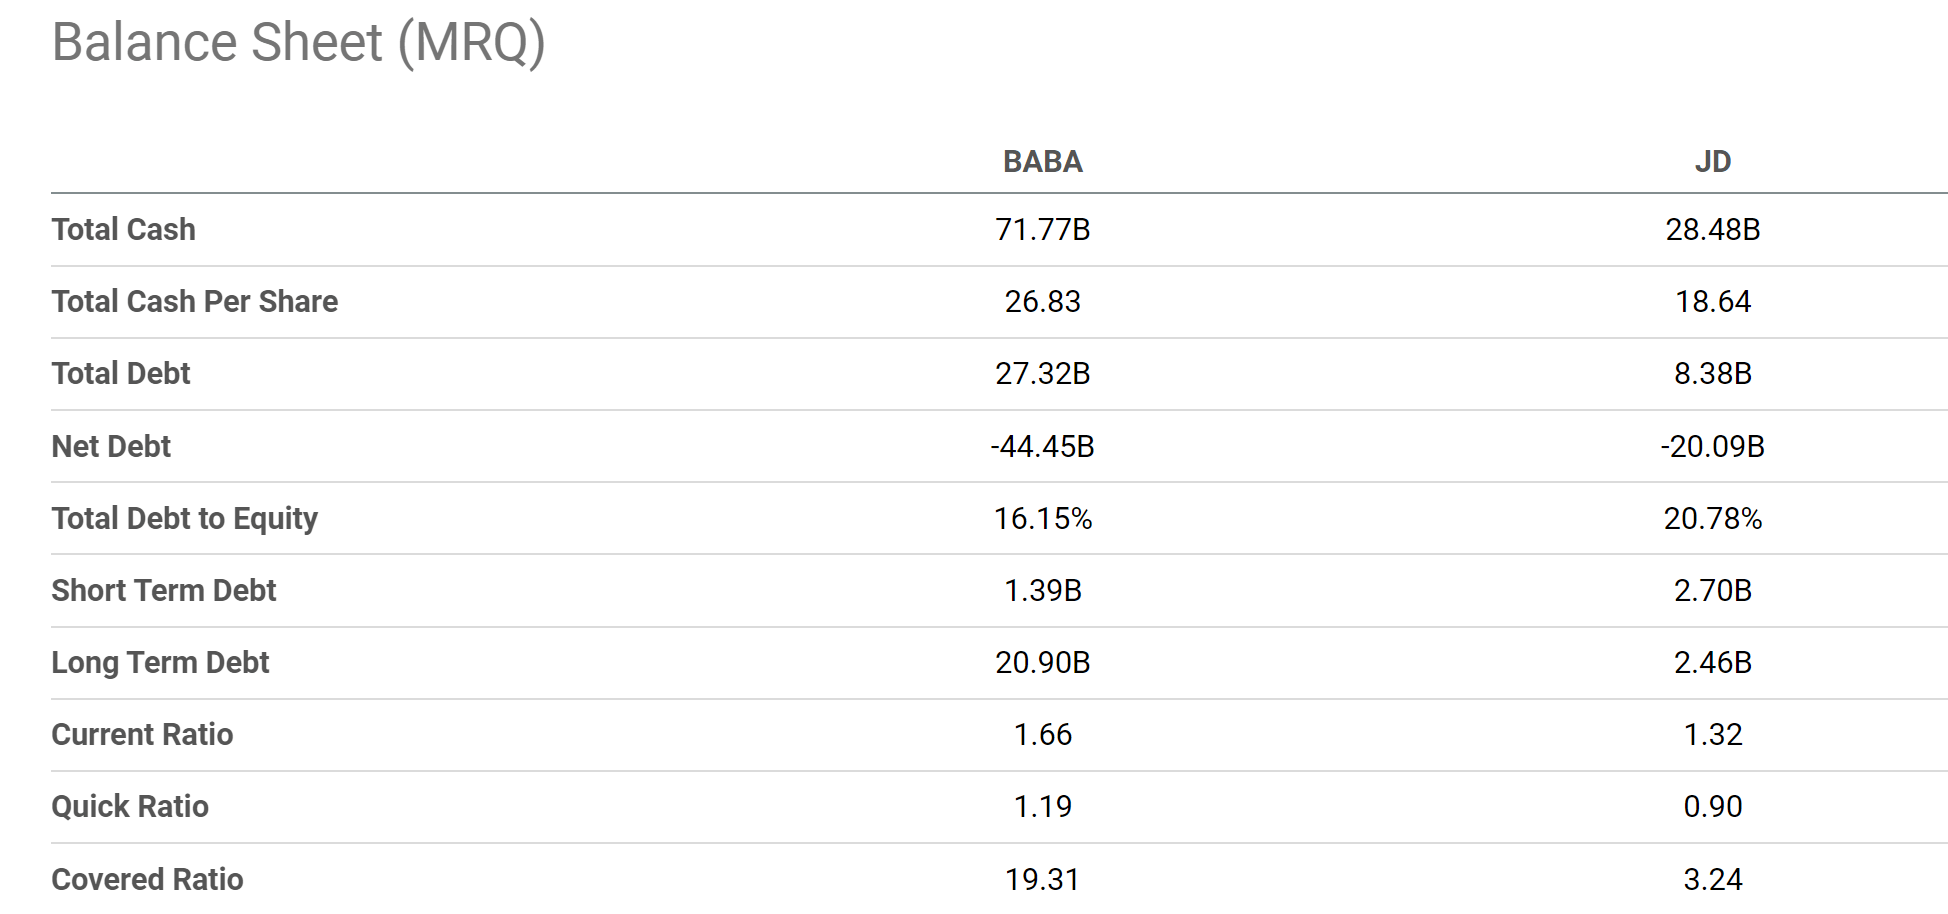
Final thoughts and risks
Even though I feel the market has gone too far in the fear direction for BABA (or not enough for JD), I think the bearish arguments are 100% valid. The common bearish concerns concerning BABA such as China risk, profitability sustainability, and business model, are 100% valid. And I hope the comparison and contrast against its close peer JD better accentuate these concerns so we can all make better investment decisions.
Finally, besides the above risks mentioned. There are also unfolding macroscopic risks that could impact both BABA and JD. BABA has more exposure overseas and will be more sensitive to global geopolitics such as the Russian/Ukraine situation. The upside is that it’s better poised to tap into the global eCommerce movement, especially in the Asian-Pacific region. There are also macroeconomic headwinds specific to China, which would impact both BABA and JD. In the short term, China faces the challenge of balancing COVID control and economic growth. The World Bank projects its GDP growth to slow in 2022 to 4.3 percent (0.8% lower than China’s own economic update).
At the same time, China’s housing market is seeing weakening demand and dealing with sizable debt issues. A JPMorgan report estimated that the housing sector has been contributing up to 25% of its GDP when related sectors are considered in the past few years. But demand for housing is predicted to fall 47% by 2030. Such a large decline will create ripple effects throughout its entire economy.
Be the first to comment