

DragonImages/iStock via Getty Images
Warren Buffett started out buying “cigar butts” trying to purchase $1 for $0.5.
This strategy worked for decades and helped him become a legend on Wall Street.
However, Buffett’s biggest success came not from cigar-butt investing but from buying “wonderful companies at fair prices”.
It’s far better to buy a wonderful company at a fair price, than a fair company at a wonderful price.
The reason is simple. A cigar butt might double or triple your money, but a world-class blue-chip can deliver compound for decades, and deliver returns that are hundreds of times larger.
Adobe (NASDAQ:ADBE) is one of my favorite blue-chip growth recommendations right now, and I was recently fortunate enough to be able to add to my position on the day it crashed 10% after earnings.
Ycharts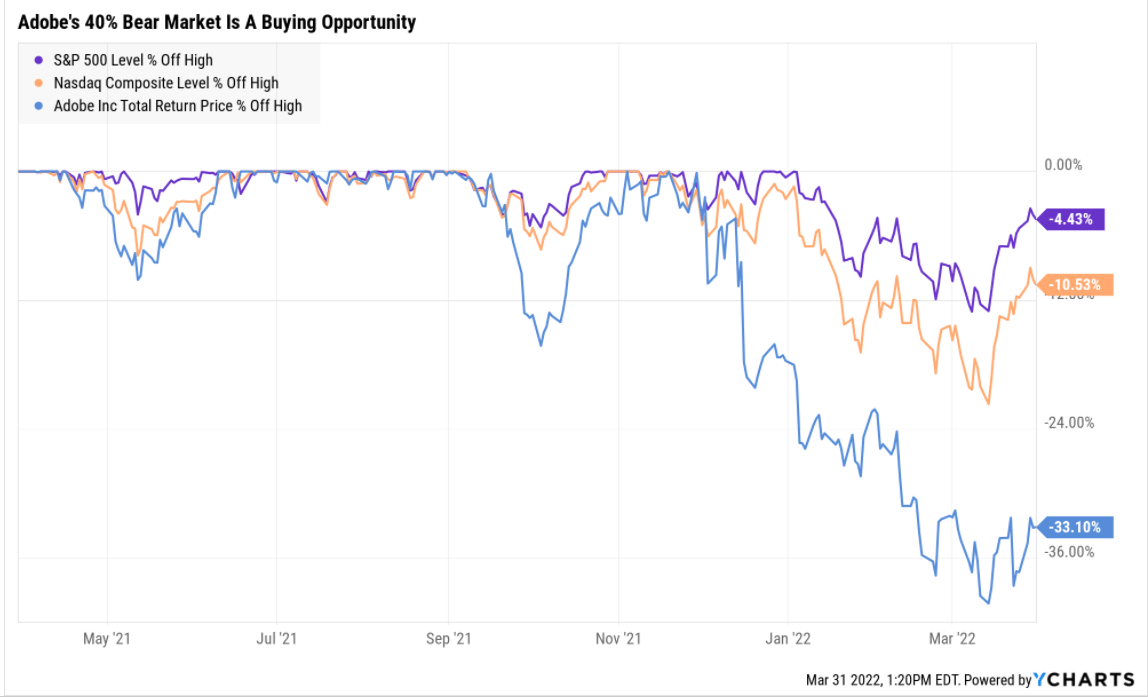
Today I want to explain why I just bought Adobe, and you might want to do the same.
Adobe Rolling Returns Since 1987
(Source: Portfolio Visualizer)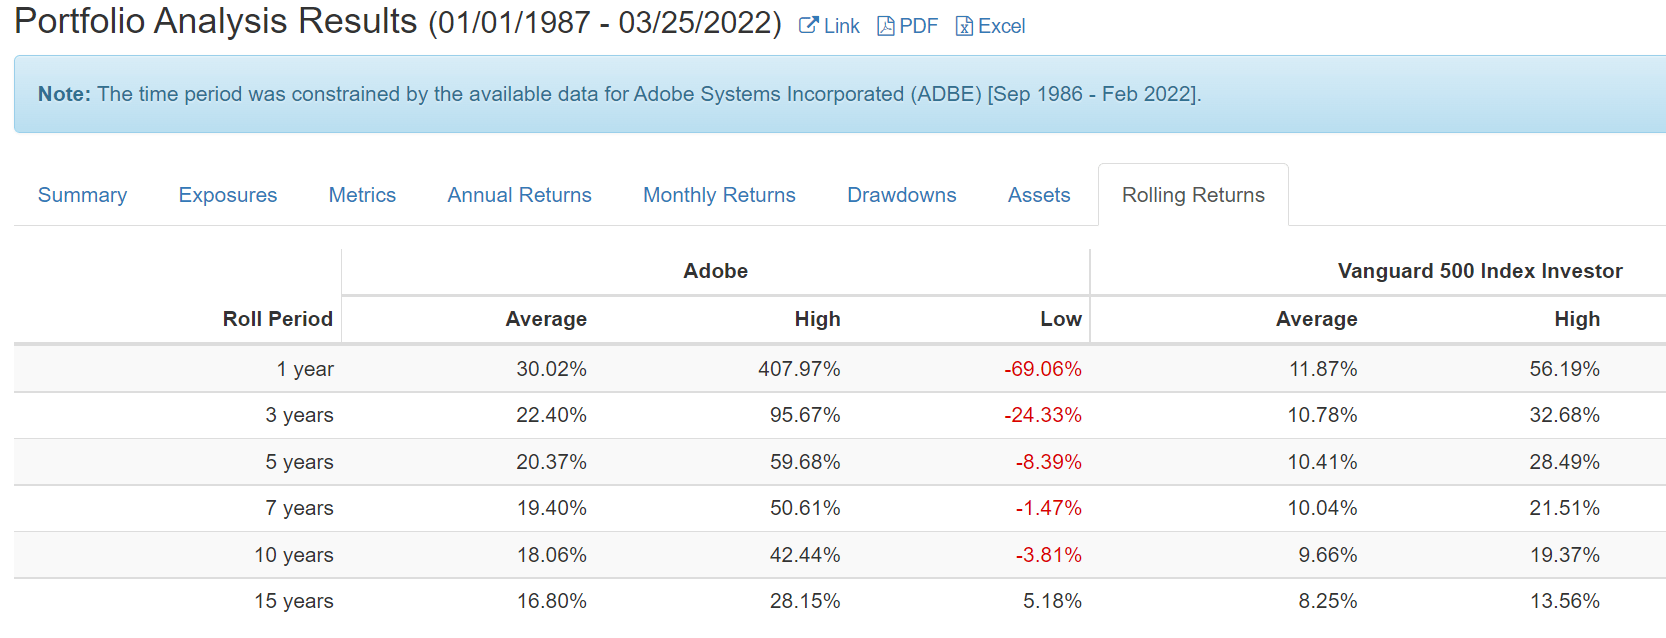
Adobe has historically delivered 16% to 18% annual returns but from bear market lows returns as strong as 28.2% CAGR are possible.
- from 2002 to 2017 it went up 41.3X
Well, today we have another bear market buying opportunity for Adobe, one of the greatest growth blue-chips in history.
Adobe Total Returns Since 1987
(Source: Portfolio Visualizer)
This isn’t just a wonderful growth stock, it’s one of the best growth stocks in history.
(Source: Portfolio Visualizer)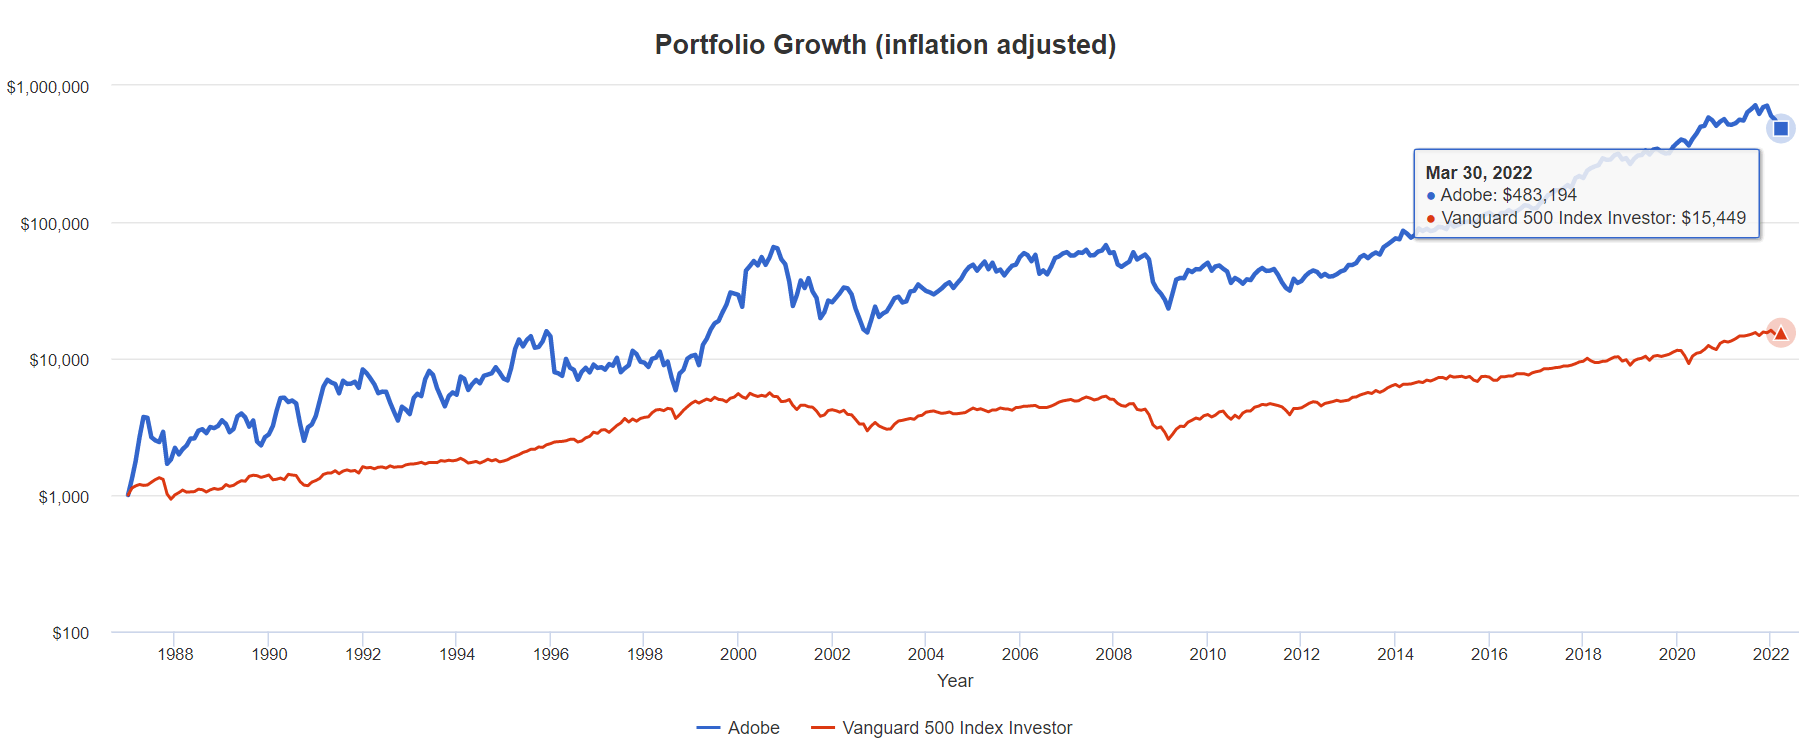
Adobe has more than doubled the market for 36 years, turning $1 into $483 adjusted for inflation, 32X better than the S&P 500.
Ok, but so what? You can’t invest in past returns right? Well, I wouldn’t be so excited to be recommending, and buying, Adobe, if it didn’t offer great long-term future returns.
| Investment Strategy | Yield | LT Consensus Growth | LT Consensus Total Return Potential | Long-Term Risk-Adjusted Expected Return | Long-Term Inflation And Risk-Adjusted Expected Returns | Years To Double Your Inflation & Risk-Adjusted Wealth |
10 Year Inflation And Risk-Adjusted Return |
| Adobe | 0.0% | 16.5% | 16.5% | 11.6% | 9.4% | 7.7 | 2.45 |
| Europe | 2.6% | 12.8% | 15.4% | 10.7% | 8.6% | 8.4 | 2.27 |
| Value | 2.1% | 12.1% | 14.1% | 9.9% | 7.7% | 9.3 | 2.10 |
| High-Yield | 2.8% | 11.3% | 14.1% | 9.9% | 7.7% | 9.4 | 2.10 |
| High-Yield + Growth | 1.7% | 11.0% | 12.7% | 8.9% | 6.7% | 10.8 | 1.91 |
| 7 High-Yield Super SWANs | 6.0% | 6.10% | 12.1% | 8.5% | 6.3% | 11.4 | 1.84 |
| Safe Midstream + Growth | 3.3% | 8.5% | 11.8% | 8.3% | 6.1% | 11.8 | 1.80 |
| Nasdaq (Growth) | 0.8% | 10.7% | 11.5% | 8.1% | 5.9% | 12.3 | 1.77 |
| Safe Midstream | 5.3% | 6.0% | 11.3% | 7.9% | 5.7% | 12.6 | 1.75 |
| Dividend Aristocrats | 2.2% | 8.9% | 11.1% | 7.8% | 5.6% | 12.9 | 1.72 |
| REITs + Growth | 1.8% | 8.9% | 10.6% | 7.4% | 5.2% | 13.7 | 1.67 |
| S&P 500 | 1.4% | 8.5% | 9.9% | 7.0% | 4.8% | 15.1 | 1.59 |
| Dividend Growth | 1.6% | 8.0% | 9.6% | 6.7% | 4.5% | 15.9 | 1.56 |
| REITs | 2.9% | 6.5% | 9.4% | 6.6% | 4.4% | 16.4 | 1.54 |
| 60/40 Retirement Portfolio | 2.1% | 5.1% | 7.2% | 5.1% | 2.9% | 24.9 | 1.33 |
| 10-Year US Treasury | 2.4% | 0.0% | 2.4% | 1.7% | -0.5% | -144.0 | 0.95 |
(Source: Morningstar, FactSet, Ycharts)
Analysts expect Adobe to keep growing at 16.5% over time, delivering returns on par with the greatest investors in history.
And far better than any popular investment strategy on Wall Street.
Inflation-Adjusted Management Guidance: $1,000 Initial Investment
| Time Frame (Years) | 7.7% CAGR Inflation-Adjusted S&P Consensus | 9.0% Inflation-Adjusted Aristocrat Consensus | 14.3% CAGR Inflation-Adjusted ADBE Consensus | Difference Between Inflation Adjusted ADBE Consensus And S&P 500 |
| 5 | $1,449.03 | $1,540.04 | $1,952.59 | $503.56 |
| 10 | $2,099.70 | $2,371.71 | $3,812.61 | $1,712.91 |
| 15 | $3,042.53 | $3,652.52 | $7,444.46 | $4,401.93 |
| 20 | $4,408.74 | $5,625.01 | $14,535.98 | $10,127.24 |
| 25 | $6,388.41 | $8,662.72 | $28,382.81 | $21,994.40 |
| 30 | $9,257.02 | $13,340.91 | $55,419.99 | $46,162.98 |
(Source: DK Research Terminal, FactSet)
If Adobe grows as expected, it could turn a modest investment into a small fortune, and a significant investment into generational wealth.
| Time Frame (Years) | Ratio Aristocrats/S&P | Ratio Inflation-Adjusted ADBE Consensus Vs. S&P 500 |
| 5 | 1.06 | 1.35 |
| 10 | 1.13 | 1.82 |
| 15 | 1.20 | 2.45 |
| 20 | 1.28 | 3.30 |
| 25 | 1.36 | 4.44 |
| 30 | 1.44 | 5.99 |
(Source: DK Research Terminal, FactSet)
Basically, Adobe has the potential to beat the market by 6X over the next 30 years.
But you don’t have to wait decades to get rich with Adobe.
Adobe 2024 Consensus Return Potential (Mid-Range Historical PE)
(Source: FAST Graphs, FactSet Research)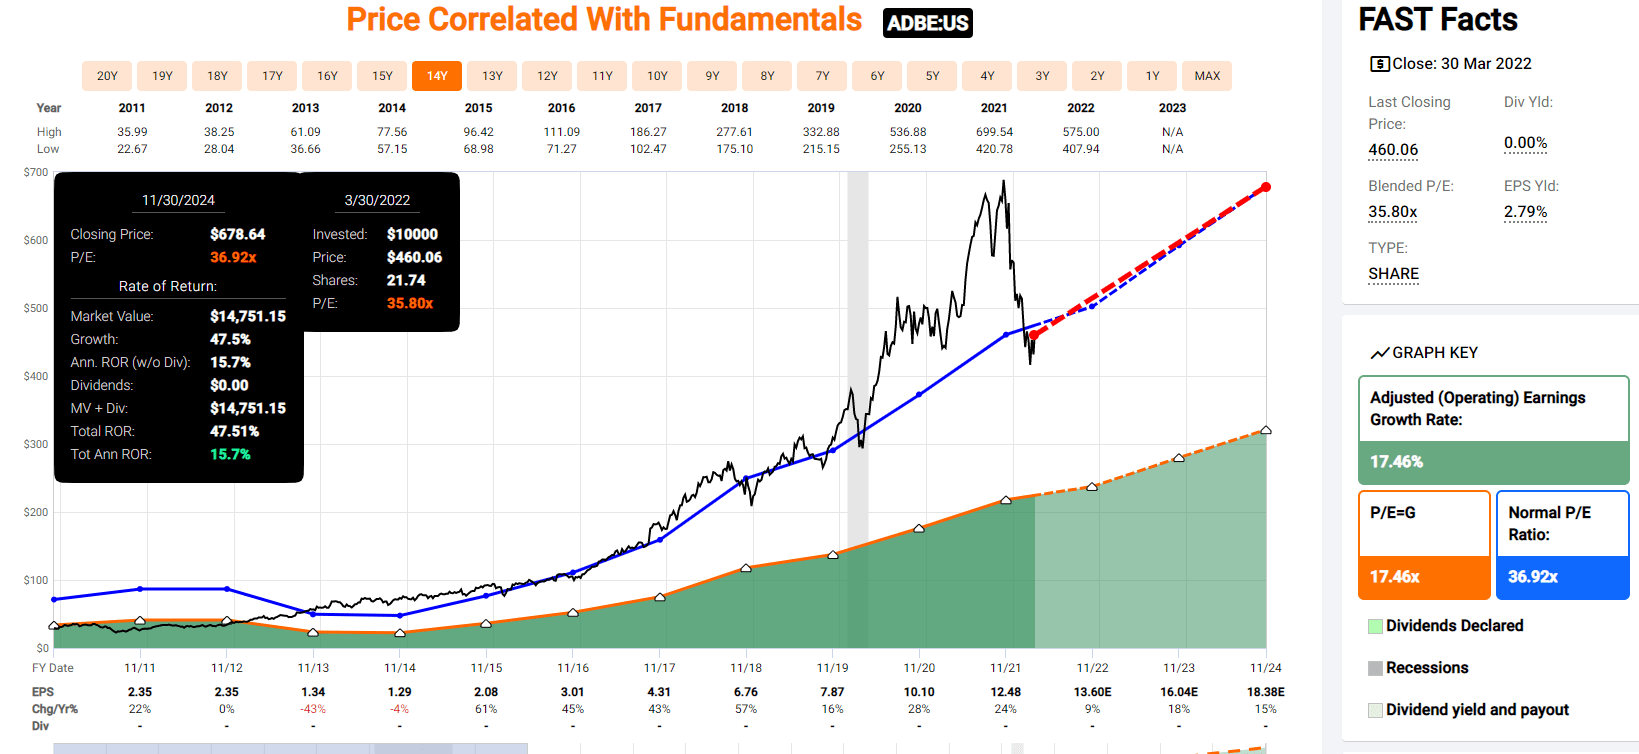
Adobe could potentially deliver 48% returns through 2024, or 16% annually.
Adobe 2024 Morningstar Return Potential (42.5 PE)
(Source: FAST Graphs, FactSet Research)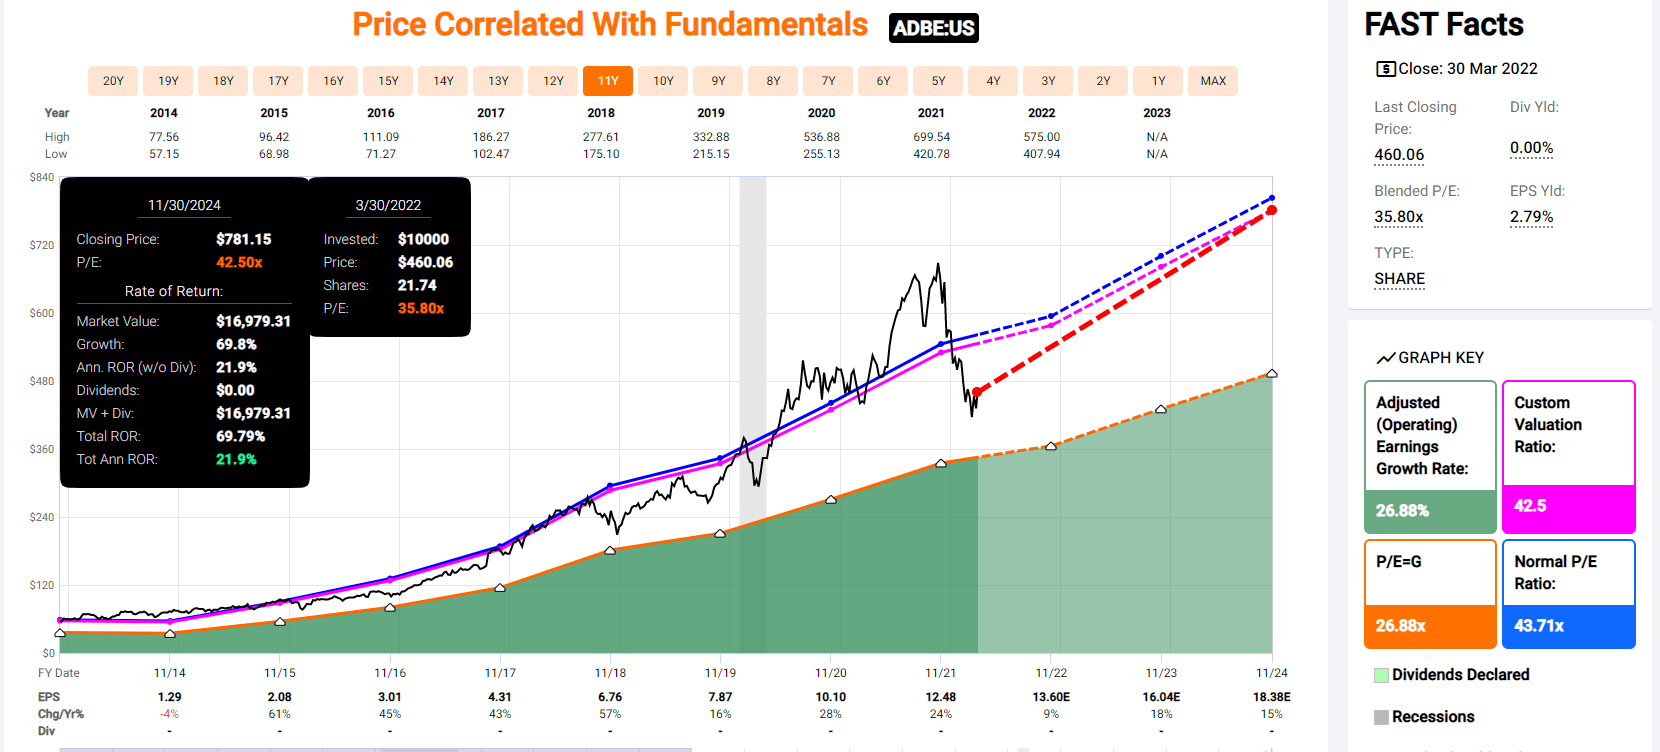
Morningstar’s return forecast is based on a 42.5 fair value PE, which is the historical norm since ADBE shifted to a subscription model in 2013.
- the upper end of the 33 to 44 historical fair value range
If Morningstar is right then ADBE could nearly double by 2024 and deliver 22% CAGR total returns.
- similar to the incredible returns generated from former bear market lows
Adobe 2027 Consensus Return Potential (Mid-Range Historical PE)
(Source: FAST Graphs, FactSet Research)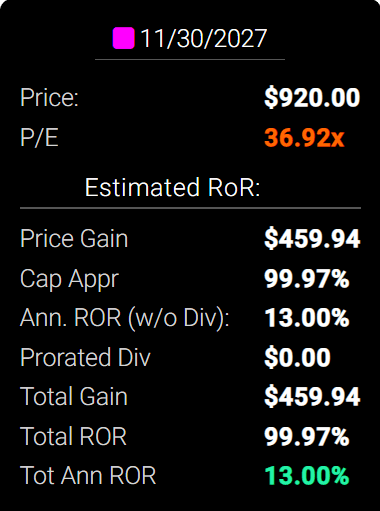
- ADBE has the potential to double your money over the next five years
- 3X the S&P 500 consensus
Adobe 2027 Bullish Consensus Return Potential (42.5 PE) – Morningstar’s Model
(Source: FAST Graphs, FactSet Research)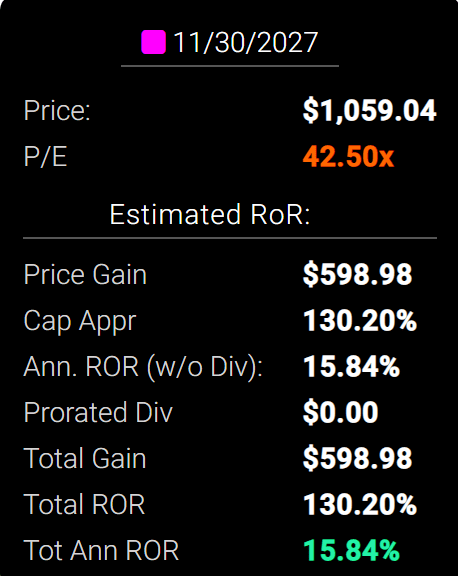
- if Morningstar is right, then Adobe could soar 130% in the next five years delivering 16% annual returns
- 4X the S&P 500’s consensus
ADBE Investment Decision Score
DK (Source: DK Automated Investment Decision Tool)

For anyone comfortable with its risk profile, ADBE is as close to a perfect hyper-growth blue-chip investment as exists on Wall Street today.
- 14% discount vs. 21% market premium
- far superior fundamental quality and safety
- 65% higher long-term return potential than S&P 500 overtime
- more than 3X the risk-adjusted expected return for the next five years
Now that you understand the incredible potential of Adobe, let me explain the three reasons I just bought more of one of the world’s greatest growth stocks, and you might want to do the same.
Reason One: Quality That’s Simply Astounding
The Dividend King’s overall quality scores are based on a 241 point model that includes:
-
dividend safety
-
balance sheet strength
-
credit ratings
-
credit default swap medium-term bankruptcy risk data
-
short and long-term bankruptcy risk
-
accounting and corporate fraud risk
-
profitability and business model
-
growth consensus estimates
-
management growth guidance
-
historical earnings growth rates
-
historical cash flow growth rates
-
historical dividend growth rates
-
historical sales growth rates
-
cost of capital
-
long-term risk-management scores from MSCI, Morningstar, FactSet, S&P, Reuters’/Refinitiv, and Just Capital
-
management quality
-
dividend friendly corporate culture/income dependability
-
long-term total returns (a Ben Graham sign of quality)
-
analyst consensus long-term return potential
In fact, it includes over 1,000 fundamental metrics including the 12 rating agencies we use to assess fundamental risk.
- 41% based on credit and risk-management ratings
- 82% focused on fundamental risk
How do we know that our safety and quality model works well?
During the two worst recessions in 75 years, our safety model 87% of blue-chip dividend cuts, the ultimate baptism by fire for any dividend safety model.
And then there’s the confirmation that our quality ratings are very accurate.
DK Zen Phoenix: Superior Fundamentals Lead To Superior Long-Term Results
| Metric | US Stocks | 188 Real Money DK Phoenix Recs |
| Great Recession Dividend Growth | -25% | 0% |
| Pandemic Dividend Growth | -1% | 6% |
| Positive Total Returns Over The Last 10 Years | 42% | 99.5% (Greatest Investors In History 60% to 80% Over Time) |
| Lost Money/Went Bankrupt Over The Last 10 Years | 47% | 0.5% |
| Outperformed Market Over The Last Decade (299%) | 36% | 51% |
| Bankruptcies Over The Last 10 Years | 11% | 0% |
| Permanent 70+% Catastrophic Decline Since 1980 | 44% | 0.5% |
| 100+% Total Return Over The Past 10 Years | NA | 88% |
| Sources: Morningstar, JPMorgan, Seeking Alpha |
Basically, historical market data confirms that the DK safety and quality model is one of the most comprehensive and accurate in the world.
This is why I entrust 100% of my life savings to this model and the DK Phoenix blue-chip strategy.
Adobe Balance Sheet Safety
| Rating | Dividend Kings Safety Score (151 Point Safety Model) | Approximate Dividend Cut Risk (Average Recession) |
Approximate Dividend Cut Risk In Pandemic Level Recession |
| 1 – unsafe | 0% to 20% | over 4% | 16+% |
| 2- below average | 21% to 40% | over 2% | 8% to 16% |
| 3 – average | 41% to 60% | 2% | 4% to 8% |
| 4 – safe | 61% to 80% | 1% | 2% to 4% |
| 5- very safe | 81% to 100% | 0.5% | 1% to 2% |
| ADBE | 100% | NA | NA |
| Risk Rating | Low Risk (83rd industry percentile risk-management consensus) | A+ stable outlook credit rating 0.6% 30-year bankruptcy risk | 20% OR LESS Max Risk Cap Recommendation |
Long-Term Dependability
| Company | DK Long-Term Dependability Score | Interpretation | Points |
| Non-Dependable Companies | 21% or below | Poor Dependability | 1 |
| Low Dependability Companies | 22% to 60% | Below-Average Dependability | 2 |
| S&P 500/Industry Average | 61% (58% to 70% range) | Average Dependability | 3 |
| Above-Average | 71% to 80% | Very Dependable | 4 |
| Very Good | 81% or higher | Exceptional Dependability | 5 |
| ADBE | 100% | Exceptional Dependability | 5 |
Overall Quality
| ADBE | Final Score | Rating |
| Safety | 100% | 5/5 very safe |
| Business Model | 90% | 3/3 wide moat |
| Dependability | 100% | 5/5 exceptional dependability (past and future returns) |
| Total | 99% | 13/13 Ultra SWAN |
| Risk Rating | 3/3 Low Risk | |
| 20% OR LESS Max Risk Cap Rec |
5% Margin of Safety For A Potentially Good Buy |
Adobe: 4th Highest Quality Master List Company (Out of 508) = 99th Percentile
The DK 500 Master List includes the world’s highest quality companies including:
-
All dividend champions
-
All dividend aristocrats
-
All dividend kings
-
All global aristocrats (such as BTI, ENB, and NVS)
-
All 13/13 Ultra Swans (as close to perfect quality as exists on Wall Street)
- 48 of the world’s best growth stocks
Adobe’s 99% quality score means its similar in quality to such blue-chips as
- Mastercard (MA)
- Microsoft (MSFT)
- Colgate-Palmolive (CL) – dividend king
- Visa (V)
- V.F. Corp. (VFC) – dividend king
- S&P Global (SPGI) – dividend aristocrat
- Applied Materials (AMAT)
- Nike (NKE)
- Allianz (OTCPK:ALIZY)
- Taiwan Semiconductor (TSM)
- Alphabet (GOOG)
Even among the most elite companies on earth, Adobe is higher quality than 99% of them.
Why Adobe Is One Of The Greatest Growth Stocks On Earth
Adobe was founded in 1982 in Silicon Valley.
- one of the most adaptable tech giants on earth
Adobe is a highly diversified global giant.
- 51% of sales from the US
- 27% from Europe and the Middle East
- 16% from Asia
- 6% from other
Earnings Update
“Given an expected $75 million revenue impact for the year along with a slightly higher tax rate, we are modestly lowering our fair value estimate to $615 per share, from $630, and see shares as attractive after believing they were overvalued for much of 2021…
Despite investor concerns about the competition at the low end, we see Adobe’s dominance as unencumbered and view the recent price increases as warranted given the expanding portfolio…
Adobe noted solid demand throughout the quarter from individuals, SMB, teams, and enterprise customers, with some weakness in the last two weeks of the quarter, corresponding to the Russian invasion of Ukraine…
Retention was stronger than pre-pandemic levels.
We remain impressed by Adobe’s ability to drive new users in digital media and we are encouraged by solid results in DX, both of which we think continue in 2022.” – Morningstar (emphasis added)
Management’s guidance for 2022 was $.05 below consensus, about 1%.
The stock fell 10% that day.
- median growth consensus fell from 16.6% to 16.5% CAGR after earnings
- analyst growth forecast range is 14% to 20%
Investment Thesis Summary
“Adobe has come to dominate in content creation software with its iconic Photoshop and Illustrator solutions, both now part of the broader Creative Cloud, which is now offered via a subscription model…
Adobe believes it is attacking an addressable market greater than $205 billion. The company is introducing and leveraging features across its various cloud offerings (like Sensei artificial intelligence) to drive a more cohesive experience, win new clients, upsell users to higher price point solutions, and cross-sell digital media offerings.” – Morningstar (emphasis added)
Motley Fool just re-recommended Adobe as a “timely pick”
“Adobe has done a good job of riding the wave of digital innovation, successfully making the transition from one-time license sales to a subscription-based recurring-revenue model…
That has dramatically expanded the reach of its Creative Cloud suite, which makes up more than 60% of Adobe’s overall revenue…
As the creator economy continues to grow, individuals and businesses alike will see even greater need to embrace the cutting-edge tools that Adobe offers, particularly in new, fast-growing areas like augmented reality and the metaverse…
Adobe has seen great success with its Document Cloud suite, whose annualized recurring revenue topped the $2 billion mark for the first time in the first quarter of 2022.
Yet Adobe has an even bigger potential opportunity in serving businesses seeking to improve the digital experiences they offer their own customers…
The software giant has estimated that its addressable market for its digital experience business could reach $110 billion by 2024, and that would be greater than the $95 billion market it’s serving in the creative digital media space…
Businesses in every industry need to tailor their marketing and customer service efforts to reach people in the digital world. Adobe has harnessed the power of artificial intelligence to make it easier for its clients to embrace digital transformation, but its low penetration rate gives it plenty of room for capturing more of this fast-growing market.” – Motley Fool (Stock Advisor) – emphasis added
Adobe has several secular growth trends it can harness for decades to come.
- AI
- cloud computing
- Software-as-a-service
- digital content
ADBE’s CEO has been with the company for 21 years and is a proven master of tuck-in acquisitions.
- bought Omniture for $1.7 billion (5.2X sales)
- this acquisition led to Adobe Analytics Cloud
- Neolane in 2013 for $600 million
- TubeMogul in 2016 for $629 million (3X sales)
- Magento in 2018 for $1.8 billion
- Marketo in 2018 for $4.8 billion (20X sales)
- Workfront in 2021 for $1.5 billion
Conference Call Highlights
“Adobe had a strong Q1. We achieved a record $4.26 billion in revenue, representing 17% year-over-year growth on an adjusted basis.” – CEO, Q4 conference call
“Ending ARR for Document Cloud crossed the $2 billion mark, which represents 29% year-over-year growth.” – President Digital Media
“We repurchased approximately 3.8 million shares in Q1 at a cost of $2.1 billion. Included in this purchase was the partial settlement of an accelerated share repurchase entered into during Q1 to repurchase shares at an aggregate cost of $2.4 billion.” – CFO
Adobe repurchased almost 1% of shares at an average price of $553 in Q1.
“These share repurchases are part of the previously announced program, under which we currently have $10.7 billion remaining of our $15 billion authorization that was granted in December 2020 and goes through 2024.” – CFO
Adobe still has nearly $11 billion in buyback authorization left through 2024.
- 5.25% of existing shares at current valuations
For Q2, we are targeting total Adobe revenue of approximately $4.34 billion; net new Digital Media ARR of approximately $440 million;
Digital Media segment revenue growth of approximately 13% year-over-year or 14% in constant currency;
Digital Experience segment revenue growth of approximately 15% year-over-year or 16% in constant currency;
Digital Experience subscription revenue growth of approximately 17% year-over-year or 18% in constant currency” – CFO
Adobe’s businesses are all expected to keep growing at a very healthy rate.
Deep Dive Into Adobe’s Investment Thesis
Investment Thesis Highlights
Adobe’s subscription base is expected to keep growing at a healthy 13.4% CAGR through 2024.
- nearly 4 million new subscribers per year
Adobe estimates a $205 billion total addressable market in 2024 that’s growing from 29% to 54% depending on the market.
Adobe’s track record on execution is superb
- 75% sales growth over the last three years
- 92% subscription revenue growth
- 104% growth in operating income
- $12 billion in buybacks
- share price up more than 3X (including the current bear market)
Exceptional Management You Can Trust
“We assign Adobe an Exemplary capital allocation rating…
The balance sheet is sound with a net cash position…
Adobe’s capital deployment strategy centers around re-investing in the business and making generally small tuck-in acquisitions…
Shantanu Narayen joined the company in 1998 as senior vice president of worldwide product development. He was promoted to COO, and ultimately to CEO, a position he has had since 2007…
Narayen has steered the company through a variety of critical changes over the years…
Narayen is responsible for initially bundling Photoshop, Illustrator, and other products into what was then known as the Creative Suite in 2003, which he ultimately converted to a subscription model in 2013….
it had never been attempted at a company the size of Adobe.
After the initial margin and growth hit, both measures improved markedly, with growth remaining strong years after the transition and margins rebounding to pre-transition levels within a few years…
While the transition to SaaS was a critical shift for Adobe, the acquisition of Omniture in 2009 represented a new strategic direction for the company…
Omniture was purchased for $1.7 billion and served as the foundation for what was initially Adobe Marketing and is now called the Adobe Analytics Cloud.” – Morningstar
Adobe’s management is
- visionary
- adaptable
- extremely competent at execution
- rating agencies consider its long-term risk-management in the 83rd industry percentile
Adobe has just an 8% global market share in its $205 billion addressable market.
- very long and strong growth runway
Adobe Credit Ratings
| Rating Agency | Credit Rating | 30-Year Default/Bankruptcy Risk | Chance of Losing 100% Of Your Investment 1 In |
| S&P | A+ stable | 0.60% | 166.7 |
| Moody’s | A2 (A equivalent) stable | 0.66% | 151.5 |
| Consensus | A+ stable | 0.63% | 158.7 |
(Source: S&P, Moody’s)
Adobe’s fundamental risk is approximately 0.63% according to S&P and Moody’s.
- approximately a 1 in 159 chance of losing all your money over the next 30 years
Adobe Leverage Consensus Forecast
| Year | Debt/EBITDA | Net Debt/EBITDA (3.0 Or Less Safe According To Credit Rating Agencies) |
Interest Coverage (8+ Safe) |
| 2020 | 0.66 | -0.20 | 47.59 |
| 2021 | 0.51 | -0.05 | 64.24 |
| 2022 | 0.47 | -0.05 | 71.59 |
| 2023 | 0.41 | -0.35 | 83.34 |
| 2024 | NA | -0.92 | 89.44 |
| Annualized Change | -14.41% | 45.44% | 17.08% |
(Source: FactSet Research Terminal)
Adobe’s balance sheet is expected to keep getting stronger over time potentially leading to upgrades to AA.
- last year S&P upgraded Adobe from A to A+ in July 2021
Rating Agency Leverage Guidelines
| Credit Rating | Safe Net Debt/EBITDA For Most Companies | 30-Year Default/Bankruptcy Risk |
| BBB | 3.0 or less | 7.50% |
| A- | 2.5 or less | 2.50% |
| A | 2.0 or less | 0.66% |
| A+ | 1.8 or less | 0.60% |
| AA | 1.5 or less | 0.51% |
| AAA | 1.1 or less | 0.07% |
(Source: S&P, Fitch, Moody’s)
Adobe could eventually become an AAA-rated company.
“Although unlikely, a major acquisition or a shift in financial policy to more aggressive shareholder returns, leading to adjusted leverage above 1.5x, could cause us to lower the rating over the next two years.
We could raise the rating if the company continues to gain scale in EBITDA and FOCF while diversifying and expanding its digital experience products and maintaining adjusted leverage below 1.5x.” – S&P
Adobe’s existing leverage metrics are already in-line with AA-rated companies and are only expected to get stronger over time.
Adobe Balance Sheet Consensus Forecast
| Year | Total Debt (Millions) | Cash | Net Debt (Millions) | Interest Cost (Millions) | EBITDA (Millions) | Operating Income (Millions) | Average Interest Rate |
| 2020 | $4,117 | $5,235 | -$1,284 | $116 | $6,278 | $5,521 | 2.82% |
| 2021 | $4,123 | $3,844 | -$423 | $113 | $8,047 | $7,259 | 2.74% |
| 2022 | $4,123 | $8,210 | -$467 | $112 | $8,704 | $8,018 | 2.72% |
| 2023 | $4,123 | $14,525 | -$3,498 | $112 | $10,027 | $9,334 | 2.72% |
| 2024 | NA | $22,167 | -$10,460 | $120 | $11,431 | $10,733 | NA |
| Annualized Growth | 0.05% | 43.45% | 68.94% | 0.85% | 16.16% | 18.08% | -1.21% |
(Source: FactSet Research Terminal)
By 2024 analysts expect $10.5 billion in net cash (including receivables) and cash of $22.2 billion, growing 44% per year.
Interest costs are expected to fall modestly despite rising long-term interest rates around the world.
- potentially due to an upgrade to AA-credit rating
Adobe Bond Profile
- $1.7 billion more cash than debt
- $6.8 billion in liquidity (vs. $4.2 billion largest-ever acquisition)
- untapped $1 billion credit line
- 100% unsecured bonds (maximum financial flexibility)
- well-staggered bond maturities (no trouble refinancing debt if they want to)
- 2.4% average borrowing cost vs. bond market’s 2.2% long-term inflation forecast
- ADBE’s effective real interest rate is 0.2% vs. 37.6% cash return on invested capital
Profitability: Wall Street’s Favorite Quality Proxy
(Source: GuruFocus Premium)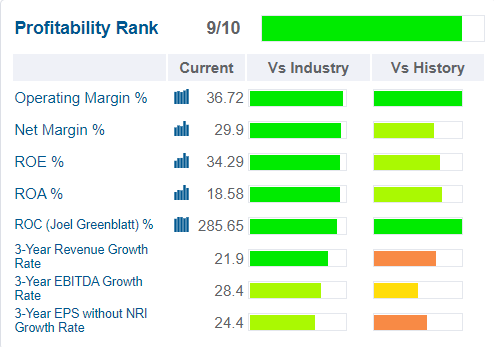
Adobe historically has profitability in the top 10% of peers.
- profitability rank has increased from 8/10 to 9/10 in recent months
Adobe Trailing 12-Month Profitability Vs. Peers
| Metric | Industry Percentile | Major Software Companies More Profitable Than ADBE (Out Of 501) |
| Operating Margin | 96.75 | 85 |
| Net Margin | 94.77 | 136 |
| Return On Equity | 93.86 | 160 |
| Return On Assets | 93.93 | 158 |
| Return On Capital | 90.96 | 235 |
| Average | 94.05 | 155 |
(Source: GuruFocus Premium)
Over the past year, ADBE’s profitability has been in the top 6% of peers.
- Adobe has a real chance at a 10/10 profitability rank in the next few years
- which would make it a 100% quality Ultra SWAN
- joining MA as the 2nd perfect quality company on the Masterlist
- reducing its good buy price to fair value
Since shifting to a subscription business model wide moat Adobe’s profitability has soared to record highs.
- 30% net margins
- 38% cash return on invested capital
- 44% free cash flow margin (top 1% of all companies on earth)
Adobe Profit Margin Consensus Forecast
| Year | FCF Margin | EBITDA Margin | EBIT (Operating) Margin | Net Margin | Return On Capital Expansion |
Return On Capital Forecast |
| 2020 | 41.2% | 48.8% | 42.9% | 38.1% | 1.01 | |
| 2021 | 43.7% | 51.0% | 46.0% | 38.0% | TTM ROC | 285.65% |
| 2022 | 41.8% | 48.7% | 44.9% | 36.2% | Latest ROC | 295.44% |
| 2023 | 42.0% | 48.9% | 45.5% | 37.0% | 2025 ROC | 287.97% |
| 2024 | 43.1% | 49.4% | 46.4% | 37.8% | 2025 ROC | 297.84% |
| 2025 | NA | NA | NA | NA | Average | 292.91% |
| 2026 | NA | NA | NA | NA | Industry Median | 15.48% |
| 2027 | NA | NA | NA | NA | ADBE/Industry Median | 18.92 |
| Annualized Growth | 1.09% | 0.30% | 1.96% | -0.23% | NA | NA |
| Annualized Growth (Ignoring Pandemic | -0.45% | -1.06% | 0.27% | -0.24% | Vs. S&P | 20.06 |
(Source: FactSet Research Terminal)
Adobe’s margins are expected to remain stable over time or even modestly increase.
Return on capital is pre-tax profit/operating capital (the money it takes to run the business).
- Joel Greenblatt’s gold standard proxy for quality and moatiness – Adobe’s ROC is expected to remain stable at 28X its industry norm and 20X more than the S&P 500.
- according to one of the greatest investors in history, one of the widest moat and highest quality companies on earth.
- 20X higher quality than the average S&P 500 company
- 19X higher quality than the average software company
For each $1 it takes to run the business ADBE is generating nearly $3 in annual pre-tax profit.
- investments in the business pay for themselves in about 4 months vs. 7 years for the S&P 500
Adobe’s ROC has been relatively stable for 30 years. And increased significantly since the shift to a subscription business model in 2013.
- confirming a wide and stable moat
Adobe Dividend/Buyback Potential Consensus Forecast
| Year | Dividend Consensus | FCF/Share Consensus | Retained (Post-Dividend) FCF | Buyback Potential | Debt Repayment Potential |
| 2021 | $0.00 | $14.32 | $6,759 | 3.32% | 163.9% |
| 2022 | $0.00 | $15.80 | $7,458 | 3.66% | 180.9% |
| 2023 | $0.00 | $18.31 | $8,642 | 4.24% | 209.6% |
| 2024 | $0.00 | $20.30 | $9,582 | 4.71% | 232.4% |
| 2025 | $0.00 | $24.02 | $11,337 | 5.57% | NA |
| 2026 | $0.00 | $27.11 | $12,796 | 6.28% | NA |
| 2027 | $0.00 | $30.60 | $14,443 | 7.09% | NA |
| Total 2021 Through 2027 | $0.00 | $150.46 | $71,017.12 | 34.88% | 1722.46% |
| Annualized Rate | NA | 13.49% | 13.49% | 13.49% | NA |
(Source: FactSet Research Terminal)
Adobe’s potential for buybacks is incredible.
$71 billion in retained cash flow could potentially buyback over 30% of shares or repay its existing debt nearly 20X over.
Adobe Buyback Consensus Forecast
| Year | Consensus Buybacks ($ Millions) | % Of Shares (At Current Valuations) | Market Cap |
| 2022 | $4,115.0 | 2.0% | $203,595 |
| 2023 | $2,865.0 | 1.4% | $203,595 |
| 2024 | $3,400.0 | 1.7% | $203,595 |
| Total 2022-2024 | $10,380.00 | 5.1% | $203,595 |
| Annualized Rate | 1.73% | Average Annual Buybacks | $3,460.00 |
(Source: FactSet Research Terminal)
Adobe began buying back stock consistently in 2013.
- 0.8% CAGR net buyback rate
- that’s expected to increase by 2.5X
- and management is accelerating buybacks right now due to the bear market
| Time Frame (Years) | Net Buyback Rate | Shares Remaining | Net Shares Repurchased |
| 5 | 0.8% | 96.06% | 3.94% |
| 10 | 0.8% | 92.28% | 7.72% |
| 15 | 0.8% | 88.65% | 11.35% |
| 20 | 0.8% | 85.16% | 14.84% |
| 25 | 0.8% | 81.81% | 18.19% |
| 30 | 0.8% | 78.59% | 21.41% |
(Source: DK Research Terminal, Ycharts)
If Adobe merely continues its historical buyback rate it could repurchase 21% of its stock over the next 30 years.
- deliver 21% higher value/share not counting future growth
| Time Frame (Years) | Net Buyback Rate | Shares Remaining | Net Shares Repurchased |
| 5 | 1.7% | 91.64% | 8.36% |
| 10 | 1.7% | 83.99% | 16.01% |
| 15 | 1.7% | 76.97% | 23.03% |
| 20 | 1.7% | 70.54% | 29.46% |
| 25 | 1.7% | 64.64% | 35.36% |
| 30 | 1.7% | 59.24% | 40.76% |
(Source: DK Research Terminal, Ycharts)
At the rate analysts actually expect ADBE to buy back stock it could reduce its share count by 41% over the next three decades.
Reason Two: Strong Growth Potential For Decades To Come
Adobe has a $205 billion addressable market that’s growing at over 30% per year.
Adobe Growth Spending Consensus Forecast
| Year | SG&A (Selling, General, Administrative) | R&D | Capex | Total Growth Spending | Sales | Growth Spending/Sales |
| 2020 | $4,172 | $1,712 | $419 | $6,303 | $12,868 | 48.98% |
| 2021 | $4,927 | $1,984 | $330 | $7,241 | $15,785 | 45.87% |
| 2022 | $5,629 | $2,446 | $416 | $8,491 | $17,867 | 47.52% |
| 2023 | $6,354 | $2,794 | $467 | $9,615 | $20,515 | 46.87% |
| 2024 | NA | $3,311 | $544 | NA | $23,151 | NA |
| Annualized Growth | 15.05% | 17.93% | 6.74% | 15.12% | 15.81% | -1.46% |
| Total Spending 2020 to 2023 | $21,082 | $8,936 | $1,632 | $31,650 | 52.55% |
(Source: FactSet Research Terminal)
Adobe is growing growth spending at 15% annually, a 53% consensus increase from 2020 to 2023.
- while earning 37% cash returns on invested capital
What do analysts expect that $32 billion in growth spending to generate for investors?
Adobe Medium-Term Growth Consensus Forecast
| Year | Sales | Free Cash Flow | EBITDA | EBIT (Operating Income) | Net Income |
| 2020 | $12,868 | $5,308 | $6,278 | $5,521 | $4,903 |
| 2021 | $15,785 | $6,893 | $8,047 | $7,259 | $6,003 |
| 2022 | $17,867 | $7,464 | $8,704 | $8,018 | $6,464 |
| 2023 | $20,515 | $8,619 | $10,027 | $9,334 | $7,596 |
| 2024 | $23,151 | $9,974 | $11,431 | $10,733 | $8,740 |
| 2025 | NA | $11,320 | NA | NA | NA |
| 2026 | NA | $12,905 | NA | NA | NA |
| 2027 | NA | $14,712 | NA | NA | NA |
| Annualized Growth | 15.81% | 15.68% | 16.16% | 18.08% | 15.55% |
| Annualized Growth (Ignoring Pandemic | 13.62% | 13.47% | 12.41% | 13.92% | 13.34% |
(Source: FactSet Research Terminal)
Adobe is one of the fastest-growing Ultra SWANs on earth.
| Metric | 2020 Growth | 2021 Growth Consensus | 2022 Growth Consensus | 2023 Growth Consensus |
2024 Growth Consensus |
| Sales | 17% | 24% | 14% | 15% | 13% |
| EPS | 28% | 24% | 9% | 18% | 15% |
| Operating Cash Flow | 31% | 27% | 10% | 16% | 18% |
| Free Cash Flow | 31% | 31% | 9% | 16% | 14% |
| EBITDA | 27% | 35% | 33% | 14% | 14% |
| EBIT (operating income) | 33% | 39% | 39% | 16% | 15% |
(Source: FAST Graphs, FactSet Research Terminal)
Adobe’s top and bottom lines are expected to grow at robust rates for the foreseeable future.
Adobe Long-Term Growth Outlook
- 14.2% to 16.9% CAGR growth consensus range
- 13.4% to 20% CAGR analyst growth forecast range
How accurate are analyst growth forecasts for Adobe?
Since switching to the subscription service model, ADBE has never missed two-year forecasts.
- smoothed and adjusted margin of errors 5% to the downside (hasn’t happened yet) and 20% to the upside
- 13% to 21% CAGR margin-of-error adjusted growth consensus range
- 70% statistical probability that Adobe grows at 13% to 21% over time
- the individual analyst growth range
Adobe has grown at 16% to 38% CAGR over the last 20 years.
The shift to a subscription business model accelerated growth significantly.
Analysts expect ADBE to grow at a similar rate as in the last 20 years.
- 32% CAGR since switching to the subscription model
- which is why we use the 33 to 44 20 year historical PE range and not just the 41 to 44 PE range since 2013 (because of slower growth though far more reliable cash flows)
Reason Three: A Wonderful Company At A Fair Price
For 20 years, with interest rates ranging from 0.5% to 5.25%, billions of investors have paid 33 to 44X earnings for Adobe.
- 10-year yield range from 0.5% to 5.25% (unless 10-year yields rise above 5.3% ADBE’s fair value PE should remain 33+)
- growth range from 16% to 38% CAGR
- 91% statistical probability that Adobe’s intrinsic value is between 33 and 44X earnings
- 44X since its switch to a subscription model
| Metric | Historical Fair Value Multiples (14-Years) | 2020 | 2021 | 2022 | 2023 |
12-Month Forward Fair Value |
| Earnings | 36.92 | $380.28 | $464.45 | $511.34 | $601.43 | $533.86 |
| Average | $380.28 | $464.45 | $511.34 | $601.43 | $533.86 | |
| Current Price | $460.37 | |||||
|
Discount To Fair Value |
-21.06% | 0.88% | 9.97% | 23.45% | 13.77% | |
| Upside To Fair Value | -17.40% | 0.89% | 11.07% | 30.64% | 15.96% | |
| 2022 PE | 2023 PE | 2021 Weighted EPS | 2022 Weighted EPS | 12-Month Forward PE | 12-Month Average Fair Value Forward PE |
Current Forward PE |
| $13.85 | $16.29 | $10.39 | $4.07 | $14.46 | 36.9 | 31.8 |
(Source: DK Research Terminal)
No long-term investor, who avoided becoming a forced seller for emotional or financial reasons, has ever regretted buying Adobe at 31.8X forward earnings.
- 25.0X cash-adjusted earnings
And I can say with 80% confidence that the best available data we have today indicates today won’t be the first time.
|
Analyst Median 12-Month Price Target |
Morningstar Fair Value Estimate |
| $569.36 (35.0 PE) | $615 (42.5 PE) |
|
Discount To Price Target (Not A Fair Value Estimate) |
Discount To Fair Value |
| 19.14% | 25.14% |
|
Upside To Price Target (Not Including Dividend) |
Upside To Fair Value (Not Including Dividend) |
| 23.67% | 33.59% |
(Source: DK Research Terminal, FactSet, Morningstar)
Analysts expect Adobe to deliver 24% total returns in the next year alone.
- 10% more than the S&P 500
- except that Adobe is growing 2X as fast and is 34% less overvalued
Of course, I don’t care about 12-month return estimates, I care about whether Adobe’s margin of safety sufficiently compensates investors for its risk profile.
| Rating | Margin Of Safety For Low-Risk 13/13 Ultra SWAN Quality Companies | 2022 Price | 2023 Price |
12-Month Forward Fair Value |
| Potentially Reasonable Buy | 0% | $511.34 | $601.43 | $533.86 |
| Potentially Good Buy | 5% | $485.77 | $571.36 | $507.17 |
| Potentially Strong Buy | 15% | $434.64 | $511.21 | $453.78 |
| Potentially Very Strong Buy | 25% | $364.33 | $451.07 | $400.40 |
| Potentially Ultra-Value Buy | 35% | $332.37 | $390.93 | $347.01 |
| Currently | $460.49 | 9.94% | 23.43% | 13.74% |
| Upside To Fair Value (Not Including Dividends) | 11.04% | 30.61% | 15.93% |
(Source: DK Research Terminal)
Adobe has recovered from its recent 10% post-earnings crash but remains a potentially good buy for anyone comfortable with its risk profile.
Risk Profile: Why Adobe Isn’t Right For Everyone
There are no risk-free companies and no company is right for everyone. You have to be comfortable with the fundamental risk profile.
What Could Cause Adobe’s Investment Thesis To Break
- safety falls to 40% or less: management’s growth plans implode
- balance sheet collapses
- business model completely disrupted
- growth outlook falls to less than 10% for seven years
- ADBE’s role in a portfolio is to deliver long-term 10+% returns with minimal fundamental risk
How long it takes for a company’s investment thesis to break depends on the quality of the company.
| Quality |
Years For The Thesis To Break Entirely |
| Below-Average | 1 |
| Average | 2 |
| Above-Average | 3 |
| Blue-Chip | 4 |
| SWAN | 5 |
| Super SWAN | 6 |
| Ultra SWAN | 7 |
These are my personal rule of thumb for when to sell a stock if the investment thesis has broken.
ADBE is highly unlikely to suffer such catastrophic declines in fundamentals.
Adobe’s Risk Profile Summary
- market share risk (it’s the industry leader but has about 2,500 global rivals)
- margin risk (from faster-growing parts of the business being lower margin, cost-cutting must come in as expected )
- M&A execution risk (larger deals are riskier and tend to have higher multiples
- labor retention risk (tightest job market in over 50 years and finance is a high paying industry)
- buyback valuation risk
- cybersecurity risk: hackers and ransomware
- currency risk (49% of sales from overseas)
Recession Watch
While ADBE’s subscription business model is a lot more resistant to recessions than prior to 2013, a recession could slow growth temporarily and cause the stock price to plunge.
The bond futures market expects the 10-2 yield curve to invert in June and a mild recession to begin around February 2024.
| Bonds | Yield |
| 3-Month Treasury Yield | 0.55% |
| 2-Year Treasury Yield | 2.28% |
| 10-Year Treasury Yield | 2.32% |
| 10-3M Curve (Most Accurate Recession Forecasting Tool) | 1.77% (Steadily Falling For Several Weeks) |
| 10-2 Curve (Most Popular Yield Curve Followed By Wall Street) | 0.04% |
| Bond Futures Pricing In Inversion | June 2022 |
| Bond Futures Pricing In Recession Start | January 2024 |
| Potential Historically Average Recession Start If Curve Inverts Now (March 31st, 2022) | October 31st, 2023 |
| Potential Historically Average Bear Market Start If Curve Inverts Now (March 31st, 2022) | September 8th, 2023 |
(Source: DK S&P 500 Valuation And Total Return Tool)
The 10-2 curve is the most closely watched by Wall Street but a study from the NY Fed finds that the 10-3 curve is the most accurate at forecasting recessions.
Currently, the bond market is mildly concerned about recession risk and we are monitoring the situation closely each day.
- A recession scare could occur in 2022
- yield curve + BaR economic grid makes it very likely that we’ll see a recession coming at least 10 months out
How do we quantify, monitor, and track such a complex risk profile? By doing what big institutions do.
Material Financial ESG Risk Analysis: How Large Institutions Measure Total Risk
- 4 Things You Need To Know To Profit From ESG Investing
- What Investors Need To Know About Company Long-Term Risk Management (Video)
Here is a special report that outlines the most important aspects of understanding long-term ESG financial risks for your investments.
- ESG is NOT “political or personal ethics based investing”
- it’s total long-term risk management analysis
“‘ESG is just normal risk by another name.’ Simon MacMahon, head of ESG and corporate governance research, Sustainalytics” – Morningstar
“ESG factors are taken into consideration, alongside all other credit factors, when we consider they are relevant to and have or may have a material influence on creditworthiness.” – S&P
ESG is a measure of risk, not of ethics, political correctness, or personal opinion.
S&P, Fitch, Moody’s, DBRS (Canadian rating agency), AMBest (insurance rating agency), R&I Credit Rating (Japanese rating agency), and the Japan Credit Rating Agency have been using ESG models in their credit ratings for decades.
- credit and risk management ratings make up 41% of the DK safety and quality model
- dividend/balance sheet/risk ratings make up 82% of the DK safety and quality model
Adobe Long-Term Risk Management Consensus
| Rating Agency | Industry Percentile |
Rating Agency Classification |
| Morningstar/Sustainalytics 20 Metric Model | 98.6% |
13.4/100 Low-Risk |
| Reuters’/Refinitiv 500+ Metric Model | 97.3% | Excellent |
| S&P 1,000+ Metric Model | 68.0% |
Above-Average, Stable Trend |
| Just Capital 19 Metric Model | 95.5% | Exceptional |
| FactSet | 30.0% |
Below-Average, Negative Trend |
| Morningstar Global Percentile (All Rated Companies) | 96.0% | Exceptional |
| Just Capital Global Percentile (All Rated Companies) | 97.8% | Exceptional |
| Consensus | 83% |
Low-Risk, Very Good, Industry Leader, Stable Trend |
(Sources: Morningstar, Reuters’, JustCapital, S&P, FactSet Research)
Adobe’s Long-Term Risk Management Is The 51st Best In The Master List (90th Percentile)
- Dividend Champions: 57th percentile – average
- Monthly Dividend Stocks: 60th percentile – above-average
- Hyper-Growth stocks: 61st percentile – above-average
- Master List average: 62nd percentile -above-average
- Dividend Kings: 63rd percentile -above-average
- Average Blue-Chip Quality Company: 64th percentile – above-average
- Dividend Aristocrats: 67th percentile -above-average
- Ultra SWANs: 71st percentile – good
- Foreign Dividend Stocks: 75th percentile – good
- Strong ESG Stocks: 78th percentile – good bordering on very good
- Adobe: 83rd percentile – very good
ADBE’s risk-management is in the top 10% of the world’s highest quality companies and similar to that of such other companies as
- Colgate-Palmolive (CL) dividend king
- Lockheed Martin (LMT)
- Pepsi (PEP) – dividend king
- Blackrock (BLK)
- Lowe’s (LOW) – dividend king
- Novo Nordisk (NVO) – global aristocrat
- W. W. Grainger (GWW)
- AbbVie (ABBV) – dividend king
- British American Tobacco (BTI)
- Cummins (CMI)
- Mastercard (MA)
- Merck (MRK)
The bottom line is that all companies have risks, and Adobe is very good at managing theirs.
How We Monitor Adobes’ Risk Profile
- 32 analysts
- 2 credit rating agencies
- 6 total risk rating agencies
- 38 experts who collectively know this business better than anyone other than management
When the facts change, I change my mind. What do you do sir?” – John Maynard Keynes
There are no sacred cows at iREIT or Dividend Kings. Wherever the fundamentals lead we always follow. That’s the essence of disciplined financial science, the math for retiring rich and staying rich in retirement.
Bottom Line: Adobe Is One Of The World’s Greatest Growth Stocks And Could Double In 5 Years
I can’t tell you what’s going to happen with the market in the next week, month, or even the rest of the year, no one can.
- anyone who makes predictions with absolute certainty is a fool, charlatan, or trying to sell you something
- sometimes it’s all three
But here’s what I can tell you about Adobe.
Reasons To Potentially Buy ADBE
- 99% quality low-risk 13/13 Ultra SWAN quality hyper-growth software as a service company
- fortress balance sheet (100% safety score)
- 14% historically undervalued (potential good buy)
- Fair Value: $533.86
- 31.8 PE vs. 33 to 44 historical
- 25.0 cash-adjusted earnings (EV/EBITDA)
- A+ stable outlook credit rating = 0.6% 30-year bankruptcy risk
- risk management consensus 83rd industry percentile = Very Good
- 13% to 21% CAGR margin-of-error growth consensus range
- 16.5% CAGR median growth consensus
- 5-year consensus total return potential: 9% to 19% CAGR
- base-case 5-year consensus return potential: 13% CAGR (3X market consensus)
- consensus 12-month total return forecast: 24% (35.0 PE, historically reasonable)
- Fundamentally Justified 12-Month Returns: 16% CAGR
Adobe isn’t just a great company, it’s one of the greatest growth stocks in history.
Adobe isn’t just a high-quality company, it’s potentially the 4th highest quality on earth.
- and 19X higher quality than the average software company according to Joel Greenblatt
Adobe has already made many investors millionaires, and analysts think it is likely to keep minting millionaires for decades to come.
Adobe isn’t just a dominant industry leader, it’s THE industry leader in a $205 billion market that’s growing at over 30% per year.
Adobe is exactly the kind of smart long-term growth investment that can change your life over years and decades.
- potentially 6X the market’s returns in the next 30 years
Fortunes are made by buying right and holding on.” – Tom Phelps, 100 to 1 In The Stock Market
Adobe today is almost certainly an example of “buying right” and a great way to make your own luck on Wall Street.
Is the market a casino? You bet it is.
The house always wins in the end. And if you buy the world’s best companies, at reasonable to attractive valuations, and then own them for decades, you become the house.
Or to put it another way, you stop praying for luck on Wall Street and start making your own.
“Luck is what happens when preparation meets opportunity.” – Roman philosopher Seneca the younger
Want to know how to retire in safety and splendor?
By buying right and holding on.
And today that means potentially buying Adobe, one of the best growth stocks in the world, for your diversified and prudently risk-managed portfolio.
Be the first to comment