


gaetan stoffel/iStock via Getty Images
Introduction
About a year ago, our team studied macro trends and cycles in the Bitcoin (BTC-USD) market. Such macro trends and cycles exists also in other markets ranging from the stock markets to the commodities market. The understanding of macro trends and cycles has helped us navigate the markets effectively and efficiently.
For instance, the economic cycle typically lasts between 8 to 10 years where an economic expansion is followed by a recession. The semiconductor market is also cyclical, where new-emerging technologies cause a sharp surge in semiconductors but manufacturers need 4 years to ramp up production to meet demand before prices normalize again.
With the same understanding, we examined and presented Bitcoin’s decade-old cycle known as the Bitcoin Halving Cycle about a year ago. Here is a snippet of how we expected Bitcoin to play out:
Bitcoin’s past 2 bear markets showed that the 5 sequences of events over the 1-year bear market are as follows:
- Reversal pattern
- 50% decline from peak
- Rebound back to 20% from peak
- Another decline to 70% from peak
- Bottom out at 85% from peak
We followed up with an analysis stating that economic fundamentals align and support Bitcoin’s cycle. In short, the market flowed out of risky assets to safe assets but Bitcoin isn’t a safe haven.
The 3 catalysts are inflation, the Fed’s tapering, and interest rate hike.
Inflation fears were the cause of the first wave of the stock market selloff in February 2021. Despite the Fed’s constant assertion that inflation is transitory, inflation was constantly rising before hitting 10% in November. In December 2021, the Fed finally responded that inflation might not be transitory after all before guiding 8 interest rate hikes over the next 2 years and plans to pick up tapering efforts in the immediate future. It is not until the Fed unexpectedly announced (a month later) that even tighter policies may be required to control inflation.
Finally, a strong labor market was reported in January 2022, which supports the narrative of much tighter policies for 2022. Do not underestimate this statistic because the Fed explicitly stated that tapering and interest rate hikes would be considered only after making significant progress toward full employment.
This series of events led to the current cascade of stock market selloffs, which also spilled over to the crypto market.
Now that Bitcoin has completed 4 out of the 5 predicted bear market sequences of events, this article aims to discuss where Bitcoin is in this macro trend and cycle and the suggested course of action.
Bitcoin’s Position and The Current Cycle’s Imperfections
A Bitcoin cycle typically lasts for 4 years. A halving event is immediately followed by a 1-year bull market, then followed by a 1-year bear market before slowly recovering to the previous peak across 2 years. Fig 1 depicts such a cycle.
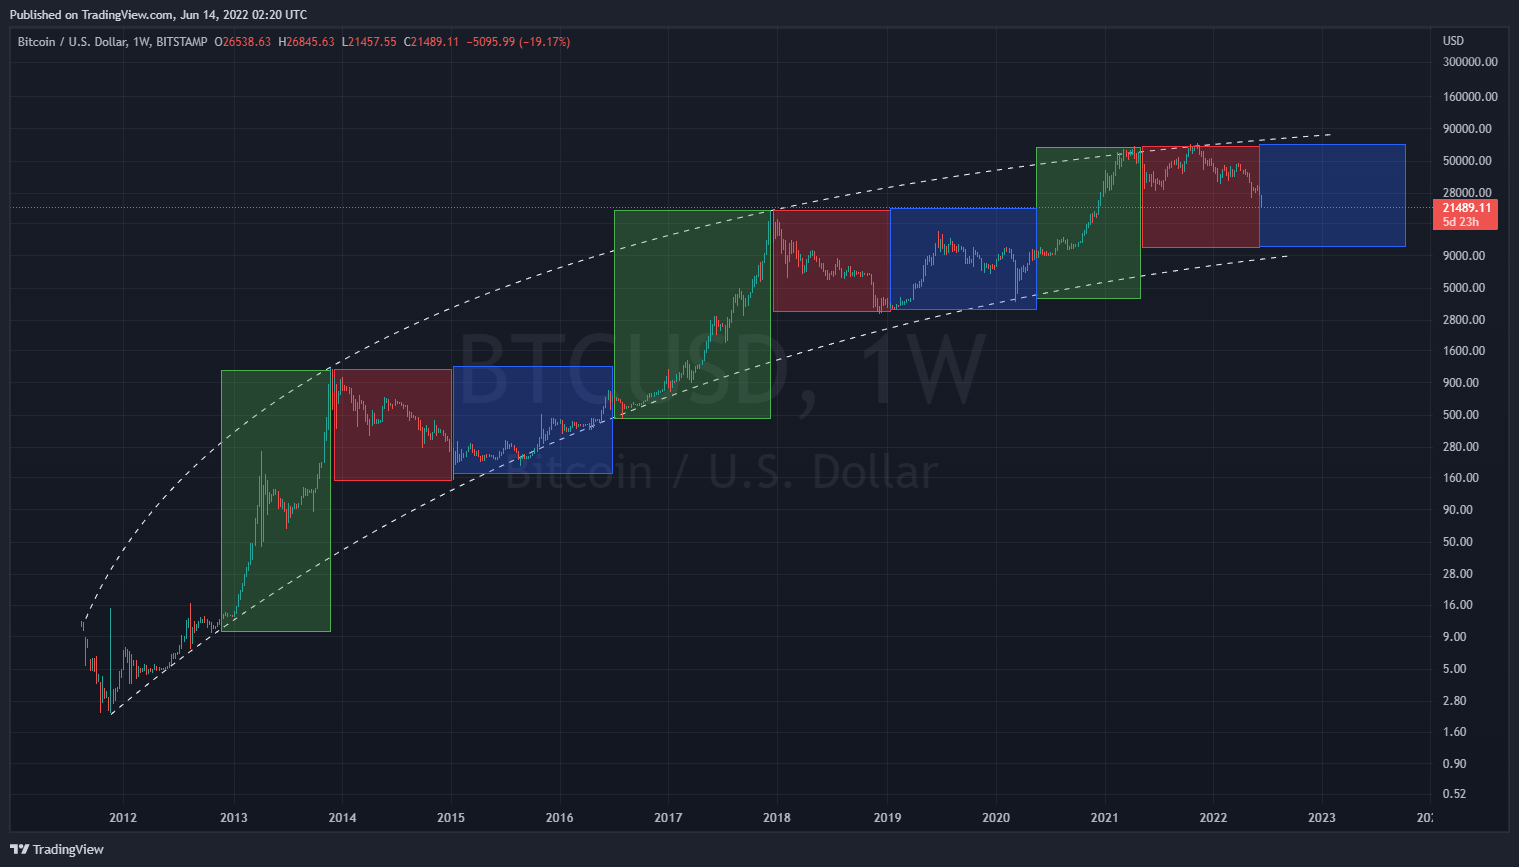
Fig 1. Bitcoin’s Decade-old Halving Cycle (Author, TradingView)
According to the previous 2 bear markets marked in red boxes, it is observable that a bear market follows 5 specific sequences of events. Aside from the 5 sequences of events during a bear market, there are also other “hard rules” in a bear market.
- A bear market only lasts for 1 year. By this definition, Bitcoin should now already be in the recovery stage. Does this mean we’re in the recovery stage already?
- Bitcoin never goes below the previous peak. Bitcoin is now priced right at the previous peak of $20,000. Does this mean Bitcoin has bottomed out?
- Bitcoin’s bottom occurs during the bear market and not after. Since we’re now out of the bear market and Bitcoin did not break below its previous peak, has Bitcoin bottomed out?
On the other hand, Bitcoin has only completed 4 out of the 5 sequences of events:
- Reversal pattern -> Head & Shoulders + Wyckoff Distribution Pattern[Checked @ May 2021]
- 50% decline from peak -> Reach $30k [Checked @ July 2021]
- Rebound back to 20% from peak -> Reach $54k (overshot) [Checked @ September 2021]
- Another decline to 70% from peak -> Reach $21k [Checked @ June 2022]
- Bottom out at 85% from peak -> Reach $10.5k
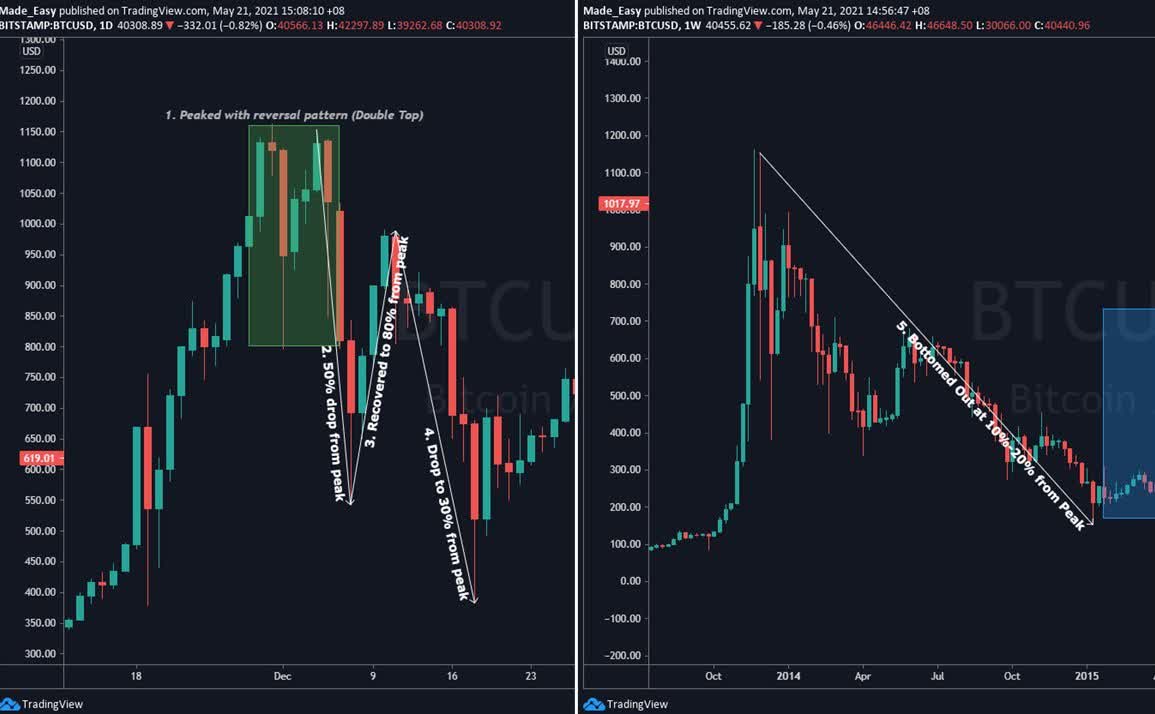
Figure 2: 5 sequences of events during Bitcoin’s 2014 bear market (Author, TradingView)
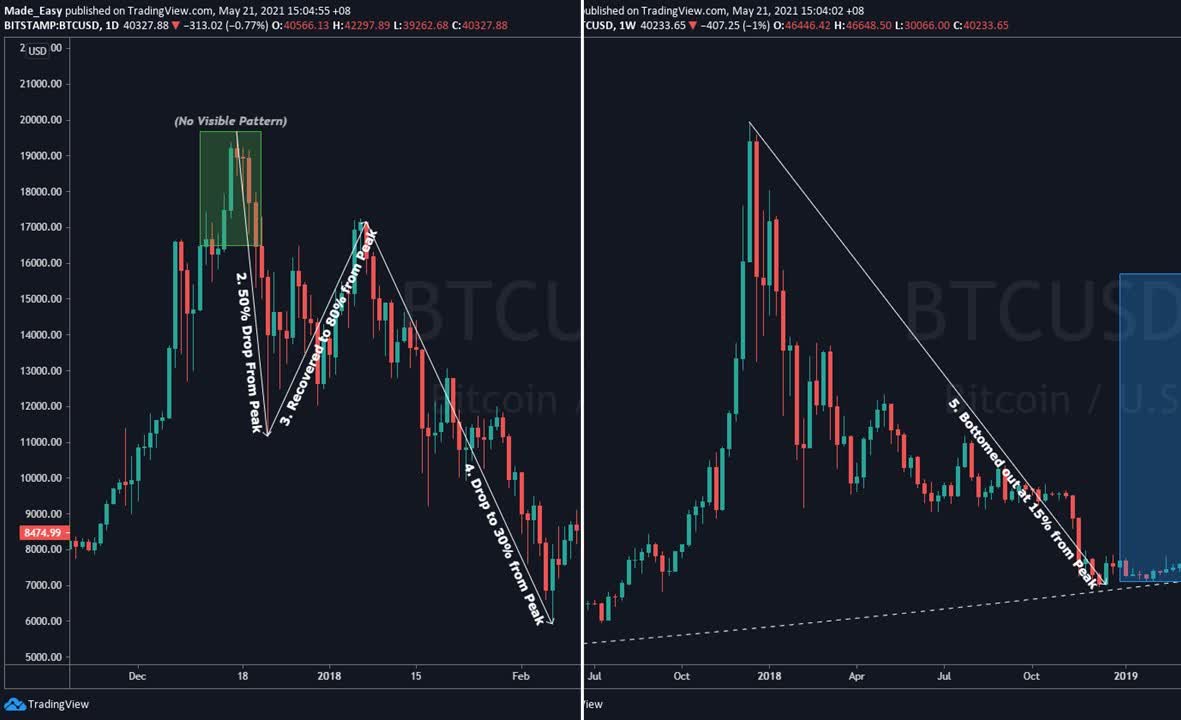
Figure 3: 5 sequences of events during Bitcoin’s 2018 bear market (Author, Trading View)
How should we approach Bitcoin in the current cycle?
Firstly, the 1-year bull market isn’t a “hard rule”. Bitcoin’s first halving bull market in 2013 lasted 1 year while Bitcoin’s second halving bull market in 2016 lasted 1.5 years. Therefore, we can expect a bull market between 1 year to 1.5 years. Our previous assumption was Bitcoin’s bull market in the current cycle will span only 1 year. In hindsight, we can see that the bull market is actually 1.5 years as Bitcoin reached a new all-time high in Nov 2021.
With this new assumption, we can see that we’re still in a bear market (Fig 4). Not much has changed in terms of the 5 sequences of events.
- Reversal pattern -> Double Top[Checked @ Nov 2021]
- 50% decline from peak -> Reach $34k [Checked @ Jan 2022]
- Rebound back to 20% from peak -> Reach $54k (Missed by 10%)[Checked @ September 2021]
- Another decline to 70% from peak -> Reach $21k[Checked @ June 2022]
- Bottom out at 85% from peak -> Reach $10.5k
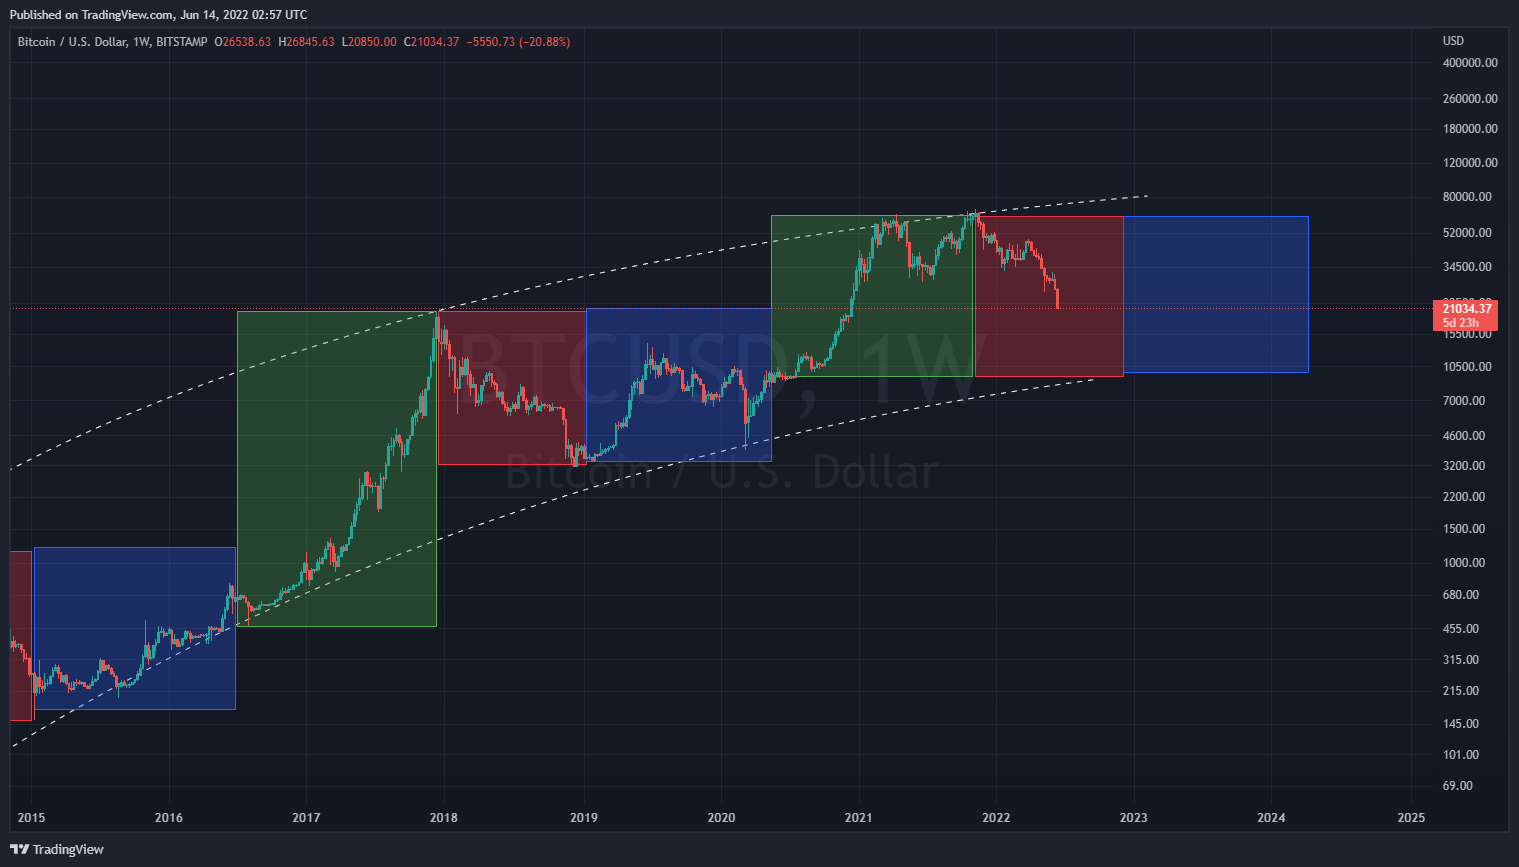
Fig 4. Bitcoin Halving Cycle 2022 (Author, TradingView)
Now what’s left is the final leg down to $10k. So which rule will hold? Will Bitcoin uphold its “never drop below previous peak” rule and bottomed out now? Or will Bitcoin break its “never drop below previous peak” rule to complete its 5th sequence of events to conclude its bear market? Let’s explore.
To break or not to break?
Bitcoin has historically moved independently of the stock market. During Bitcoin’s 2014 bear market, the stock market (SPY) is booming. The same goes for Bitcoin’s 2018 bear market. Figure 5 represents the fluctuating correlation between Bitcoin and the S&P500 implying that Bitcoin and the stock market are independent.
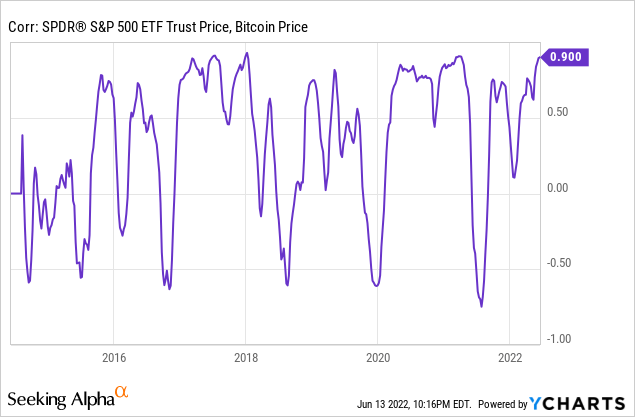
Fig 5. Correlation between Bitcoin and SPY (YCharts)
However, whenever there’s a flash crash in the stock market, the crash will spill over to Bitcoin. For instance, the Covid crash in March 2020 (Fig 6) and the Christmas Eve crash in 2018 (Fig 7). In such a case, Bitcoin became highly correlated to the stock market.
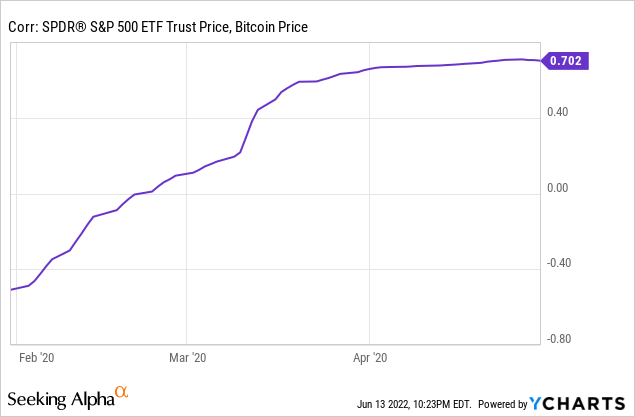
Fig 6. Bitcoin became highly correlated to the Stock Market during Covid crash (YCharts)
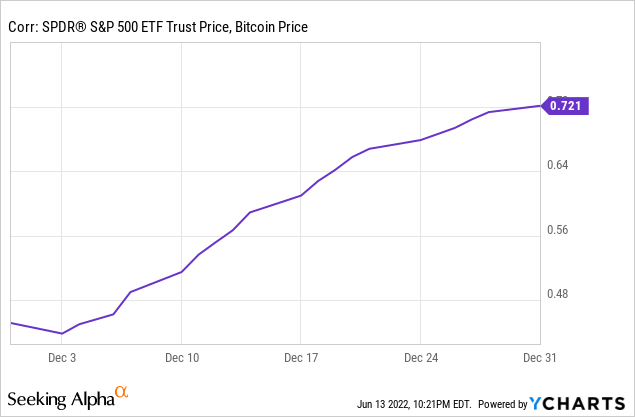
Fig 7. Bitcoin became highly correlated to the stock market during 2018 crash (YCharts)
The current economic condition is similar to 2018’s crash. The S&P 500 fell more than 9% in December 2018 because of expectations of tightening monetary policy and a Fed-induced recession. Of course, the intensifying trade war between the U.S. and China also made it worse.
Today, the Fed has already declared its intention to raise interest rates, and the market is concerned about a Fed-induced recession. The economic backdrop is similar to that of the 2018 crash. Layoffs of scale are happening in both the private sector and the public sector. Of course, the Russia-Ukraine war made inflation worse.
As Bitcoin tends to become highly correlated to the stock market during a crash, we think that Bitcoin will have to forgo its “never go below the previous peak” rule.
Another reason why we think that Bitcoin will break below its previous peak is selling pressure from miners. Bitcoin mining companies have a total mining cost of more than $30,000 per BTC on average. This is with reference to Bitcoin mining companies including Riot Blockchain (RIOT), HUT 8 (HUT) Core Scientific (CORZ), Stronghold Digital Mining (SDIG), Bitfarms (BITF), and others. If Bitcoin sustainably drops below the total mining cost, Bitcoin mining won’t remain a viable business. In a recent interview, Kevin O’Leary, also known as Mr. Wonderful, stated it is not profitable for power generating facilities (hydropower to be exact) to mine Bitcoin if Bitcoin falls below $30,000, and the contingency plan for power generating facilities is to host data centers instead.
The goal of Bitcoin mining companies is to mine and retain as much Bitcoin as possible. However, Bitcoin mining companies do need to sell Bitcoins to cover mining costs. Hence, the lesser Bitcoin is worth, the more miners need to sell to cover costs. One might argue that miners could get loans. For instance, Marathon Digital Holdings (MARA) raise $745mil by issuing convertible notes. But one has to take note that MARA issued convertible notes while Bitcoin is near All-Time High in 2021Q4. It’ll be substantially more difficult, if not costly, to raise such money.
Hence, overall, it is more probable for Bitcoin to complete its final leg down to $10,500 than to bottom out above its previous peak at $20,000.
Actions for Consideration
We reiterate that we do not short. Hence, we’ll only be looking for good entry points to buy. Given that $20,000 is Bitcoin’s previous peak which coincides with one of the critical support levels in the bear market 5 sequences of events, $20,000 is a good entry point. This is the entry price where we’ll allocate another one-third of our capital set aside for Bitcoin and has explicitly stated in our previous coverage back in January 2022:
Our second point of entry will be the $20,000 price level. This level coincides with the peak from Bitcoin’s bull market in 2017. It also coincides with the 70% decline dictated by the 4th sequence of events in a Bitcoin bear market.
Another reason for entering at this price is that the $10,500 price level is not guaranteed. Recall that Bitcoin will either complete its 5th sequence of events to reach $10,500 or uphold its “never break below previous peak rule”. It is just that forgoing the “never break below previous peak” rule is more probable to us.
We’re still following our suggested course of action by dollar-cost-averaging into Bitcoin at $30k, $20k, and $10k.
With the help of the halving cycle, we identified 3 critical support levels to dollar-cost average into Bitcoin: $30,000, $20,000 and $10,000.
If you’re a passive investor with day jobs and other businesses like us, you could minimize risk by spreading out your purchases to each bottom laid out in the 5 expected sequences of events above. For instance, 25% now ($39,500), 25% at the 50% retracement ($32,500), 25% at the 70% retracement ($19,500), 25% at the 85% retracement ($9,750).
Be the first to comment