

Aajan/iStock via Getty Images
Investment Thesis
On its surface, the AAM S&P 500 High Dividend Value ETF (SPDV) is appealing for numerous reasons. It is diversified among sectors, uses a reasonable screen for free cash flow, has a 3% dividend yield, and is generally safer since it holds only large-cap S&P 500 stocks. And, since it’s a high-dividend ETF, its price-earnings ratios will be low since yield and price move in opposite directions. It’s this last point that has served SPDV investors well lately, as the market has turned against high growth, high P/E stocks.
While I remain optimistic, I want to caution against getting too complacent with SPDV’s strategy. There are some yellow flags I want to highlight, namely its estimated revenue and earnings per share growth rates which are among the lowest of all the high-dividend ETFs I track monthly. Moreover, it only launched four years ago, so it’s not nearly as established as other funds. Therefore, I’m rating SPDV as a hold today, and I look forward to taking you through the ETF and explaining my reasons in more detail next.
ETF Overview
Strategy And Fund Basics
SPDV passively tracks the S&P Dividend and Free Cash Flow Yield Index, selecting five stocks from each of the 11 GICS sectors in equal weight based on their dividend and cash flow yields. Definitions are below, but a high free cash flow yield suggests a company is earning enough to fund the dividend, so dividends should be safe.
S&P Dividend and Free Cash Flow Index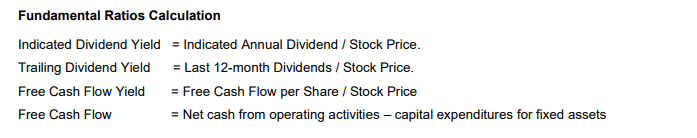
SPDV reconstitutes semi-annually effective at the end of January and July, meaning we have a fresh set of holdings to analyze today. Before I get to the new portfolio, here are some additional statistics for easy reference.
- Current Price: $31.51
- Assets Under Management: $54 million
- Expense Ratio: 0.29%
- Launch Date: November 28, 2017
- Trailing Dividend Yield: 3.09%
- Three-Year Dividend CAGR: 4.26%
- Dividend Payout Frequency: Monthly
- Five-Year Beta: 1.13
- Number of Securities: 55
- Portfolio Turnover: 69.00%
- Assets in Top Ten: 19.71%
- 30-Day Median Bid-Ask Spread: 0.22%
- Tracked Index: S&P Dividend and Free Cash Flow Yield Index
As shown, expenses are slightly elevated at 0.29%, but the 3.09% trailing dividend yield and the monthly payments are nice. All historical dividends were classified as ordinary income, and I’m forecasting SPDV’s to be around 3.50%, which I’ll highlight later.
Sector Exposures And Top Holdings
As mentioned, SPDV follows an equal-weight-by-sector strategy, which works out to be about 9.1% per sector. The minor differences below are simply the result of certain sectors outperforming this month.
SPDV Fund Overview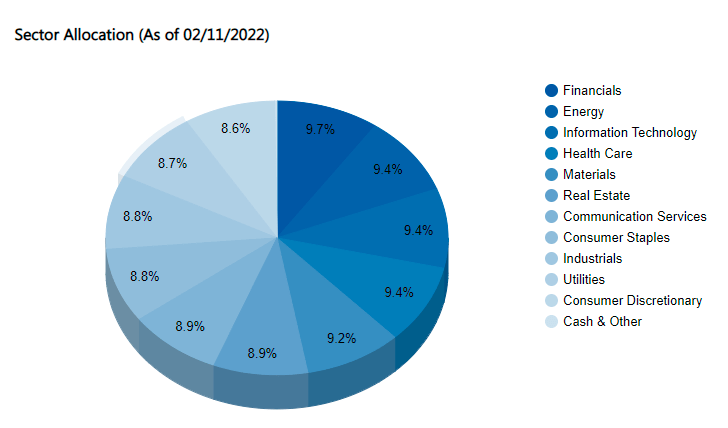
Similarly, the top ten holdings are simply the best performers this February. They include smaller companies like Omnicom Group (OMC) and Seagate Technology (STX), as well as household names like Citigroup (C).
SPDV Fund Overview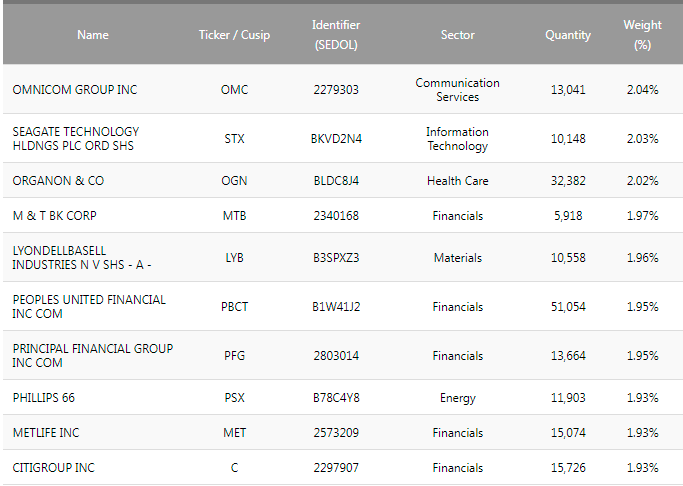
Historical Performance
In its short history, SPDV’s returns have been underwhelming at just 8.79% per year. While it slightly outpaced the SPDR S&P 500 High Dividend ETF (SPYD), it’s trailed the Schwab U.S. Dividend Equity ETF (SCHD) by an annualized 5.69%. Most underperformance was due to a much larger drawdown during the pandemic, which cast doubt on the conventional wisdom that dividends can protect portfolios in downturns. The SPDR S&P 500 ETF (SPY) turned out to be one of the better choices.
Portfolio Visualizer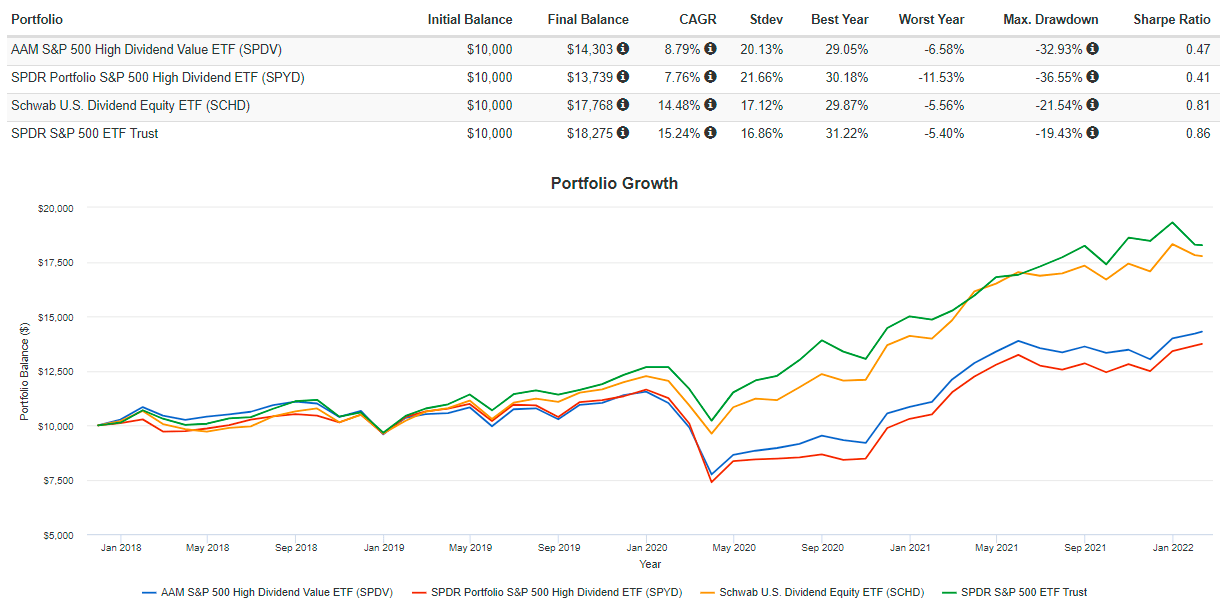
Though SPDV only launched four years ago, S&P Dow Jones Indices provides an additional six years of backtested returns. I’m comfortable relying on this information since accurate data is easy to find for S&P 500 stocks, and it shows that from February 2012 until December 2019, SPDV’s Index performed in line with the S&P 500. Therefore, I think dismissing SPDV solely because of its poor historical performance would be a mistake. Such thinking requires a belief that post-pandemic stock market behavior will repeat, and that’s not my view.
S&P Dow Jones Indices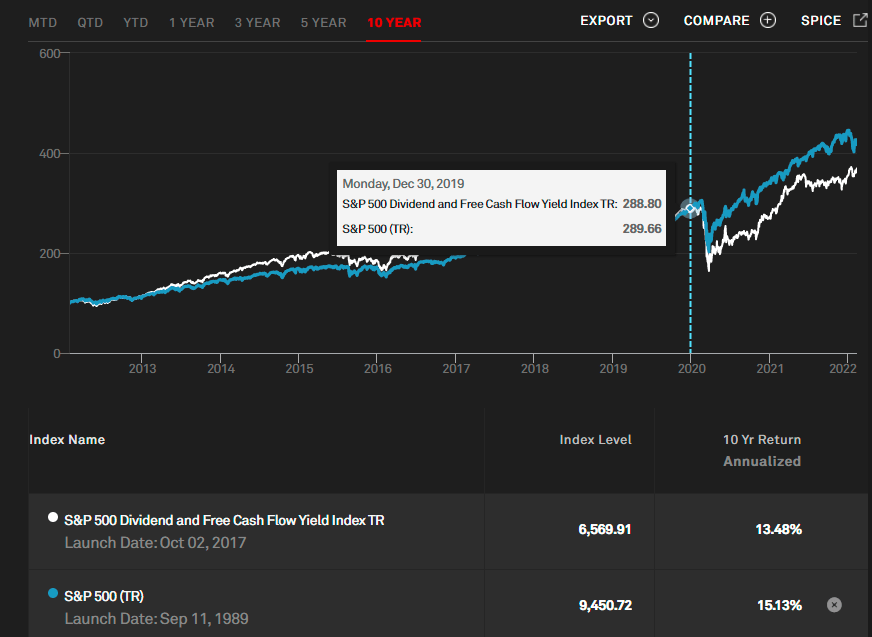
SPDV Analysis
I’ve divided my analysis into three sections. First, I’ll examine SPDV’s current constituents based on their dividend and free cash flow metrics, which should be pretty strong since those are the screens used for selection. Second, I’ll look at valuation and growth, which I expect will be low since it’s primarily a value ETF. Finally, I’ll look at the historical returns of the current portfolio. This last part is essential since SPDV typically has a high portfolio turnover rate, and as such, technical analysis using the fund’s price movements is misleading. As a benchmark, I will be comparing these metrics against the Schwab U.S. Dividend Equity ETF, an excellent fund that offers a similar yield and double-digit dividend growth.
Dividend And Free Cash Flow
To begin, I’ve created this representative sample of SPDV by selecting one stock from its top 20 industries. The table below highlights their dividend yield, dividend growth, and free cash flow yield calculations.
Author Using Data From Seeking Alpha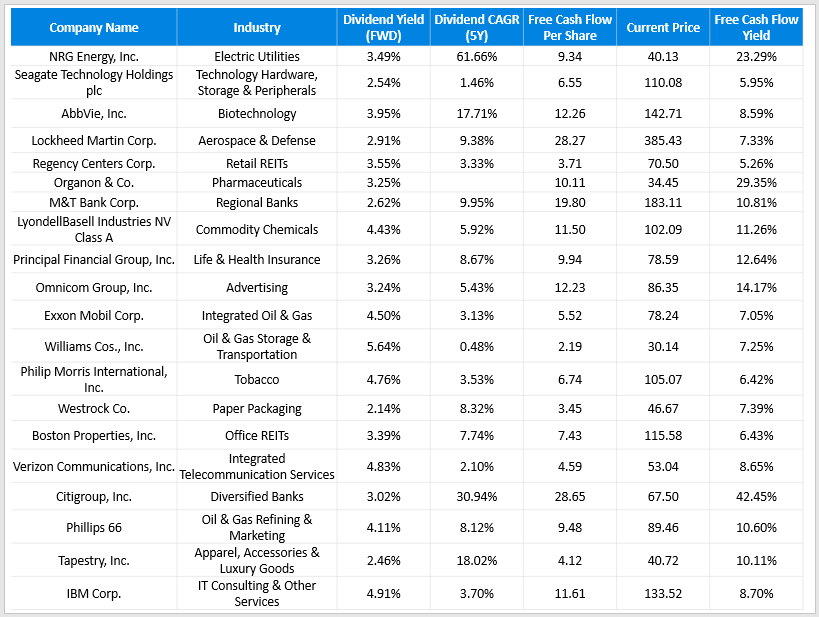
As shown, all companies in this sample do have positive free cash flow per share figures. However, the yields are still low, which speaks to just asset prices being so high in general. Even with this screen, the average Seeking Alpha Value Grade is just a B- compared with a C for SCHD and a D for the S&P 500 Index. It’s still better, and the strategy looks to be correctly executed. Still, I take this as a reminder of how important it is to be cautious with equities in this environment.
Growth And Valuation
The table below looks at the dividend, revenue, and earnings per share growth rates by SPDV’s top 20 industries, which account for 78% of the ETF. I’ve also included the forward price-earnings and trailing price-cash flow ratios to assess valuation.
Author Using Data From Seeking Alpha
Notice how SPDV is slightly more volatile than SCHD as measured by its five-year beta, but it’s about as volatile as the market. The forward dividend yield of 3.85% is a significant change from the fund’s 3.09% trailing yield, which is excellent news for yield seekers. Now, fund expenses of 0.29% have to be subtracted, but assuming there isn’t a major increase in shares outstanding soon, investors should end up with a yield of around 3.50%.
SPDV is consistently behind SCHD on dividend, revenue, and earnings growth rates, though. It is also trading at a slight discount based on forward earnings, but at a substantial discount if using the trailing price to cash flow per share ratio. SPDV has benefited a lot lately from these low valuations, too. Since my buy recommendation in August, it’s outperformed the S&P 500 by 6% and was fifth-best in its category for January.
Technicals: A New Portfolio To Examine
According to my records from my August article, 25 of SPDV’s 55 holdings are new additions, accounting for 46% of the portfolio. It’s significant and is one reason why using an ETF’s price technicals doesn’t make much sense if there’s a high turnover. In my view, it would be misleading to compare SPDV’s price today, which is representative of the current portfolio, with its price last month when it had nearly 50% different holdings.
Technical analysis can still be helpful, but I think it’s better to simulate historical performance using the current portfolio since that’s what investors are buying today. The table below summarizes selected historical price metrics for SPDV’s top 20 holdings.
Author Using Data From Seeking Alpha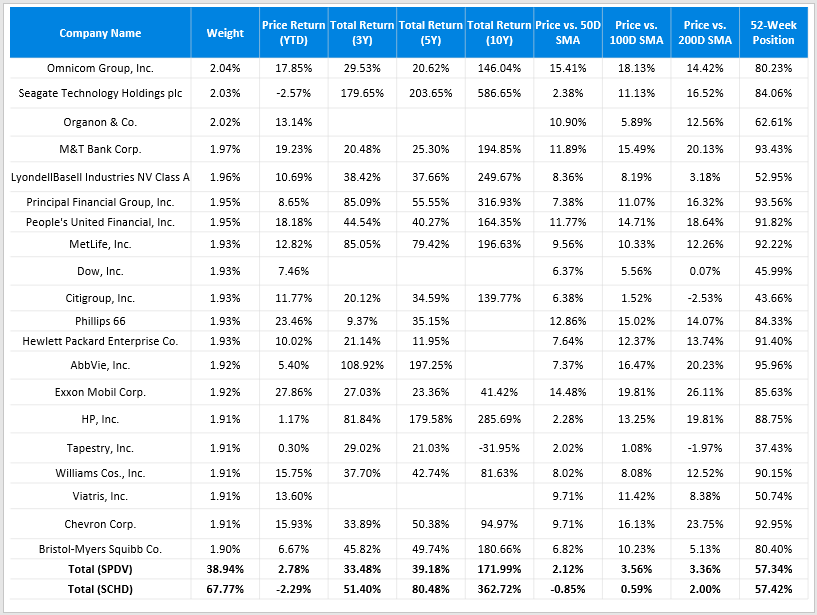
As shown, SPDV has a bit of momentum relative to SCHD, as indicated by its higher price versus 50-day, 100-day, and 200-day moving average prices. It’s also had a better YTD price return (2.78% vs. -2.29%), which is probably a consequence of the market emphasizing fundamentals this year. However, what stands out is the poor longer-term performance as indicated by three-, five-, and ten-year total returns. This means that these companies are cheap and have been cheap for a long time. If market sentiment switches to favor growth again, expect SPDV to underperform the more established SCHD substantially.
Investment Recommendation
SPDV is based on an Index that uses free cash flow yield to select 55 of the best high-dividend stocks in the S&P 500. It follows an equal-weight-by-sector approach that guarantees a certain level of diversification, and it should leave investors with about a 3.50% dividend yield after distributions if bought today. On its surface, it’s an appealing choice.
Like most high-dividend ETFs, its forward price-earnings ratio is low at 15x. This valuation puts it slightly cheaper than SCHD, but a common theme is its lower growth rates on dividends, revenues, and earnings. In addition, longer-term historical returns for the current portfolio are much worse than expected. Therefore, I’ve decided to downgrade my rating on SPDV to hold and suggest you stick with more established ETFs like SCHD in the meantime. The slightly lower yield is worth it for the additional safety gained.
Be the first to comment