

undefined undefined/iStock via Getty Images
The corporate bond market is selling off:
The worldwide pool of the safest corporate debt has already shrunk by $805 billion so far this year, while the global junk market lost $236 billion, according to data compiled by Bloomberg. That’s the biggest dollar decline since records began over 20 years ago, following a borrowing binge propelled by record-low funding costs.
…..
The global credit market remains under pressure from rampant inflation, which will push central banks to boost rates, in turn risking an economic slowdown. Meanwhile, Russia’s invasion of Ukraine increases concerns about Europe’s ability to fulfill its energy needs and further disrupts already struggling supply chains.
Let’s take a look at two sets of graphs:
Three corporate bond interest rates (FRED)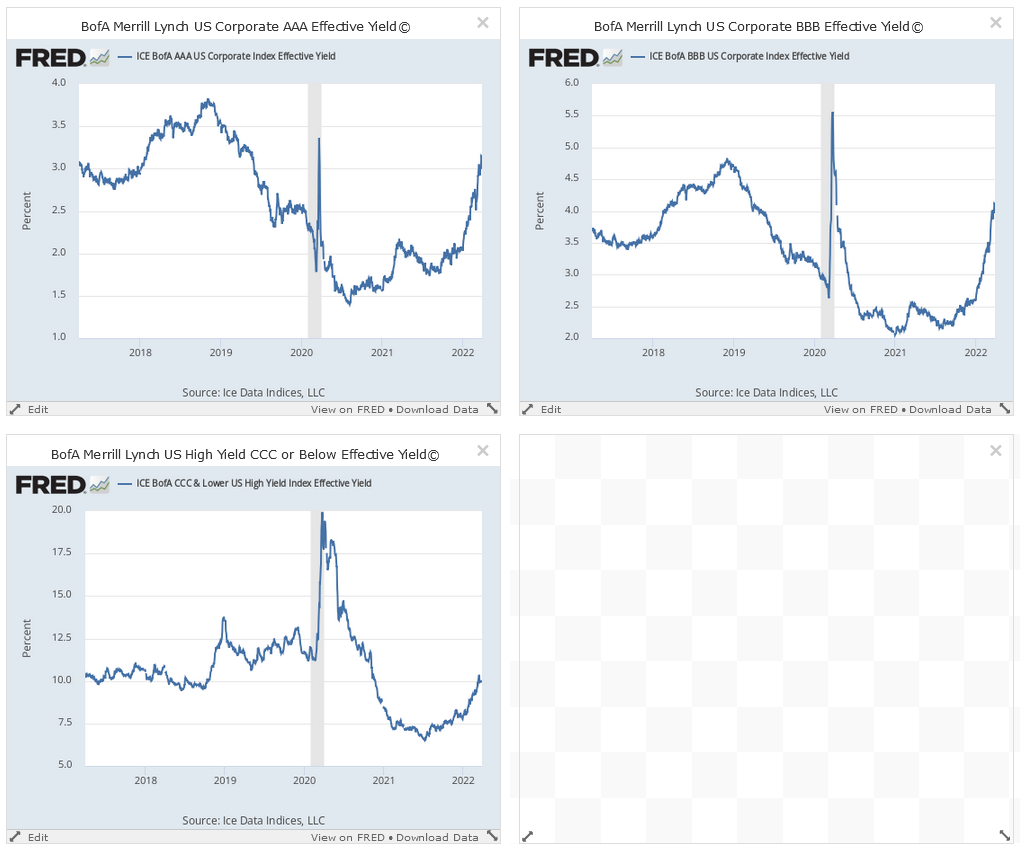
The yields of all three credit ratings have increased.
Corporate bond yield curves (FRED)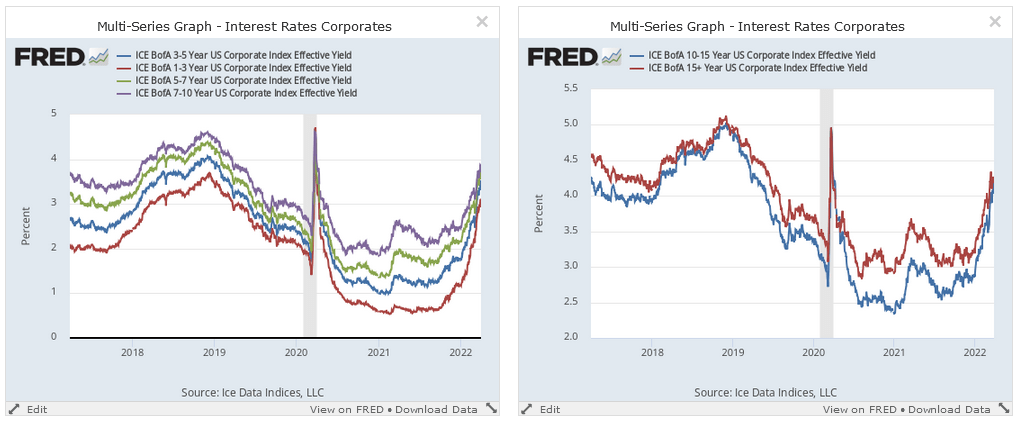
The entire corporate bond market yield curve has risen sharply in the last few months.
Credit market tightness normally proceeds a recession.
The ADP jobs report was positive:
Private sector employment increased by 455,000 jobs from February to March according to the MarchADP®National Employment ReportTM. Broadly distributed to the public each month, free of charge, the ADP National Employment Report is produced by the ADP Research Institute® in collaboration with Moody’s Analytics. The report, which is derived from ADP’s actual data of those who are on a company’s payroll, measures the change in total nonfarm private employment each month on a seasonally-adjusted basis
Here’s a chart comparing ADP to the payrolls report:
ADP and payrolls data (FRED)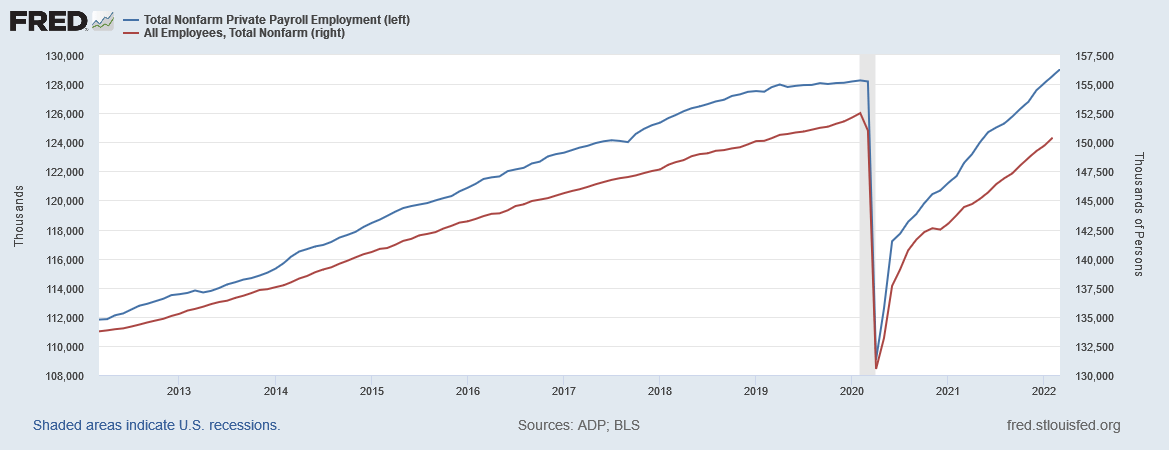
Blue is the BLS report while red is for ADP.
Larry Summers offers a rather depressing comparison:
LARRY SUMMERS: I’m probably as apprehensive about the prospects for a soft landing of the U.S. economy as I have been any time in the last year. Probably actually a bit more apprehensive. In a way, the situation continues to resemble the 1970s, Ezra. In the late ’60s and in the early ’70s, we made mistakes of excessive demand expansion that created an inflationary environment.
And then we caught really terrible luck with bad supply shocks from OPEC, bad supply shocks from elsewhere. And it all added up to a macroeconomic mess. And in many ways, that’s the right analogy for now. Just as L.B.J.’s guns and butter created excessive and dangerous inflationary pressure, the macroeconomic overexpansion of 2021 created those problems, and then layered on with something entirely separate, in terms of the further supply shocks we’ve seen in oil and in food.
While concerning, that characterization also seems apt.
Let’s take a look at two sets of charts:
1-day SPY, QQQ, DIA, and IWM (Stockcharts)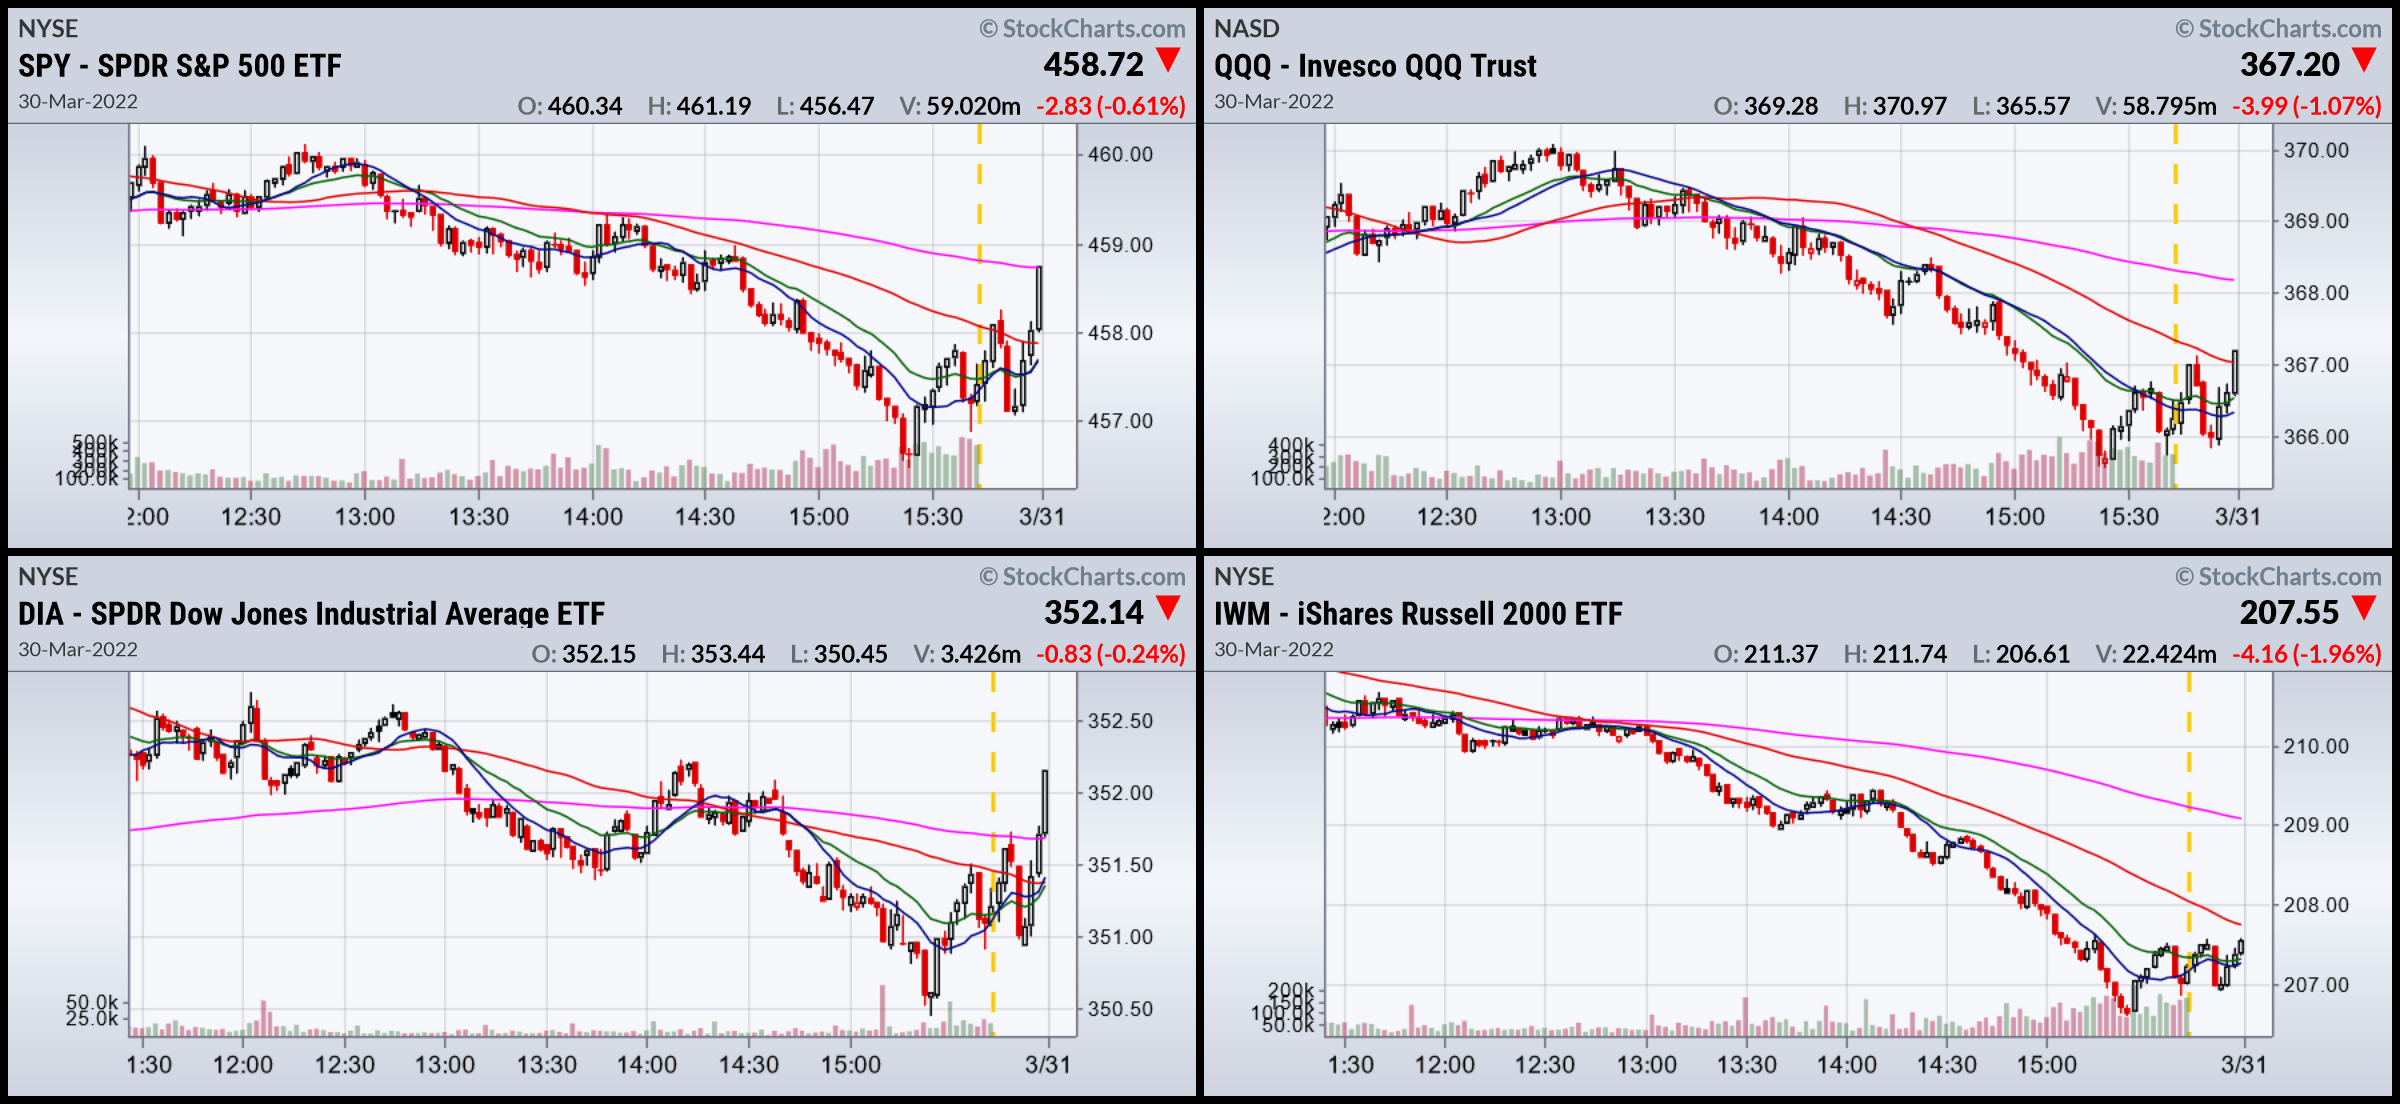
The markets were down today, which shouldn’t be surprising. They’ve been rising strongly for a few weeks now. However, there was a solid move higher at the end, which is always encouraging.
3-month SPY, QQQ, DIA, and IWM (Stockcharts)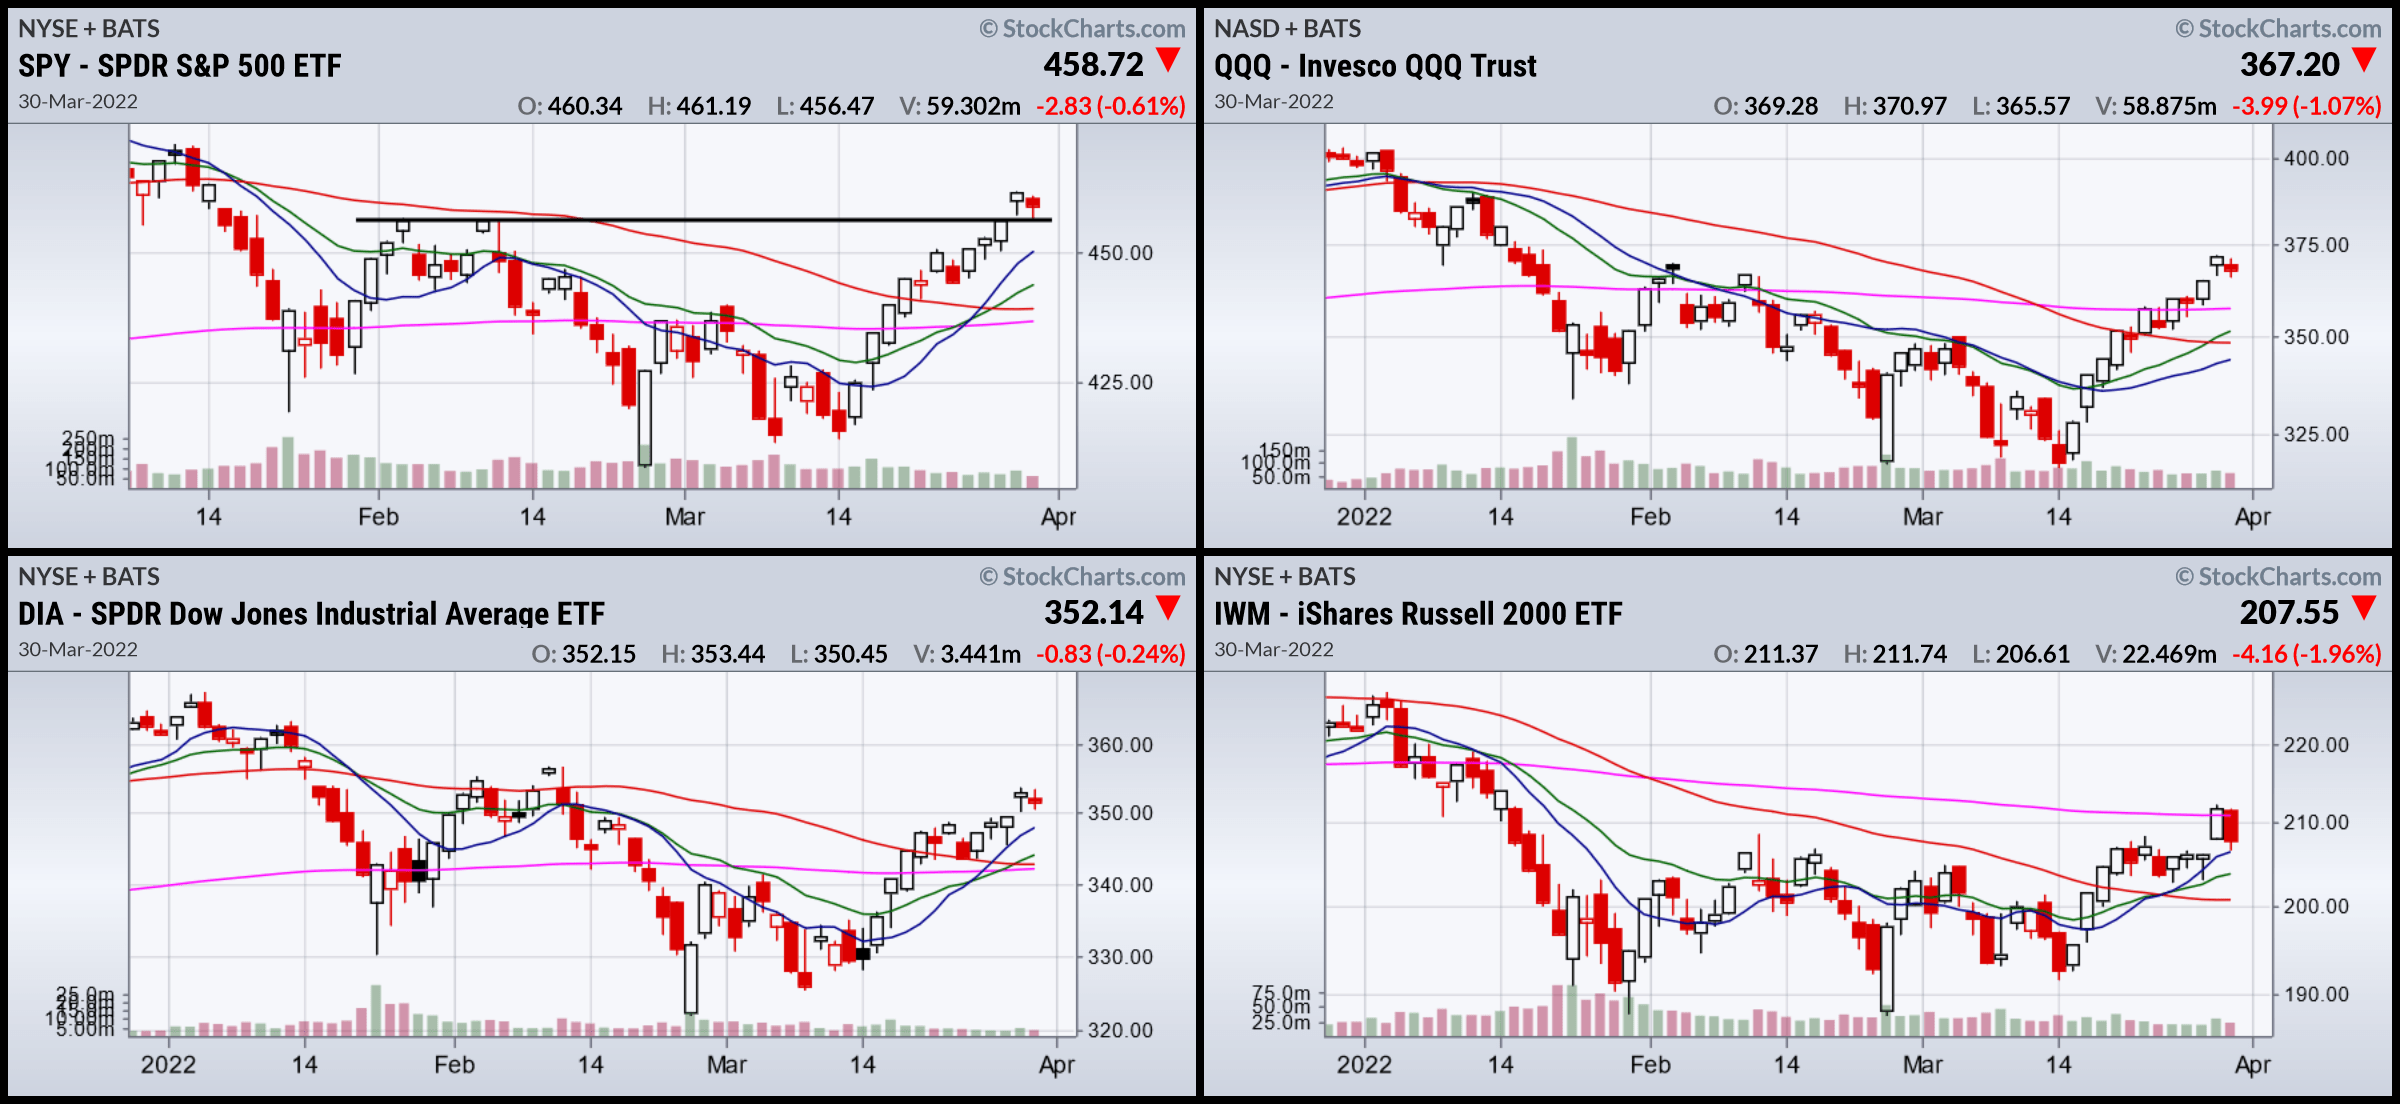
Whenever the markets rally strongly, chart readers look for the markets to “retest” levels. The idea is that prices need to cool down, allowing some traders to take short-term profits. If today is the start of that process, look for prices to move back to EMAs.
Still, not a bad place to be mid-week.
Be the first to comment