

Sundry Photography
A long-term winner
IDEXX Laboratories, Inc. (NASDAQ:IDXX) is a leading animal healthcare company with the vision to enhance the health and well-being of pets, people and livestock. The stock massively outperformed the S&P 500 and Nasdaq 100 over the last ten years, generating a 21% CAGR even after its currently down 51% from its ATH. I’ll review the company’s fundamentals in the following article by running it through my quality checklist.
Throughout this article, I’ll refer to IDEXX Laboratories as IDEXX or its ticker IDXX.
IDEXX Outperformance (Koyfin)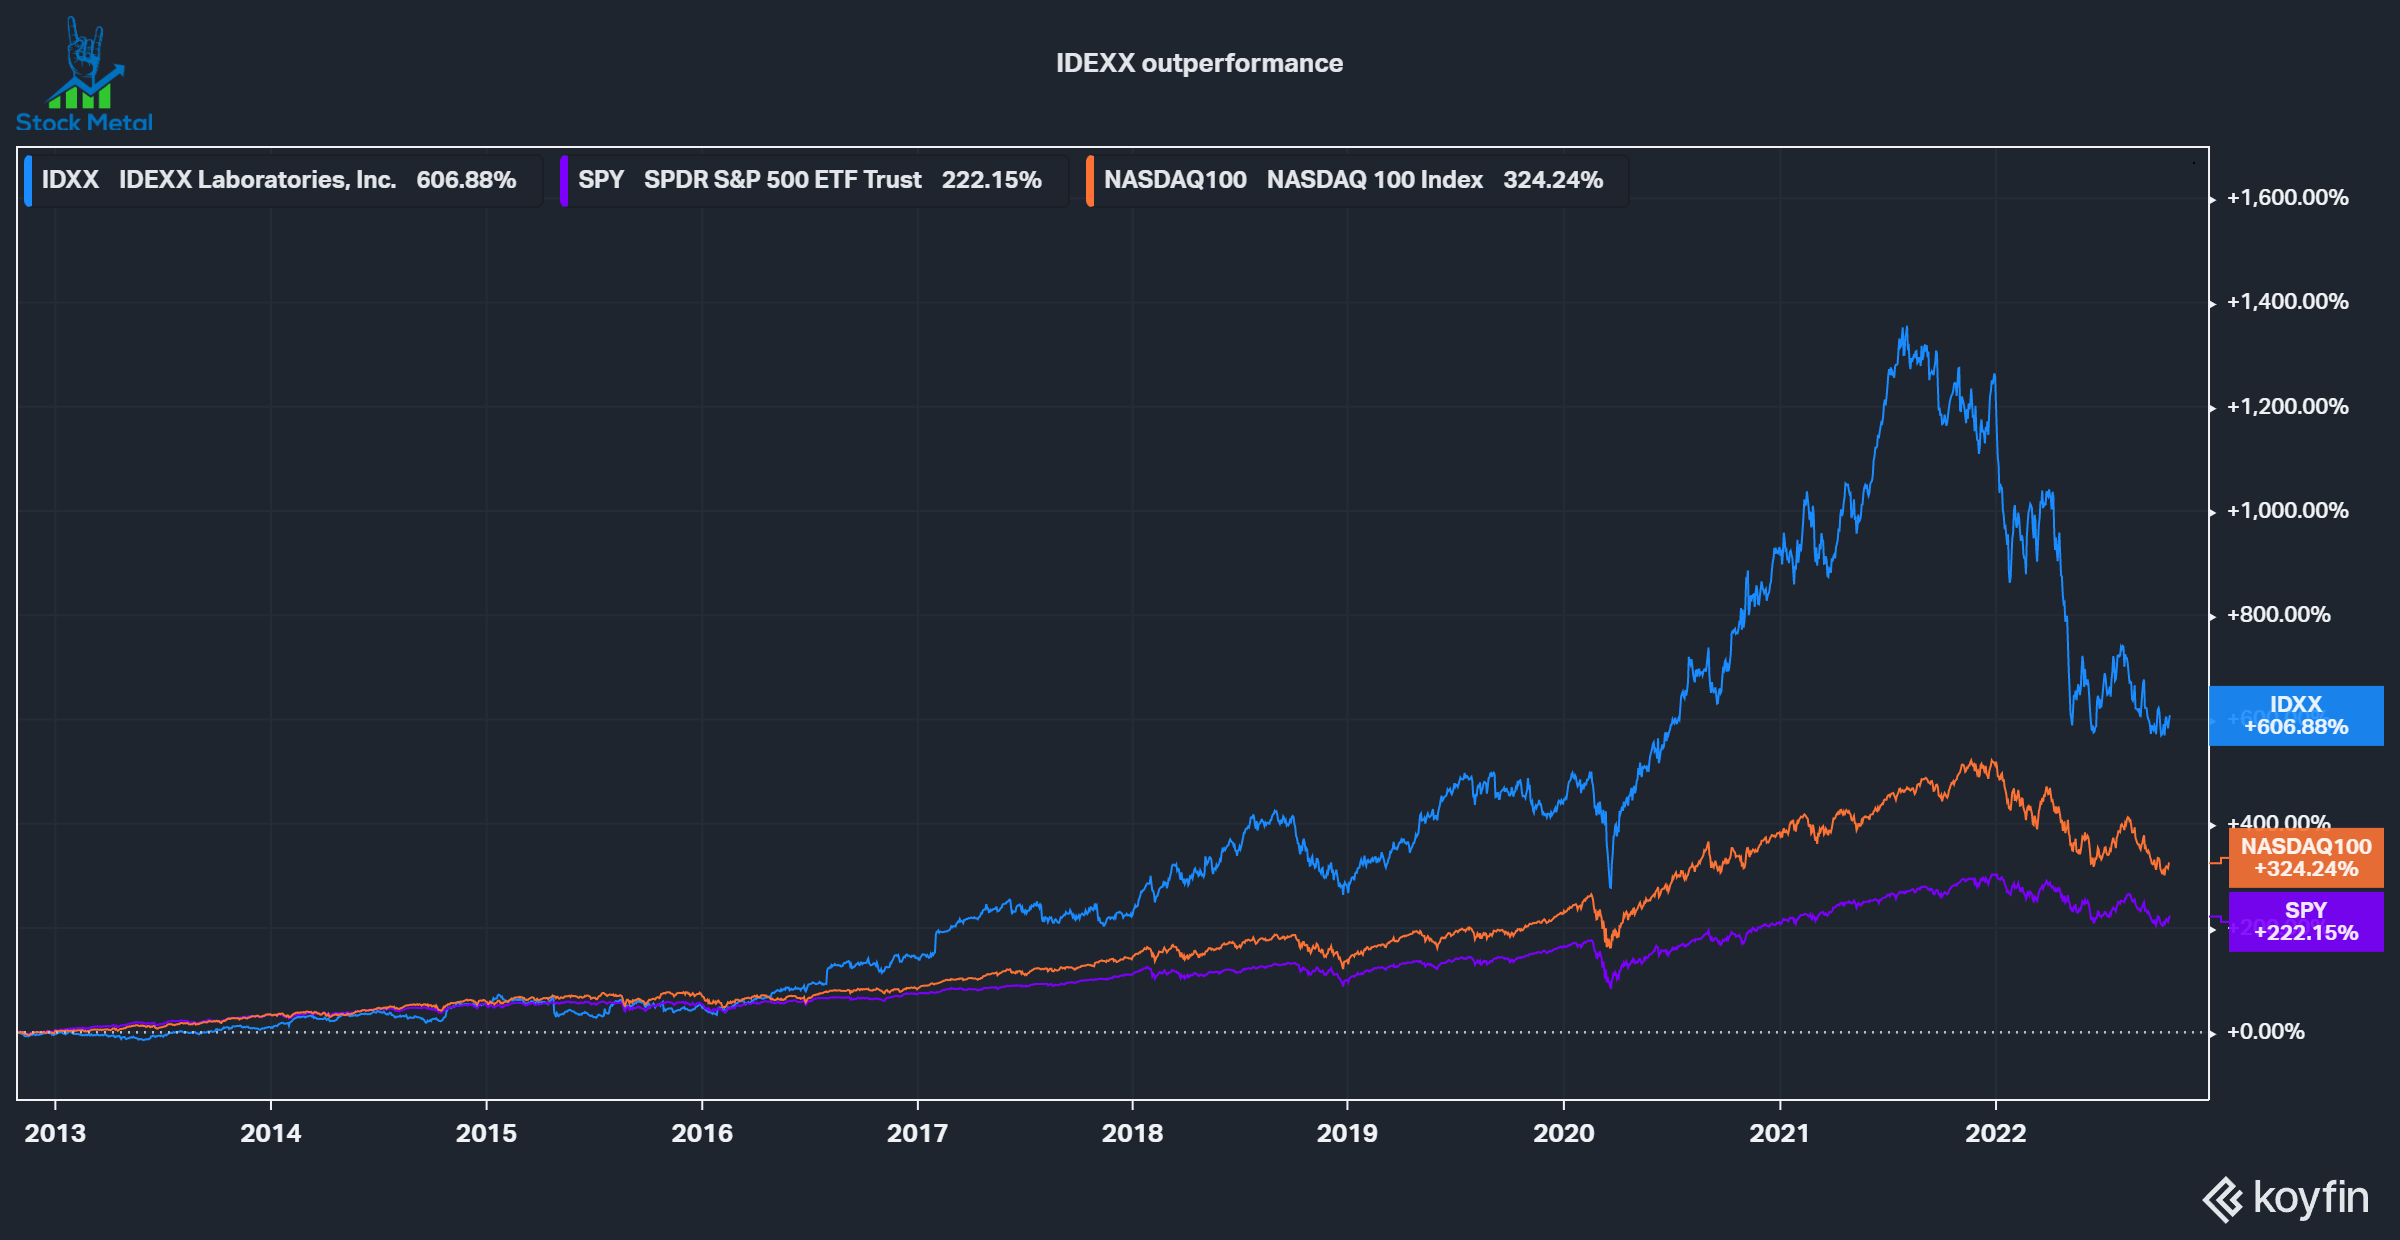
People love their Pets
IDEXX is deriving most of its revenue from its so-called Companion Animal Group (CAG), where it provides veterinarians with diagnostics products and services as well as information management solutions to enhance the health and well-being of pets, mainly dogs. The other reporting segments, Water and Livestock, Poultry and Dairy (LPD), only account for 4.5% and 3.4% of revenues, respectively.
According to an internal study of IDEXX (Slide 14), Pet Owners are willing to make financial Tradeoffs to Care for their pets, with 88% missing out on eating out, 71% on video streaming services, 79% on personal grooming services and 86% on live entertainment. This shows the tremendous personal bond most pet owners have with their animals and why the sector is so resilient in challenging economic periods(see image below) like the one we’re currently in.
Pet Healthcare resilience (IDEXX Investor day)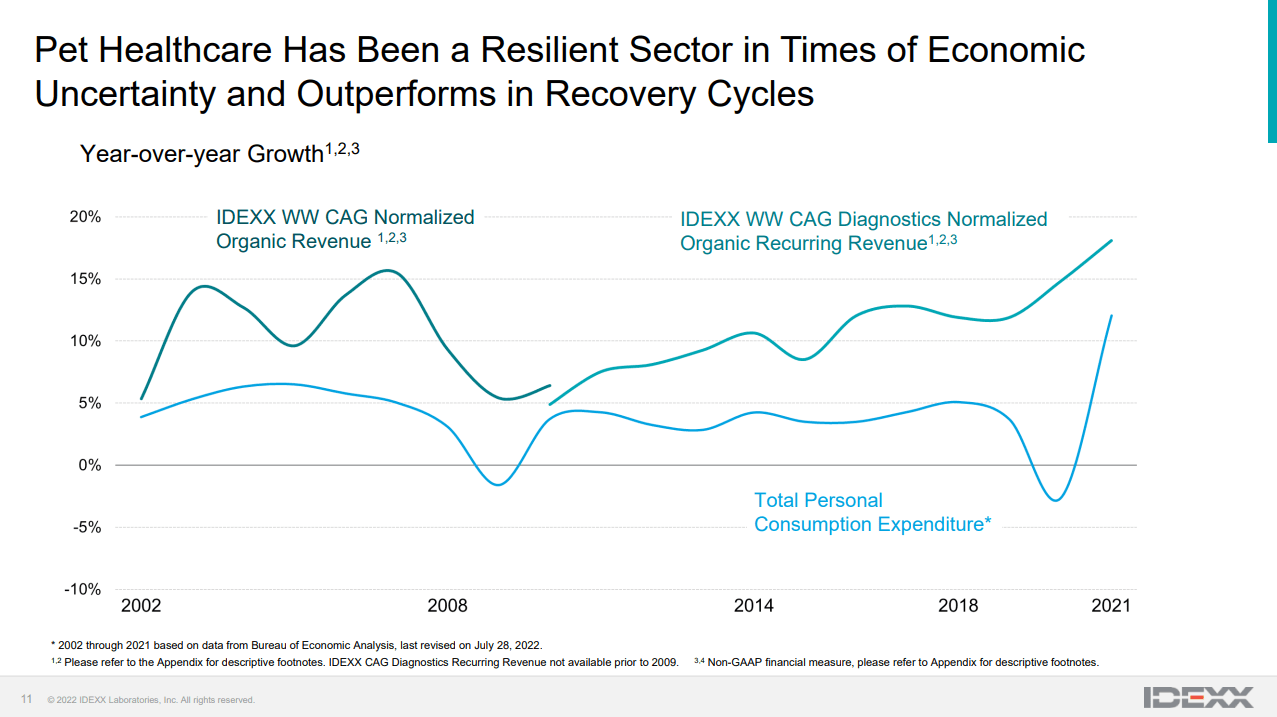
IDEXX expects the industry to grow by 9% annually for the next 25 years, with international (10%+) outgrowing the US growth of 8% (midpoint). I find these forecasts to be exuberant. Verified Market Research expects the market to grow to $5.1 billion by 2030 (8.2% CAGR), while IDEXX claims that the market already has a size of $5.3 billion. Grand View Research also estimates an 8.4% CAGR from a lower base of $2.1 billion in 2018. Allied Market Research expects an 8.6% CAGR to $6.88 billion by 2031 and finally, Mordor Intelligence is predicting a 9.2% CAGR. To conclude, we can say that, although IDEXX might be a little exuberant with its forecast (especially in the base level of current market size), the market is expected to see continued fast growth and makes for an attractive market to operate in.
Growth
Any great company needs to grow both its bottom and top line. Over the last five years, IDEXX managed to grow its revenues on average at a 9.6% CAGR, Operating Cash Flows by 10.2% CAGR and Net Income by 11.7% CAGR. We can see that over the years, the growth accelerated meaningfully, driven by a shift in sales mix towards recurring revenues, which grew from 67% in 2010 to 79% in 2021 (slide 10). A large percentage of recurring revenue helps the company to make its revenue more resilient, making it better prepared for a downturn. The company expects to continue growing its revenues by over 10% yearly and EPS by 15-20%, driven by incremental operating leverage and capital allocation (buying back stock to increase EPS)(Slide 123).
IDEXX growth (Koyfin)
Profitability
Incremental margin expansion is part of IDEXX’s promise to shareholders. Over the last ten years, they managed to live up to their promise of growing margins by 50-100 basis points per year. The company increased EBITDA margins from 24 to 29%, coming in on the bottom line of its 50-100 BPS improvement per year. They have a good current level of profitability and enough room to further expand it by increasing its share of recurring revenue and software solutions as part of the sales mix and reaching a larger scale.
IDEXX profitability (Koyfin)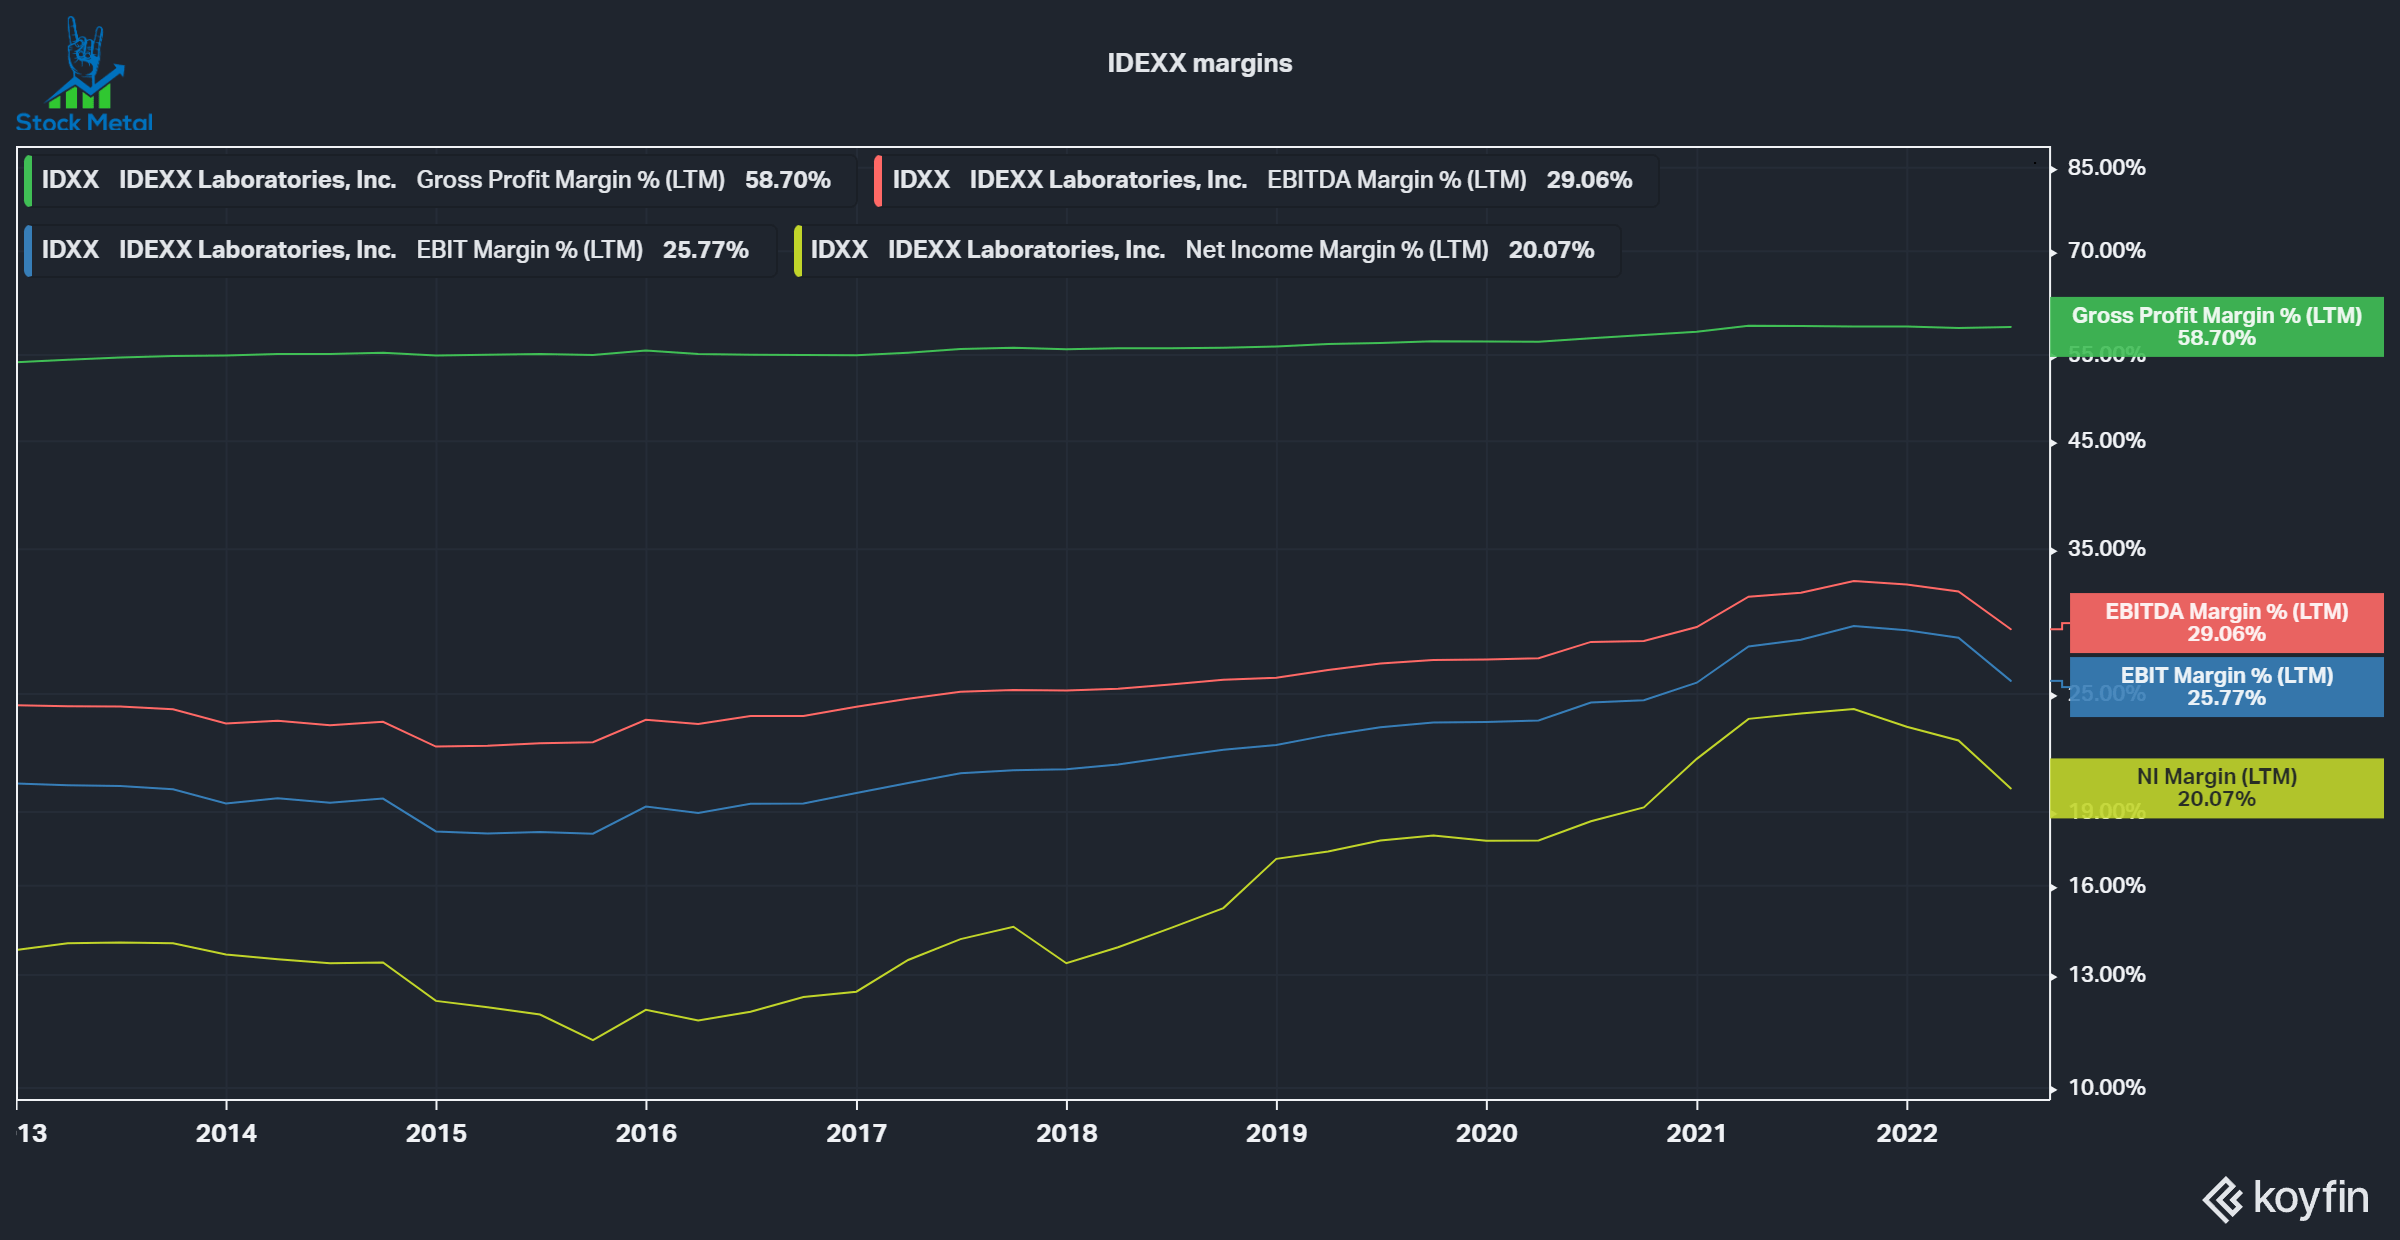
Capital Reinvestment
Over the long term, Capital Allocation is one of the most critical differentiators for a company’s performance. This means how are the cash flows generated by the company reinvested? Companies have six options:
- Invest in the existing operations of the business
- Acquire new businesses
- Buy back shares
- Pay out dividends
- Pay down debt
- Sit on the cash.
The result of these reinvestments can be approximated by Return on Assets and Return on Capital. I didn’t compare Return on Equity because it is not representative due to IDXX’s significant Treasury Stock position from buying back stock over the years. We can see that ROC and ROA both trended higher throughout the last decade. A good rule of thumb is that ROC should be at least 2% higher than the cost of capital to ensure that the company is reinvesting its money effectively and creating value for shareholders. According to Gurufocus, IDEXX had a cost of capital of 10.9%, significantly below its ROC.
IDEXX Return on Capital (Koyfin)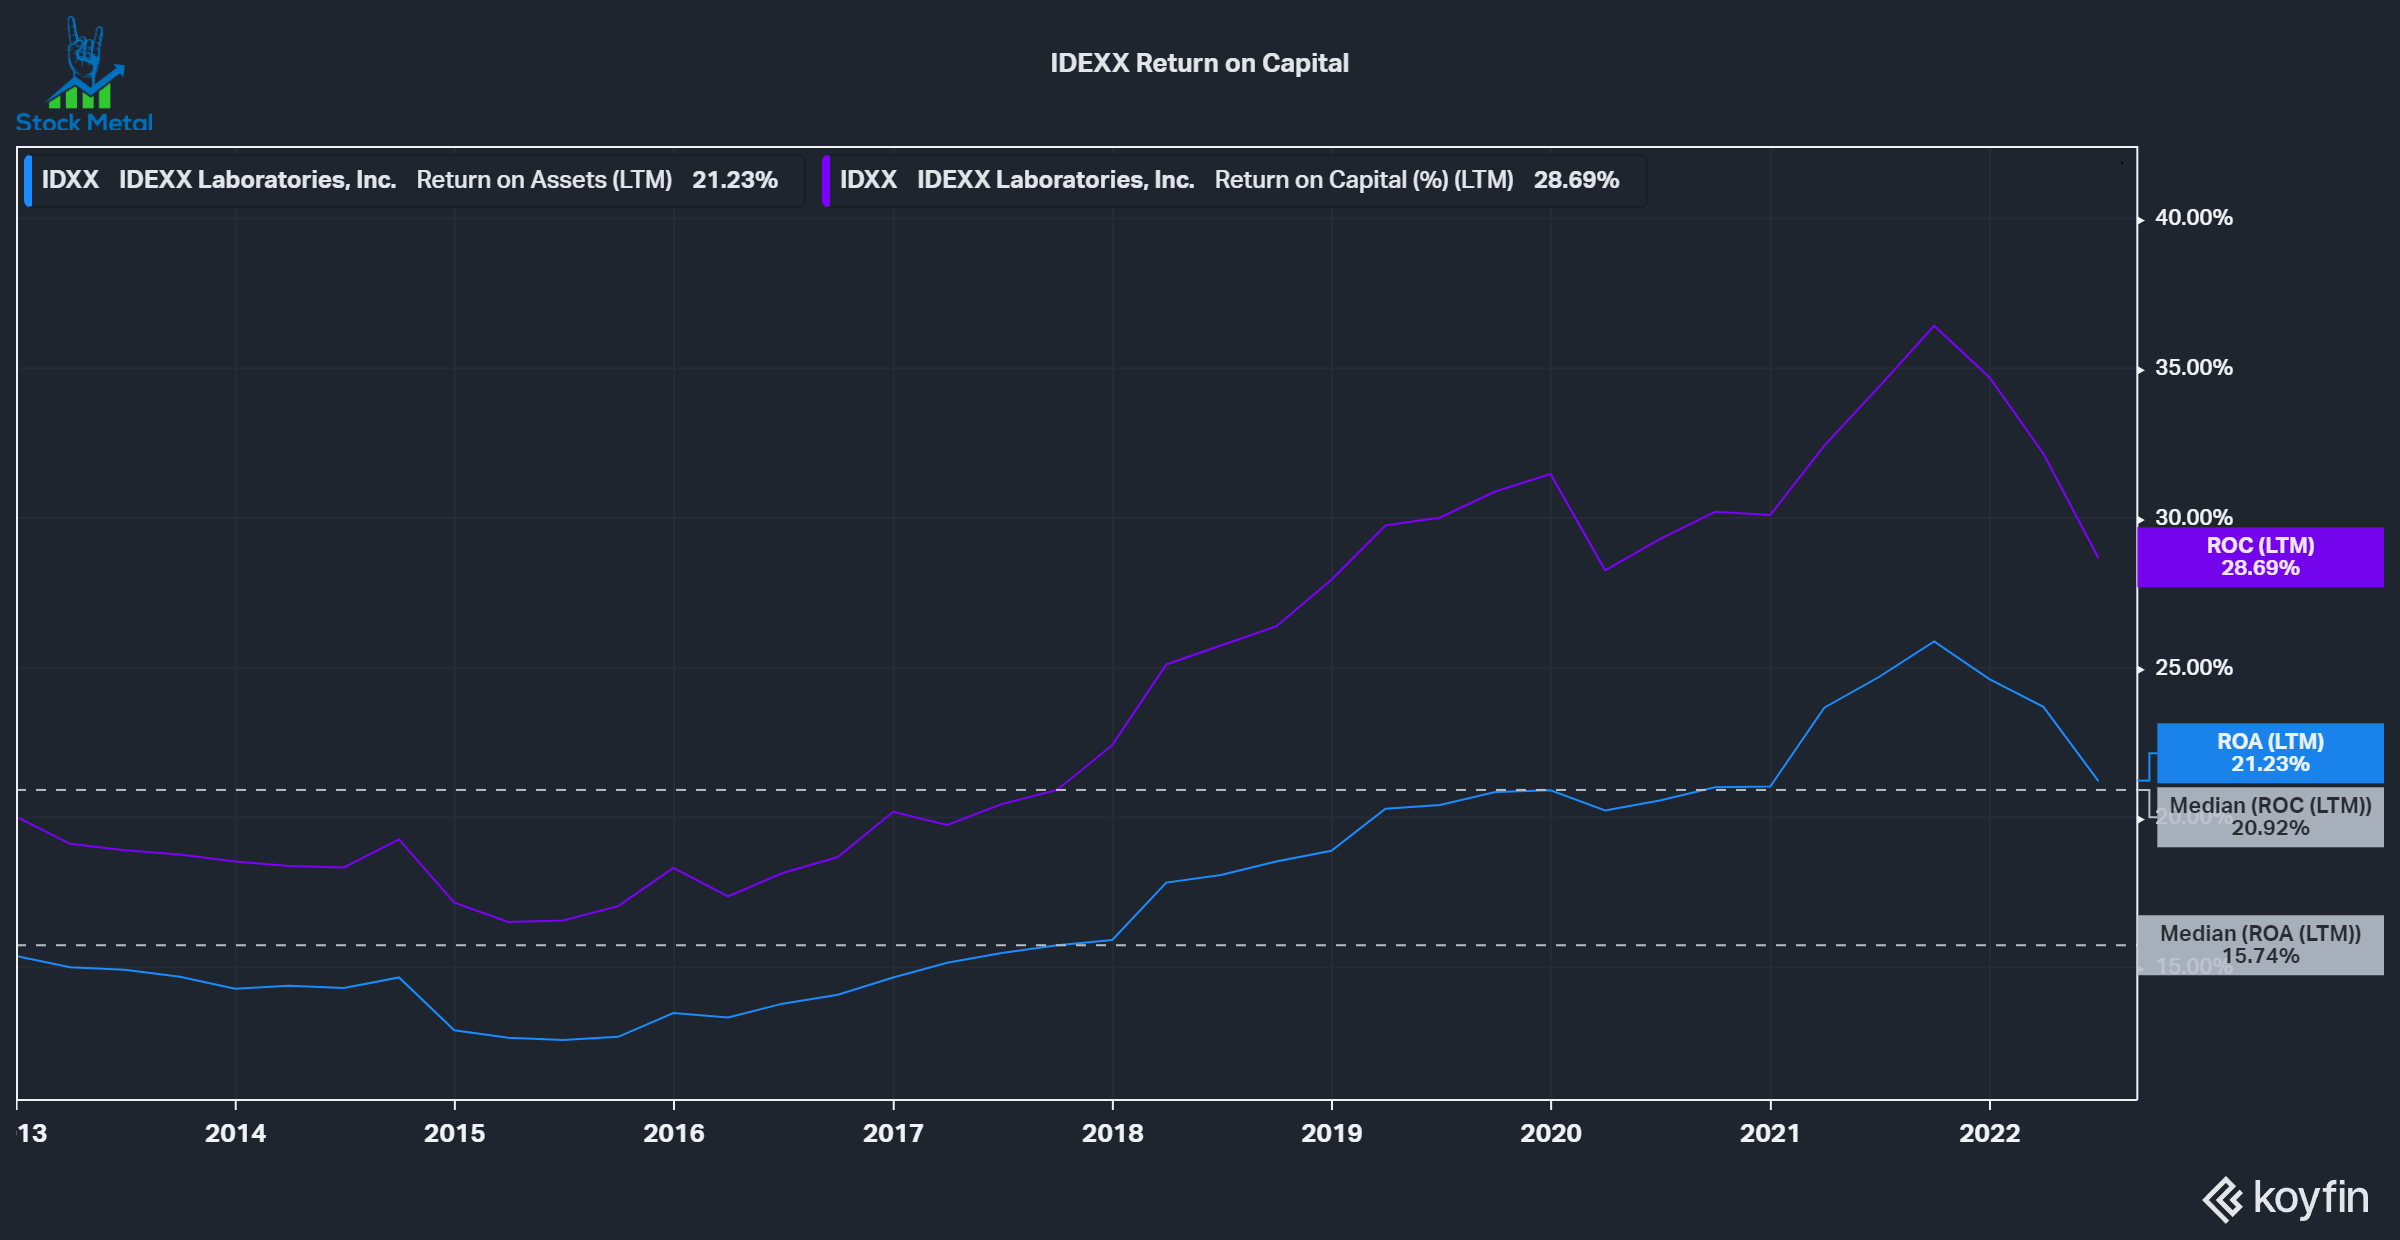
Capital Returns
IDEXX returns a lot of capital to shareholders via share buybacks but does not pay dividends. In the last decade, the company bought back 2.12% per year on average and reduced shares outstanding by 23.8% in the process. We can also see that the average free cash flow (“FCF”) yield was just 1.7%, so a significant part of the buybacks was fueled by debt. We can also see that in the net debt issuance/repayment. When the buyback yield increases, they take on debt, if they don’t buy back as much, they repay debt. We have to credit management for buying back fewer shares in 2021 when prices in the entire market were exuberant. The company occasionally acquires companies, but it’s not a significant part of the capital allocation strategy, with the largest acquisition in the last decade being just $152 million.
IDEXX Return of Capital (Koyfin)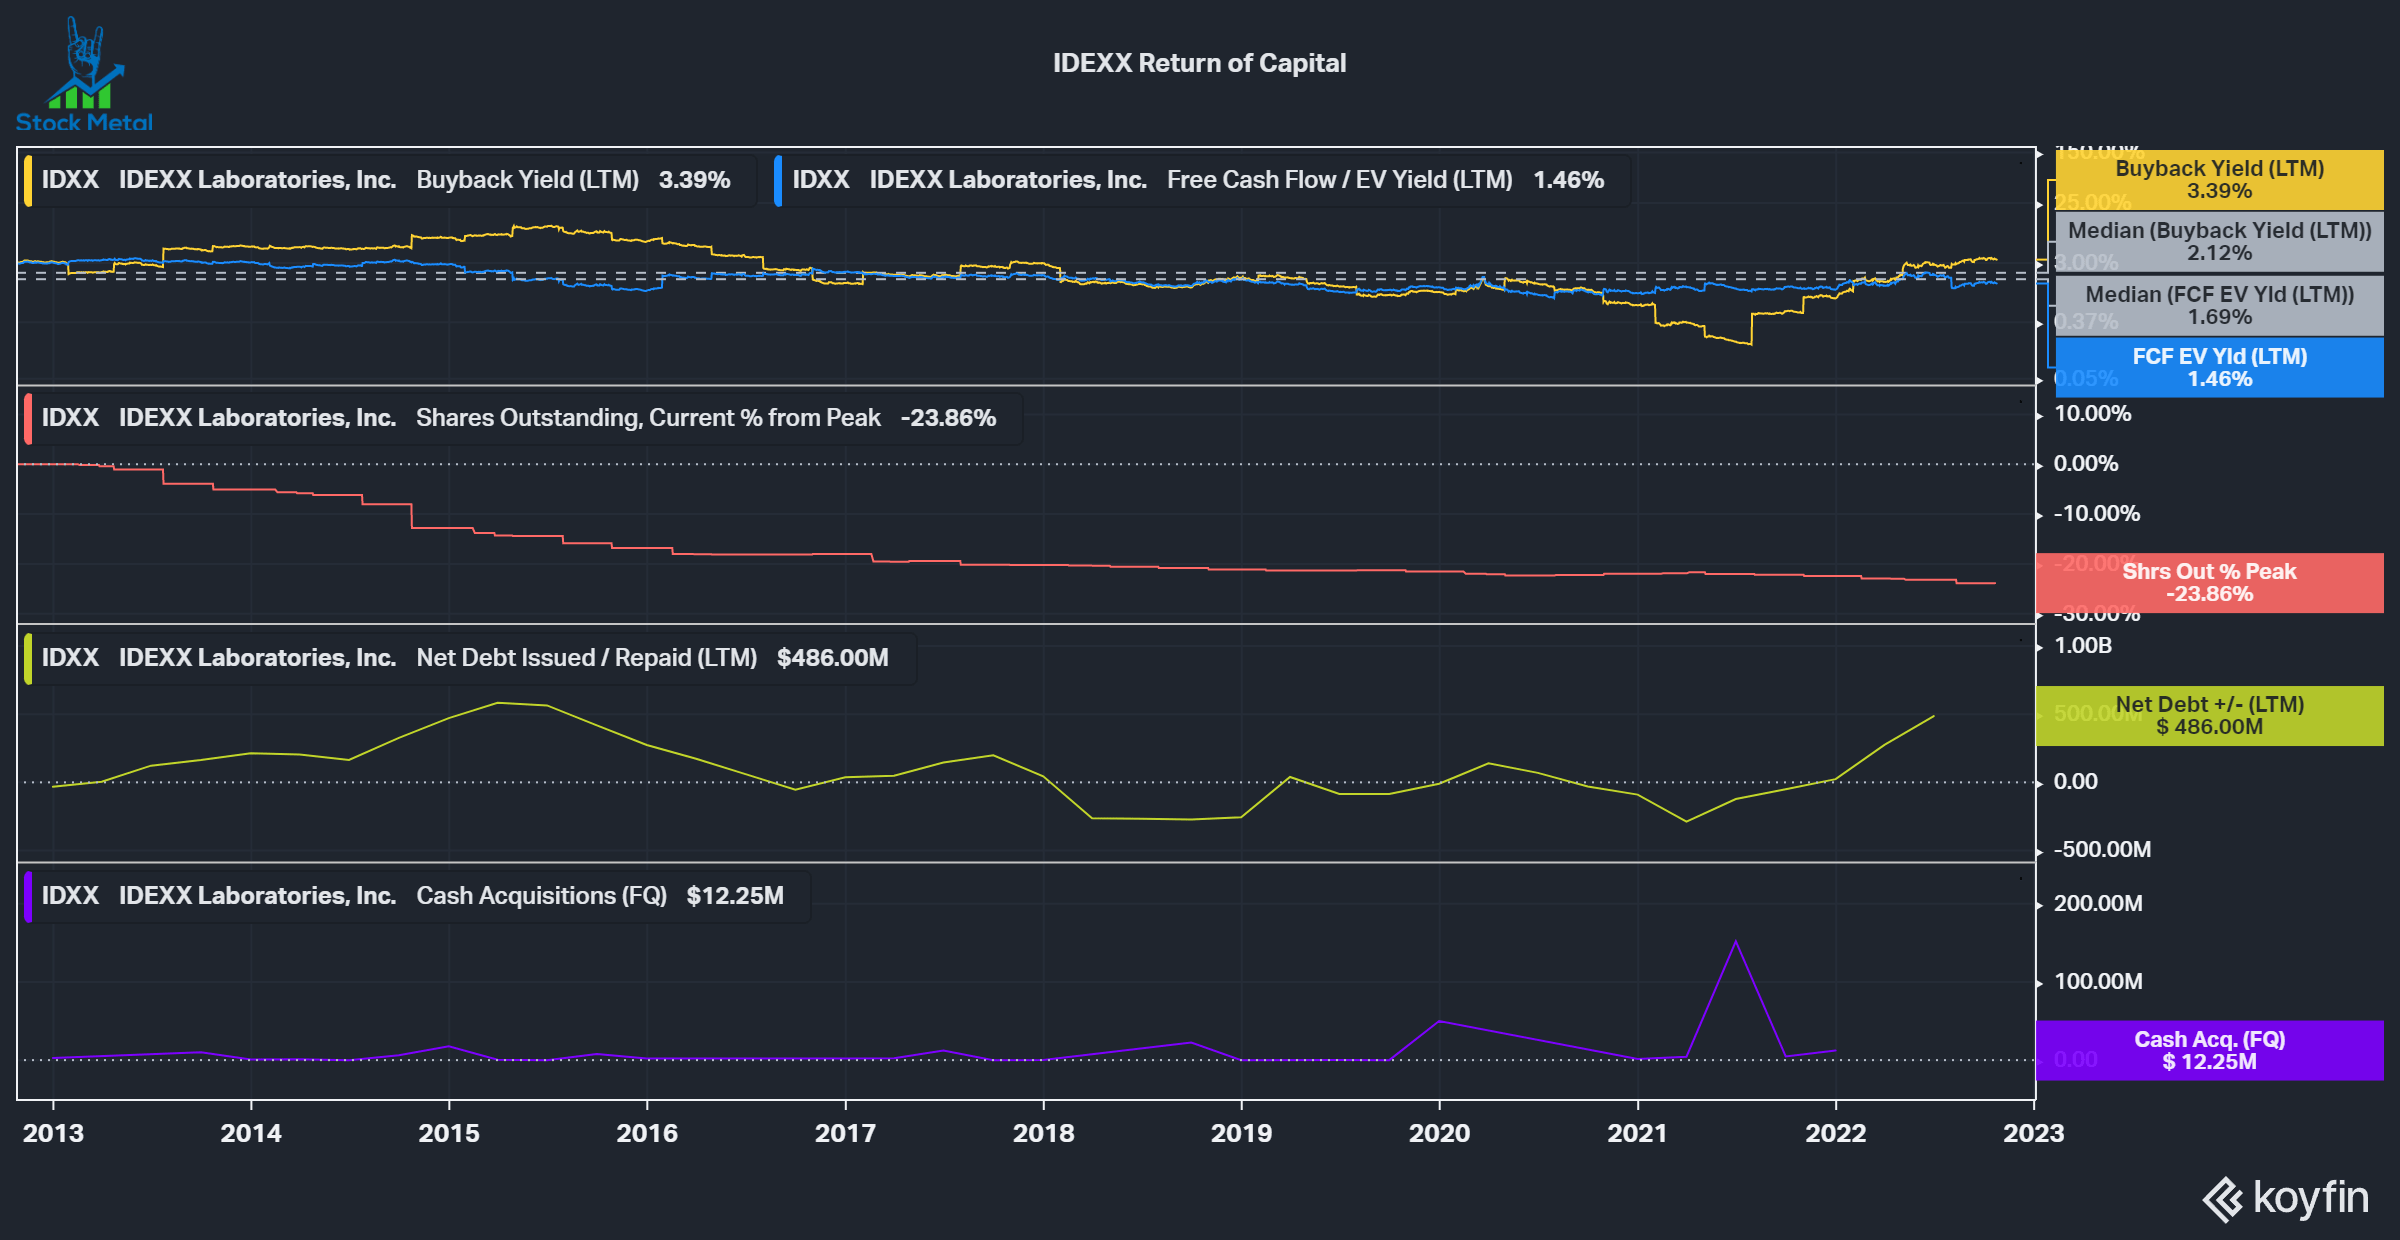
Balance Sheet
IDEXX does have some debt and is currently trading around its median leverage of 1.4x Net debt/EBITDA. The Altman Z-Score, an indicator to predict if a company is close to bankruptcy, is looking great at 13.5 (everything under three is concerning) and the debt isn’t excessive.
IDEXX Balance Sheet (Koyfin)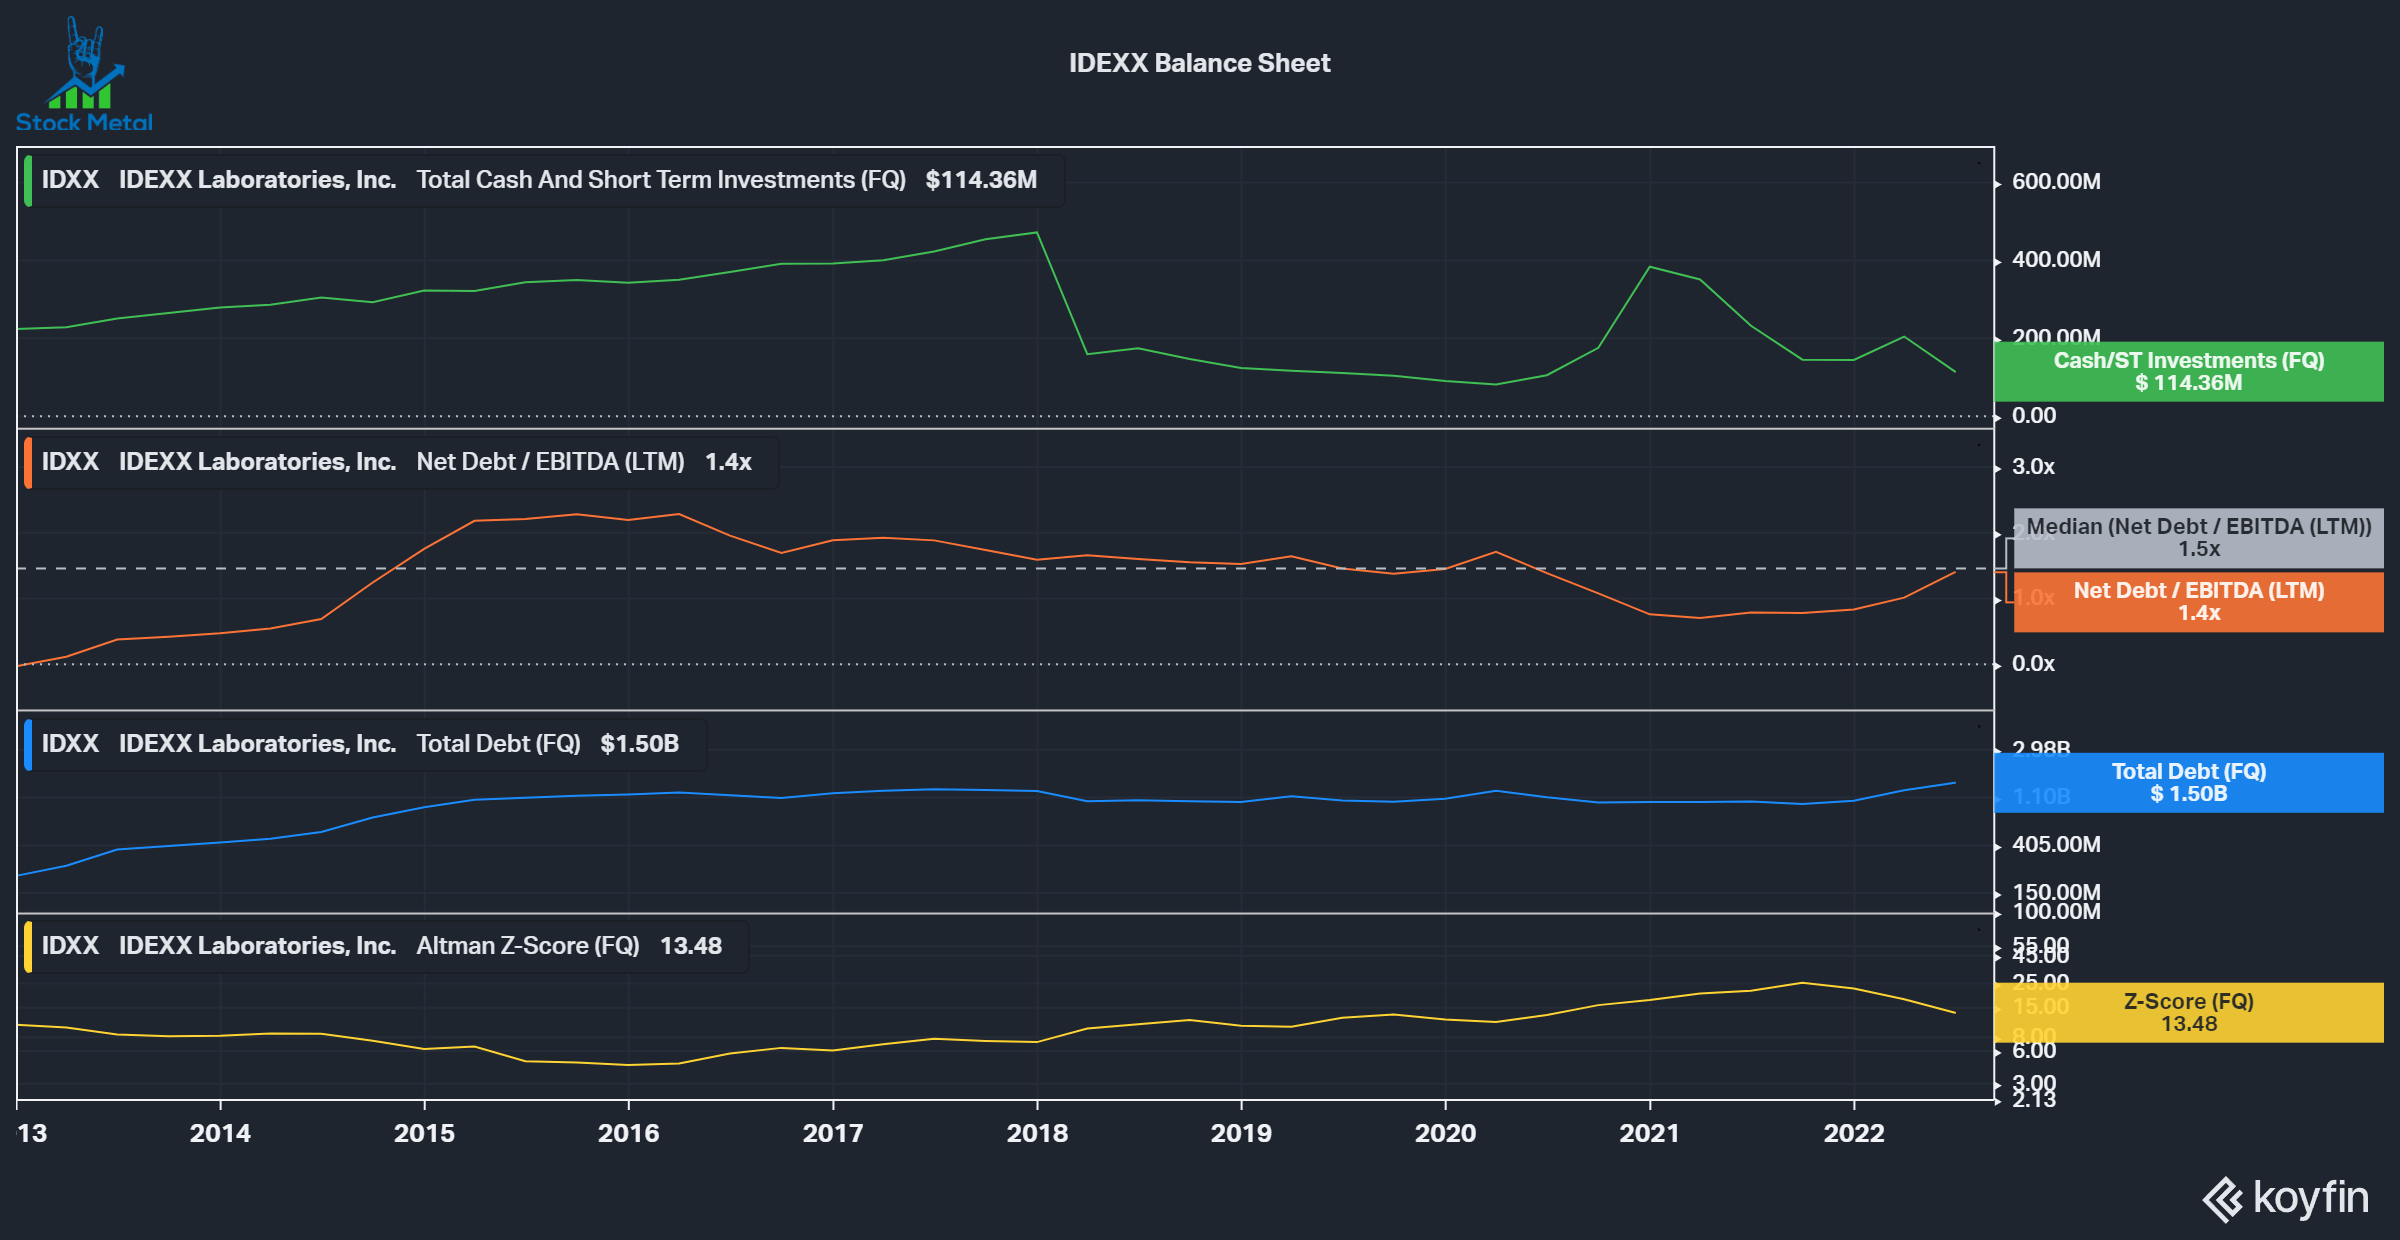
Valuation
To value the company, I’ll first look at historical valuation multiples and then at an inverse discounted cash flow (“DCF”) analysis. Based on 10-yeah historical multiples, we can see that IDXX has seen a sizeable multiple expansion, helping its total return tremendously. The P/E ratio increased from a low of 23x to an insane high of 85x in the middle of 2021. Since then, the stock has come down 51% but is still trading at a 38x forward P/E, over twice as high as the market. FCF looks similar, with an average of not even 2% over the decade.
IDEXX valuation multiples (Koyfin)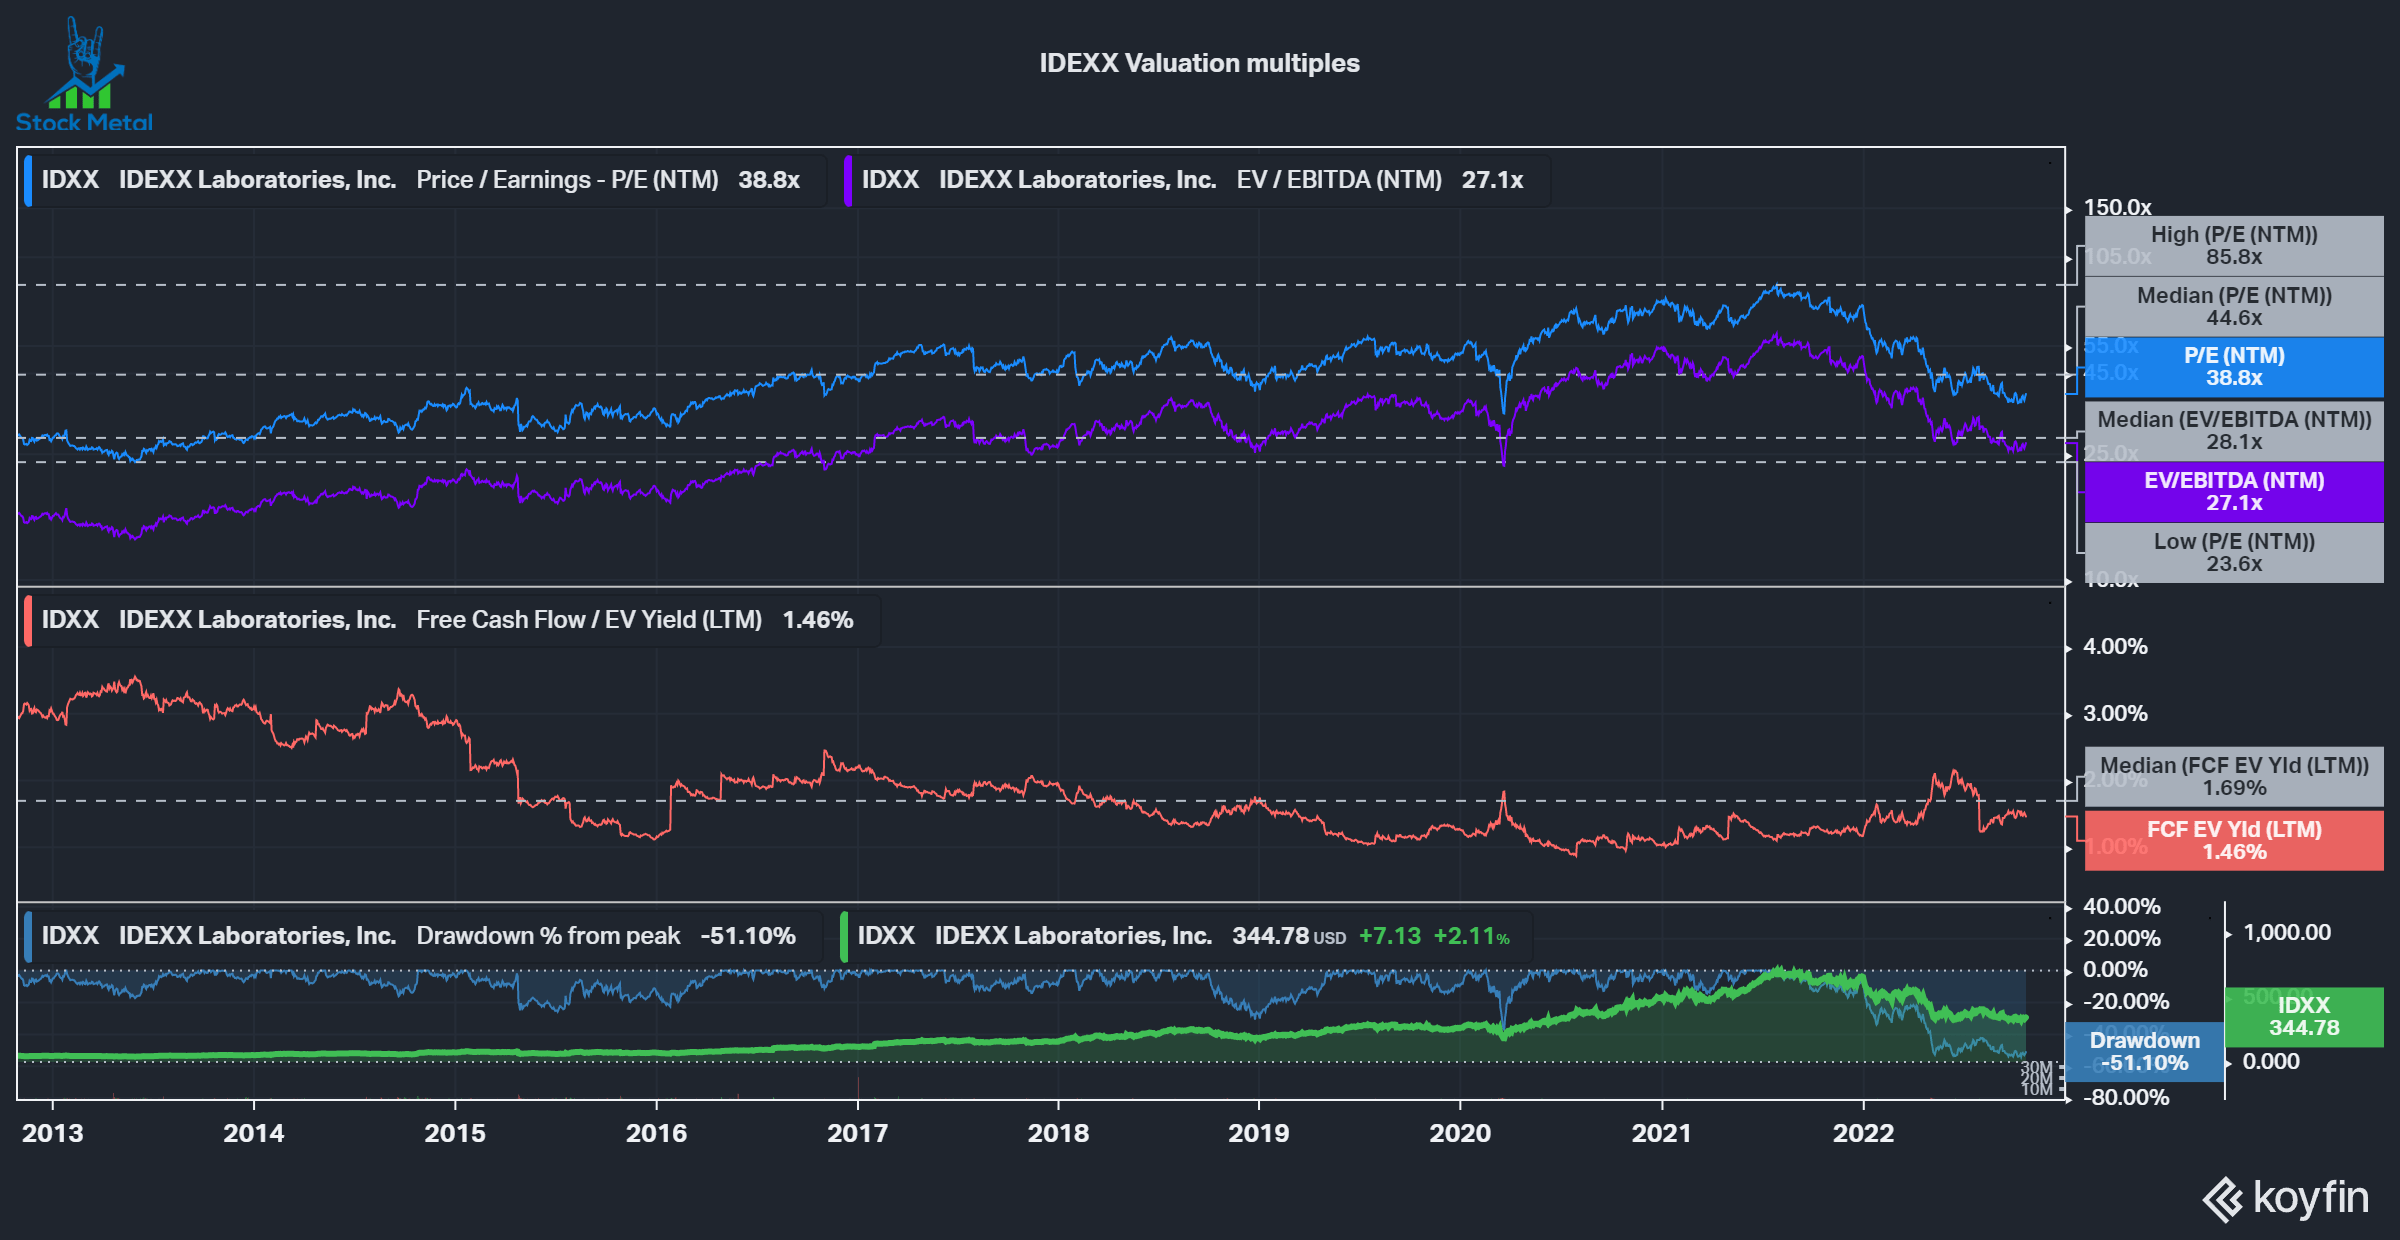
If we look at an inverse DCF model with a 10% discount rate/required rate of return, a 3% perpetual growth rate and an assumed 2% annual buybacks based on the 10-year average, we can see that the current share price needs around 20% FCF growth to be justified. This is a very high bar, but roughly within what the company is looking to achieve: 15-20% EPS growth. EPS and FCF aren’t precisely comparable, but it’s a decent proxy of what the company expects to achieve. Even here, it would require the high end of an exuberant goal like that.
IDEXX Inverse DCF Model (Authors Model)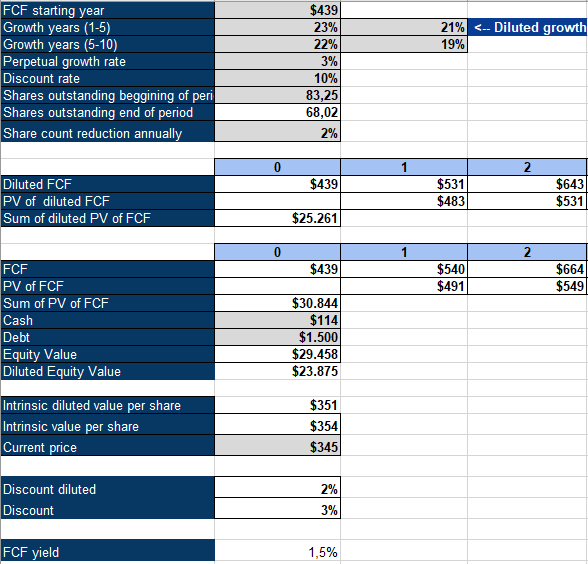
Conclusion
IDEXX is an outstanding business that suffers from chronic overvaluation. The company operates in an industry with tailwinds and a long growth trajectory, but it doesn’t justify a lavish valuation like this. Even after this significant drawdown, the company still needs to execute flawlessly to achieve a reasonable return for shareholders. IDEXX Laboratories is a company I will add to my watchlist, but I’d need the valuation to fall significantly before I’d consider buying this great company.
Be the first to comment