

scyther5/iStock via Getty Images
Magnite, Inc. (NASDAQ:MGNI) is the world’s largest independent omnichannel sell-side advertising platform. Thousands of publishers around the planet rely on the company to sell advertising on their terms and across every channel and format – including CTV (connected TV), desktop, mobile, and audio. Magnite works with the world’s leading agencies and brands to reach millions of consumers efficiently and safely, while respecting privacy. If you will, it is the middleman creating targeted ad campaigns on a range of online media, increasingly focused on the burgeoning area of streaming ads and commercials.
Magnite Website, December 6th, 2022 Magnite Website, December 6th, 2022 Magnite Website, December 6th, 2022

The bad news for investors is the Tech Wreck of 2022 and a challenging environment for online advertising have crushed Magnite’s stock quote and immediate operating prospects. The good news is management just released a better-than-expected Q3 and outlook for 2023, as industry growth for eyeballs in streaming media are still expanding at a sizable clip. Essentially, younger adults (and middle-aged consumers open to change) continue to leave cable and antennae network TV viewership in favor of online streaming for entertainment, news, sports, and niche personal interests.
Magnite reported ad revenue in the online connected TV (streaming) space rose a robust +29% in Q3 (now 44% of total revenue), with future industry growth rates pegged at +20% YoY over the next four years (doubling CTV revenue into 2026). And, this bullish trend of ad spending online is beginning to steal market share away from regular cable and broadcast TV outlets.
eMarketer, October 2022 Ad Spend Projections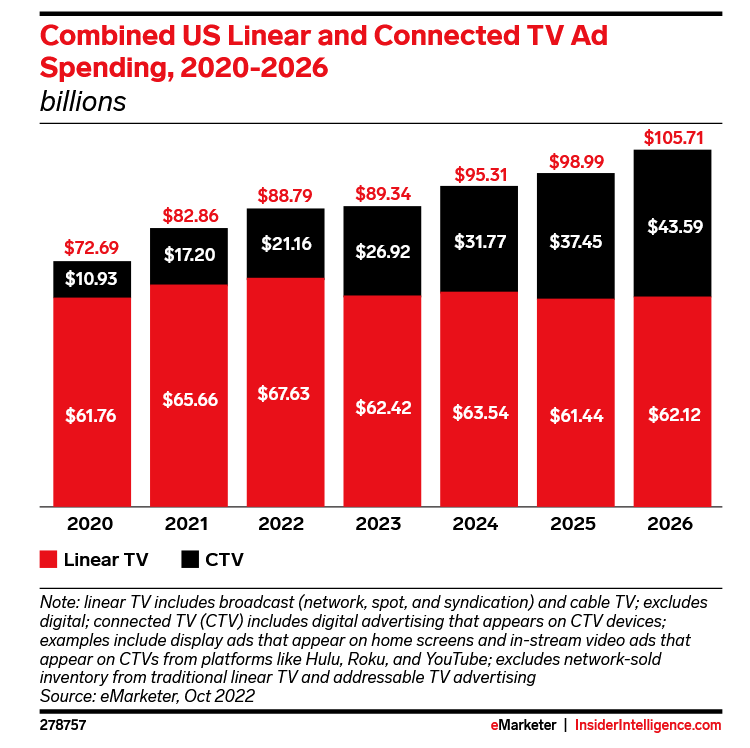
With the whole streaming-media sector is moving away from subscription services to advertising-led business models, Magnite is in a unique position to grow rapidly, no matter which streaming provider is the most profitable or fastest growing for Wall Street analysts and investors.
A sharp rise in the share quote during November may have pinpointed a long-term bottom in Magnite’s price, with free cash flow generation leading shares higher next year. In many ways, Magnite’s situation is similar to the Roku (ROKU) stock setup, where declining ad spending will eventually reverse, while the likely adoption of new commercial placements on this leading internet access point for streaming content may pump business results markedly. I mentioned Roku’s 2023 potential for investors in an October article here. Below is a graph of the stock price peaks for both streaming-ad players in early 2021, followed by substantial slides into November 2022 (vs. equivalent NASDAQ 100 and S&P 500 total returns).
YCharts – Magnite and Roku Total Returns, Since February 2021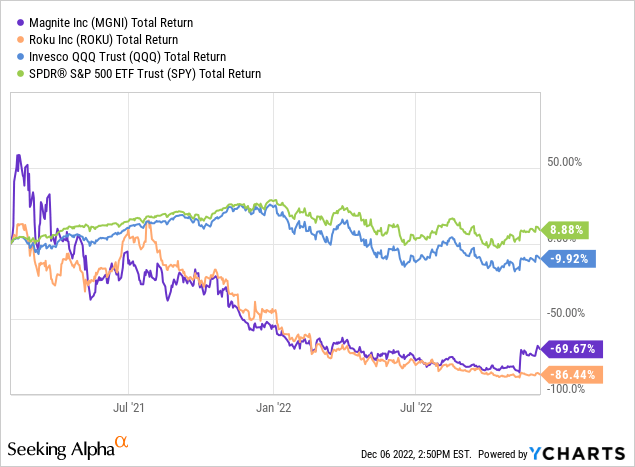
The Upside Story
The foundational buy argument is the company remains well positioned to ride growth in streaming advertising spend. Why? Magnite is something of a free cash flow machine, with a business model that can support truly high rates of cash generation when the economy starts expanding again (which may not happen until the second half of 2023).
Below are graphs of the company’s already above-average free cash flow generation in the connected TV world. I am drawing comparisons against the major online streaming giants, as this will be the group increasingly turning to advertisement options and commercial placements – demanding more services from firms like Magnite.
To reach an extremely high rate of free cash generation, first you need to run an elevated “gross margin” business. This enterprise checks off that box, with gross profit margins similar to Alphabet/Google (GOOG, GOOGL) or small streaming service AMC Networks (AMCX). Margins run well above Roku and entertainment giants like Warner Bros. Discovery (WBD), Apple (AAPL), Netflix (NFLX), Walt Disney (DIS), Paramount (PARA), and Amazon (AMZN).
YCharts – Streaming Leaders, Gross Margins, Since 2018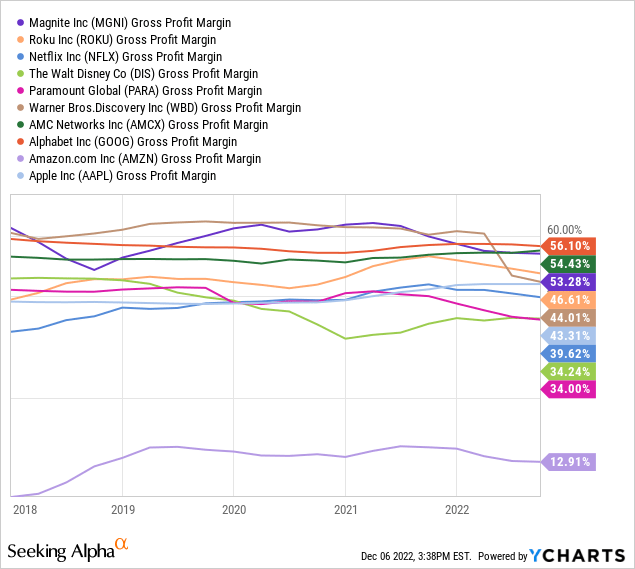
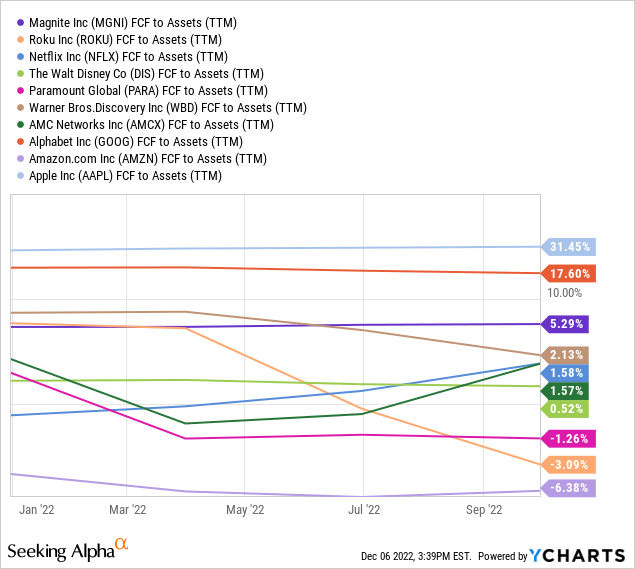
With a long runway for growth, free cash flow to debt and total assets is already superb. The entire balance sheet and operating setup is well above average vs. the streaming industry, meaning any rise in sales should translate into faster cash flow generation than in the recent past.
YCharts – Streaming Leaders, Free Cash Flow to Debt, Trailing 12 Months,YTD 2022 YCharts – Streaming Leaders, Free Cash Flow to Assets, Trailing 12 Months, YTD 2022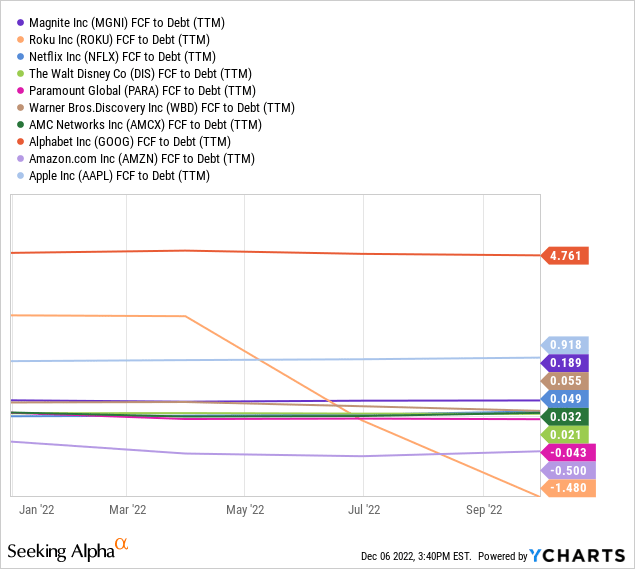
Given all the positive margin and cash flow analysis, you would think a business valuation on Wall Street would include premium multiples. Yet, this is not the case today. For starters, the all-important free cash flow yield of 8.9% is actually near the top of the group on a trailing 12-month basis. You would expect a far lower yield, given its higher gross margins and bright growth future within the industry. Also notice free cash flow has leapt from the weakest peer-group number five years ago, to almost the strongest. It’s been an exceptionally impressive run for management.
YCharts – Streaming Leaders, Free Cash Flow Yield, Trailing 12 Months, Since November 2017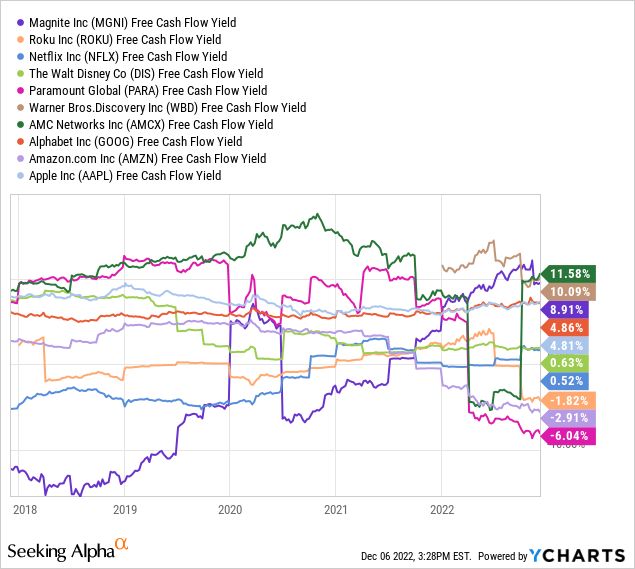
Non-GAAP cash earnings are projected to grow nicely into 2024. Sales are slated to reaccelerate after a 2023 recession in ad spending fades. Using Wall Street estimates, Magnite at $11 per share is selling for a cash P/E under 10x 2024 numbers, with a free cash flow yield potentially above 12% annually for patient long-term investors. [Note: GAAP EPS are slightly negative today, a function of high non-cash depreciation of technology and amortization of goodwill/intangibles, alongside stock-based compensation.]
Seeking Alpha – Magnite, Analyst Estimates for 2022-24, December 6th, 2022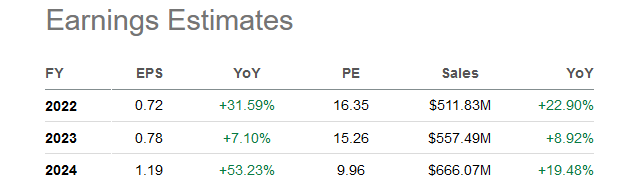
Further, Magnite’s non-GAAP earnings are estimated by analysts to grow much faster than either advertising (not pictured) or streaming-industry expectations, using early 2022 as our starting point.
YCharts – Magnite, Analyst Non-GAAP EPS Growth Estimates, December 6th, 2022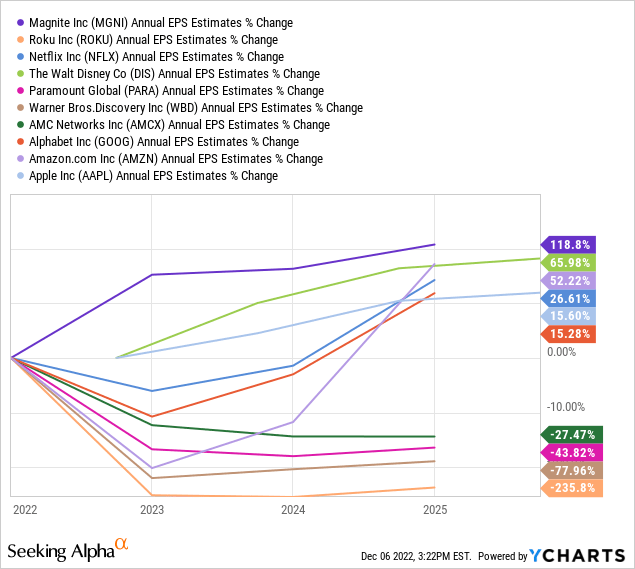
On a valuation look, Magnite sold at a 3-year low in November, using a variety of fundamental ratios (going back to pre-COVID numbers when outsized CTV growth began). Enterprise valuations are drawn below, where we add debt to equity capitalization and subtract cash holdings. EV to a forward projected EBITDA ratio of 11.45x and sales multiple of 4x are actually similar to the S&P 500 index forecast for 2023, despite better-than-typical gross margins and a much brighter “growth” future.
YCharts – Magnite, EV to EBITDA & Revenues, 3 Years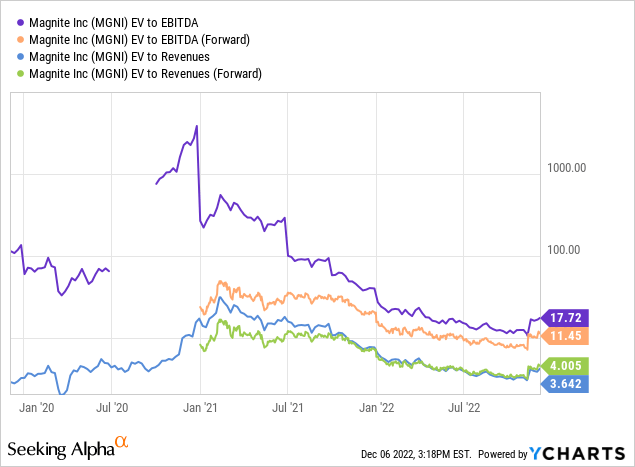
Using share pricing vs. sales, traditional operating cash flow, and book value, Magnite is equally cheap. At the early 2021 peak for price, valuations were 400% to 500% higher than today! I find it probable investors are now buying closer to a bust low valuation, than the bubble peak 20 months ago.
YCharts – Magnite, Price to Trailing Sales, Cash Flow & Book Value, 3 Years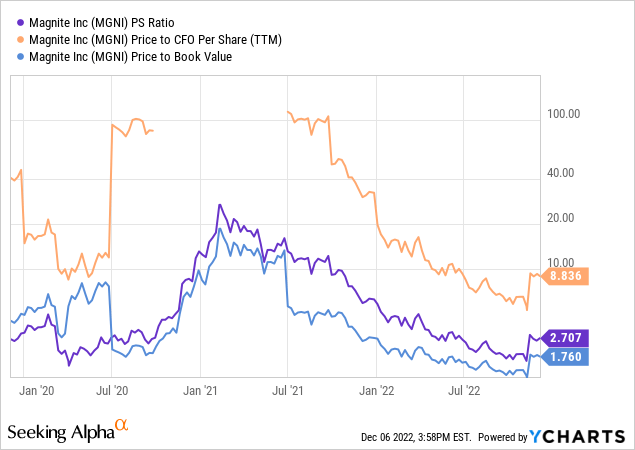
Improving Trading Performance
With valuations arguably entering the bargain range, the latest bump higher in price takes on more significance. Big winners start from low valuations, and have to get some momentum going first before the meat of a price advance appears.
Over the last six months, only Netflix (with its push to increase advertising on its platform ironically) has been able to rise above the Magnite +9% performance gain for investors.
YCharts – Streaming Leaders, Total Returns, 6 Months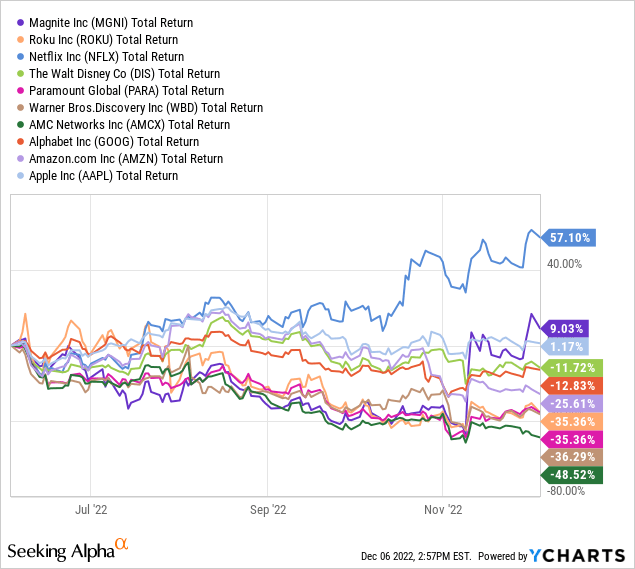
On my 1-year chart of daily trading, you will notice Magnite has reconquered both its 50-day and 200-day moving averages. In addition, regular selling into early November was part of the investment story all year. The quick price reversal after its earnings release did help the momentum picture. Down sloping lines for (1) relative strength vs. the S&P 500, (2) the Accumulation/Distribution Line, and (3) On Balance Volume were snapped in a positive fashion. Exceptionally high buy volumes (likely with some short covering) may have broken the downward slide in price. Now, the $9 to $10 price area (near its 200-day moving average) should provide support, even if the U.S. stock market succumbs to another wave of selling into early 2023 (my current forecast).
StockCharts.com – Magnite, Daily Price & Volume Changes with Author Reference Points, 1 Year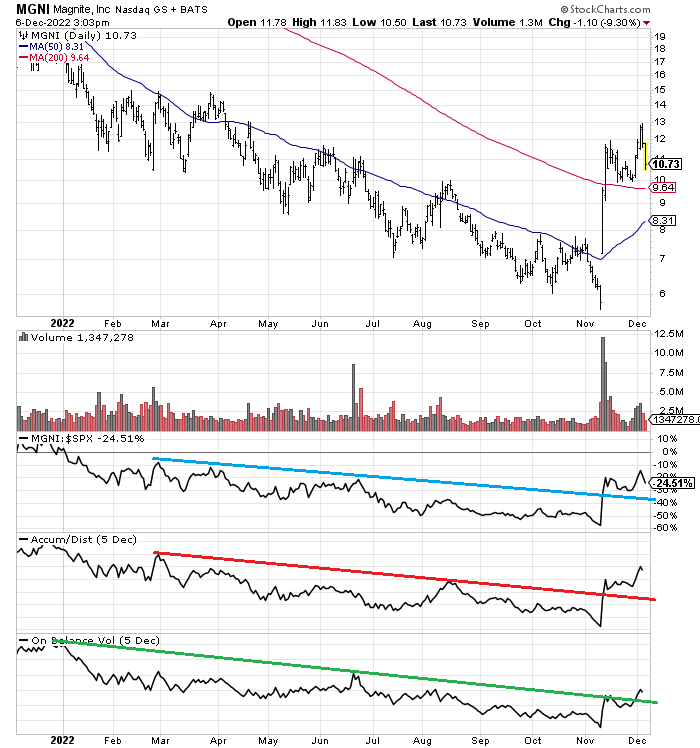
Final Thoughts
Magnite has been a favorite of short sellers during the decline in online advertising rates this year. The bullish news is this group will undoubtedly provide future buy interest (on short covering), creating a bigger than otherwise jump in the share quote as streaming ad placements pick up industrywide. The 7% short position of outstanding shares is not extraordinary, but should encourage a solid price tailwind if business results tend to “beat” analyst expectations in the first half of 2023.
YCharts – Streaming Leaders, Short Position vs. Outstanding Shares, 1 Year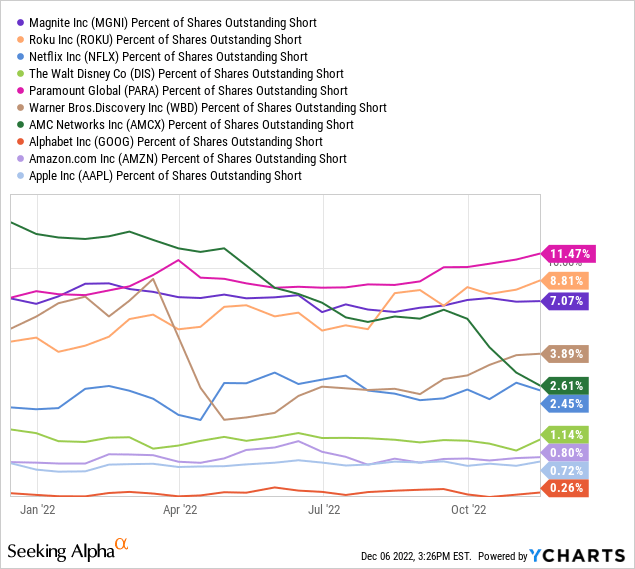
Seeking Alpha’s computer-scored Quant Rank for Magnite has soared with the share price turnaround in November-December. Its ranking near a Top 10% position in both the Communications and Advertising sectors is another data point to seriously consider in your research.
Seeking Alpha – Magnite Quant Rank, December 6th, 2022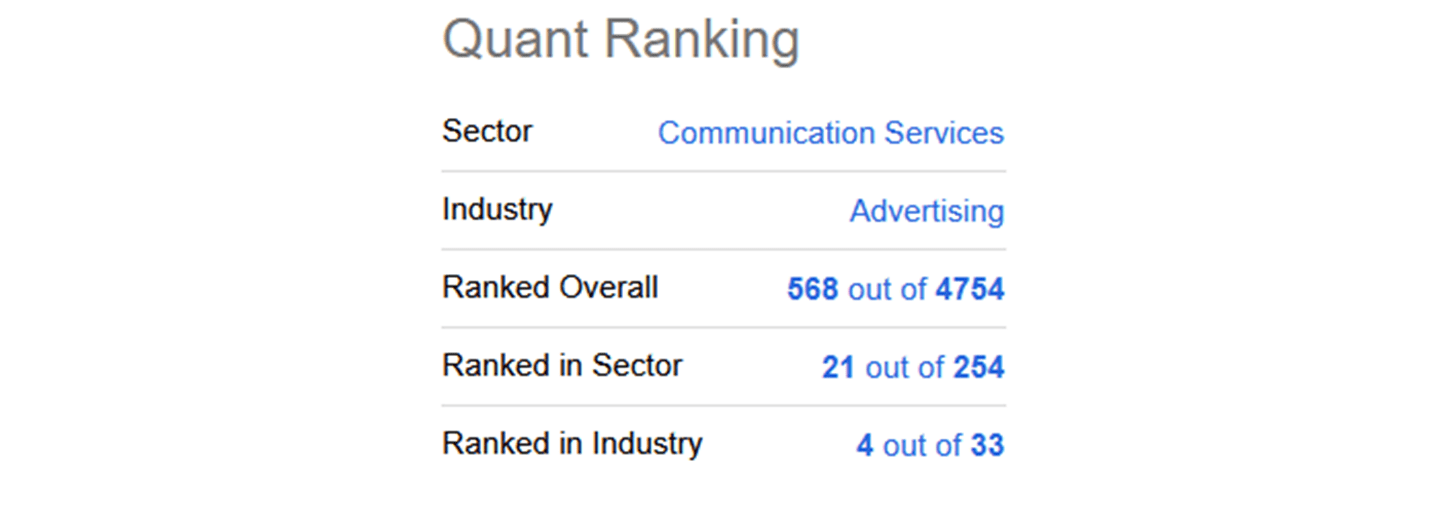
From $11 per share, I am modeling potential downside in a worst-case recession scenario back to $7 (still above November’s $6 low). Against this risk of a -40% loss, upside is truly unlimited. Projecting a $15 or $20 share price by the end of 2023 is not difficult. All told, investment gains of +40% to +80% over 12 months are within the realm of possibilities, using the valuation ratios mentioned in the article on top of growing operating results. Given my recession and bear market forecast for U.S. stocks overall, I am projecting a $14 to $16 quote for Magnite by the end of next year. Such would be good for a constructive “outperformance” gain vs. the S&P 500, after two years running of investment losses.
Thanks for reading. Please consider this article a first step in your due diligence process. Consulting with a registered and experienced investment advisor is recommended before making any trade.
Be the first to comment