

Bim
Research Thesis
In Part 1 of this developing sequel, we analyzed the state of the housing market and two promising stocks expected to deliver strong results in the turbulent market environment. Today, we explore the more recent changes in the housing market to justify why a crash scenario is far from happening and why it might be a good time to build a position in high-quality homebuilding stocks such as Lennar Corporation (NYSE:LEN).
The Housing Market Outlook (Update)
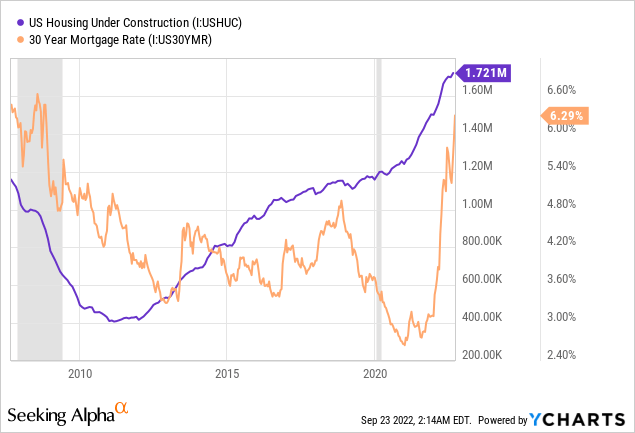
U.S. housing is amid a cyclical correction as an aggressive FED policy has sent borrowing costs to the highest in over a decade and deteriorated affordability. Industry volume is poised for a moderate decline, with builders putting a halt on new construction as they work through a record backlog. Home prices could also come under pressure after multiple years of continuous gains, particularly in the past two years. Mortgage rates have risen significantly as Federal Reserve policymakers step up efforts to contain persistently high inflation. Last week, the FED boosted rates by 75 basis points for a third straight meeting. Consequently, the 30-year fixed rate, which started this year at 3%, is now close to 6.5%.
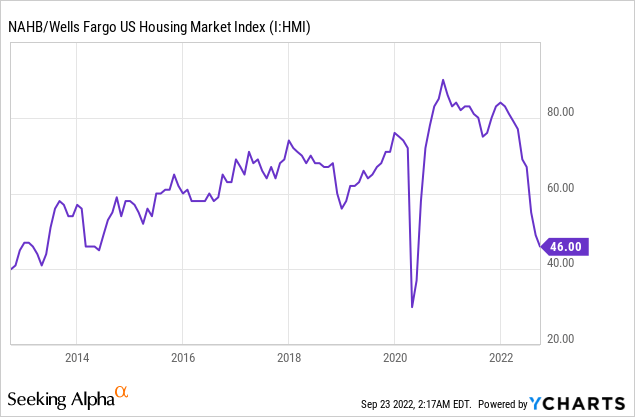
A recent report on homebuilder sentiment has shown that sentiment has fallen to its lowest level since May 2014. Moreover, the FED continued its mission to bring down inflation in the 2-3% range and noted in his press talk that the U.S. housing market will likely go through a rebalancing phase. Even though the outlook of the current housing market appears grim, the outright collapse of the housing market is very unlikely as there is still an acute shortage of single-family homes for sale in the market. However, the NAHB index shows the sentiment in the market through monthly surveys of National Association of Home Builders members has fallen for a ninth consecutive month, mainly due to rising interest rates, persisting supply chain disruptions, and housing affordability concerns.
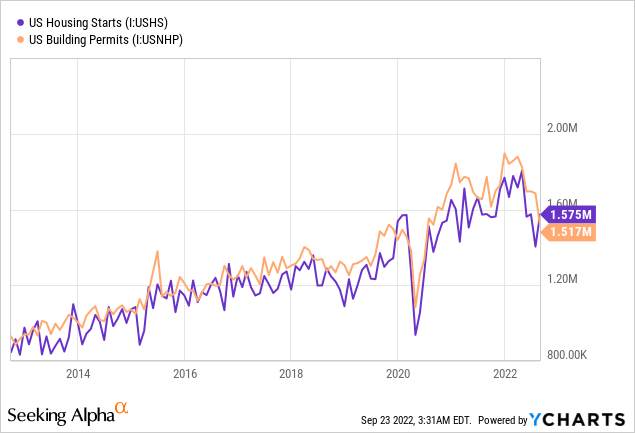
New Residential starts unexpectedly increased by 12.2% in August to 1.58 million units, led by a jump in multifamily projects amounting to 612,000, representing a monthly increase of 28.6% and an annual increase of 31.0%. While the number of home starts in the single-family sector increased by 3.4% month-over-month to a pace of 935,000, although the sector is still experiencing growth, the rate remained 14.6% lower than the previous year.
The existing home sales too dropped for a seventh straight month in August as affordability deteriorated further amid surging mortgage rates and persistently high home prices. Recent industry commentary suggests that builders are resorting to cuts in base prices, along with greater use of incentives, to move inventory. I expect this trend to persist, given the significant inventory expected in the coming months. Builders are likely to concede on price and margin to maintain an acceptable level of sales.
Often viewed as an indicator of future construction activity, building applications fell to an annualized 1.52 million, the lowest level since June 2020. The decline in building permits indicates that residential development is under pressure, as rising borrowing rates and prices exacerbate affordability issues and weigh on sales. The inventory of single-family housing under construction fell 0.4% to a rate of 812,000 million units, which shows that builders are likely foregoing applying for new permits while working through their backlogs.
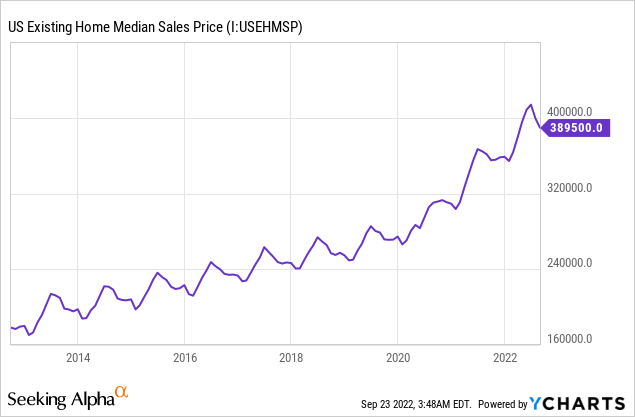
Even with interest rates making housing even less affordable, home prices were still higher than a year ago, supported by tight supply. The median price of an existing home sold in August was $389,500, up 7.7% from a year ago. However, the number of homes for sale fell 1.5% in August to 1.28 million. At the current level of demand, it would take 3.2 months to exhaust the current inventory of existing homes. Anything below five months of supply is seen as indicative of a tight market by realtors.
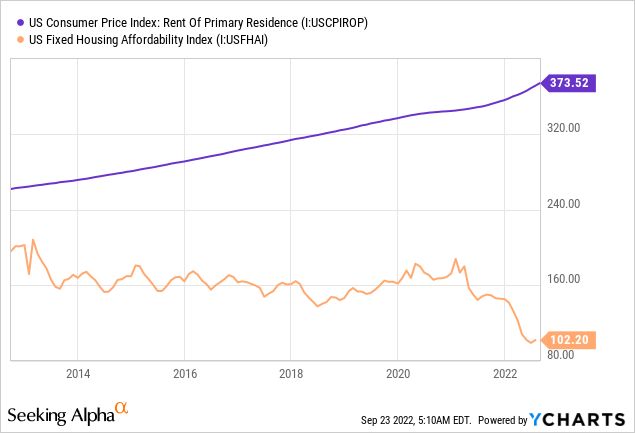
With many potential homebuyers being priced out of the market, single-family house rentals have increased dramatically in recent years. The booming rental market is also a reason causing the prices of homes to remain elevated. Discouraged by the sluggish housing market and able to benefit from the booming home-rental business, home sellers throughout the United States are deciding to keep their homes and rent them out instead.
Higher mortgage interest rates have diminished homebuying demand, and homes have been sitting on the market for a long. In several areas, home values have declined from recent highs, and many sellers are unwilling to reduce their asking prices. As potential sellers shift from selling to renting, the supply of housing for sale is being pulled out of the market. The lack of available houses is a major factor in why prices continue to rise even as sales fall.
The Housing Market Is Not Crashing
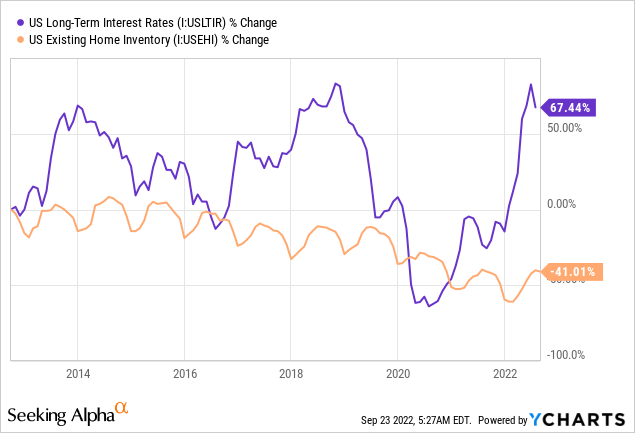
The drop in demand is mostly caused by increasing interest rates and a faltering economy. Freddie Mac’s regression analysis reveals that a 1 percent increase in mortgage rates slows home price growth by around four percentage points. Ultimately, for increasing loan mortgage rates to bring down home prices, we would need significantly less demand and a far greater housing supply than we already have. Although a moderation in home price growth is on the cards, it is quite unlikely that home prices will decline by a big percentage.
The current state of the housing market is significantly better than what it was a decade ago as less leverage and a much higher share of equity ownership provide a cushion to the market as opposed to instances in the past which triggered the housing collapse. The key factor preventing a collapse in home values now is inventory scarcity. While housing completions remain subdued (affected by supply chain issues), new supply will keep coming on the market, with a record number of properties under construction. That supply will join with lower demand to cool house-price gains.
The recent highs in the housing market were propelled by record-low interest rates in 2020 and 2021, as well as a limited supply due to underbuilding. However, the robust demand from first-time homebuyers is also almost as important as the limited new supply.
As work-from-home becomes more prevalent, it is projected that the housing market will continue to be undersupplied and that migration to lower-cost locations will increase. This is crucial since most expanding cities have a severe housing shortage as a result of a prior population influx.
Furthermore, the present housing market is being driven by favorable age demographic trends and is expected to support the supply-demand dynamics in case of a recession. The favorable demographic trends indicate that the solid demand for first-time homeowners will endure. This is because there are still a significant number of younger renters with adequate income to fund homeownership, and they are expected to remain a powerful force for the foreseeable future. In the medium term, as the economy endures numerous headwinds, these variables should continue to influence the housing market.
Market Outlook Until The End Of 2022
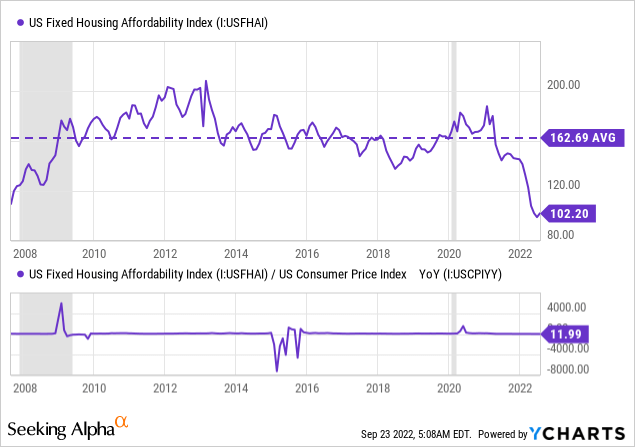
In the second half of 2022, affordability will be a concern for many, as home prices will continue to rise, and consequently, house price growth will moderate. However, a tight supply-demand dynamic amidst more than a decade of chronic underbuilding in the sector, coupled with millions of millennials entering the homebuying stage of life, will ensure that the sector avoids a major crash, as seen in the past.
Lennar Corporation: Top Pick
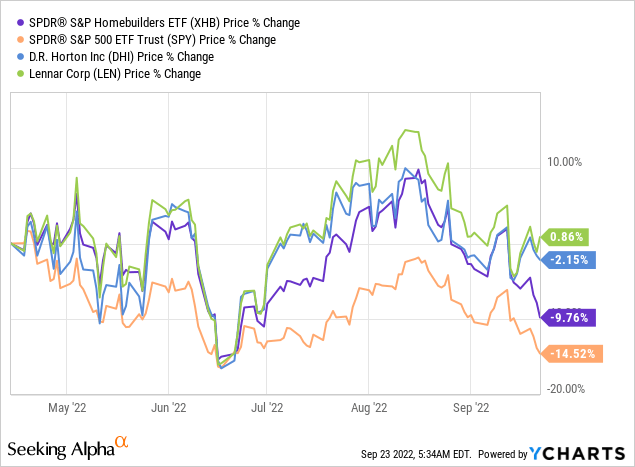
In part 1 of this sequel, we explored D.R. Horton, Inc. (DHI), the largest US homebuilder, and the stock has remained relatively stable since then compared to the sector’s SPDR S&P Homebuilders ETF (XHB), while the second-largest homebuilder Lennar, has outperformed both. Even though the stock has crashed roughly 30% YTD, it still remains undervalued, and in today’s analysis, we explore why LEN remains a buy.
With the FED continuing to raise interest rates, Lennar is placing a greater emphasis on volume and pricing and will likely lean on incentives. Lennar has beat quarterly earnings estimates for Q3 2022, but the housing market’s broader slowdown is reflected in the company’s performance. Lennar’s new orders fell 12% to 14,366 homes in the third quarter, and the company expects new orders at 14,000 to 15,500 for Q4, which may be optimistic given the current market condition.
However, the company considers the tight supply dynamic and offers incentives to maintain its housing pace to attract buyers. The CEO, Lennar’s Miller, indicated that the company’s sales had been affected by higher mortgage costs, but due to the current supply shortage, the company expects demand to stay strong, allowing better navigation through the rebalancing between pricing and interest rates.
In addition to adopting a dynamic-pricing model to ride out the turbulent times in the housing market, Lennar is working closely with its long-term trade partners to adjust their cost structure as per the current market conditions. Moreover, the company has refocused on land acquisition and is adopting a selective approach to new land acquisitions and new communities. In the latest earnings call, the CEO stated:
We have re-reviewed and re-underwritten every land deal in our pipeline, and we are re-underwriting to current market conditions.
Lennar Is Strengthening Its Leadership Position
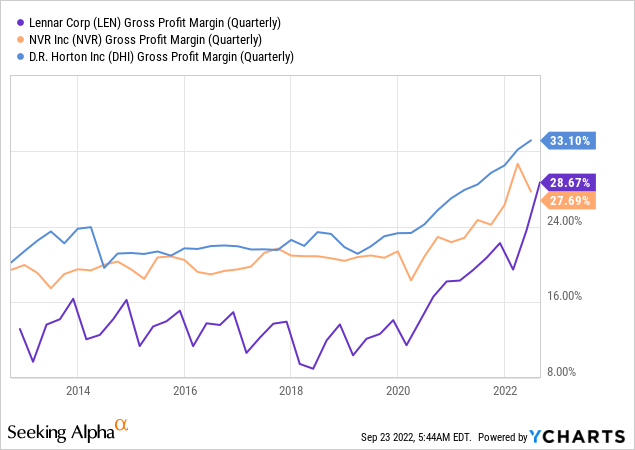
Lennar is one of the top picks in the sector as LEN offers limited downside risk, given the company’s solid market dominance and deep connections in the homebuilding market. As one of the nation’s largest builders, Lennar enjoys certain benefits from its scale that some smaller builders may find difficult to replicate. Furthermore, the company has generated above-average margins among public peers over the past several years.
Lennar’s robust gross margin performance may be attributed to the company’s construction efficiency. The company’s “Everything’s Included” product approach, reduced floor plan selections, and centralized buying have streamlined the construction process, decreasing construction costs and cycle times. In addition, Lennar’s scale and reputation in the industry have helped the company build a strong relationship with its suppliers and contractors. I believe this allows Lennar to navigate turbulence in the market smoothly with better negotiating power than its peers.
The first-time buyers will remain the key driver of demand in housing, and Lennar is poised to capture this segment with its increased mix of entry-level homes. In addition, Lennar has a sizable land supply, allowing the business to fulfill future demand while concentrating on increasing cash flows and keeping a healthy balance sheet. The company ended the quarter with 184,000 home sites owned and 307,000 home sites controlled, combining 491,000 home sites. This translates into 2.9 years of home sites owned, an improvement from 3.3 years in the prior year, and 63% home site control, an improvement from 53% in the prior year. The strong portfolio of home sites provides the company with a strong competitive position to continue to grow its market share.
The company has made headway on its lighter land acquisition strategy, which aims to lower the amount of capital invested in land by acquiring smaller land parcels and relying more on land options to purchase property on a just-in-time basis. I have previously urged the critical importance of this approach that allows the firm to achieve higher returns on invested capital and cash flows over the current housing cycle.
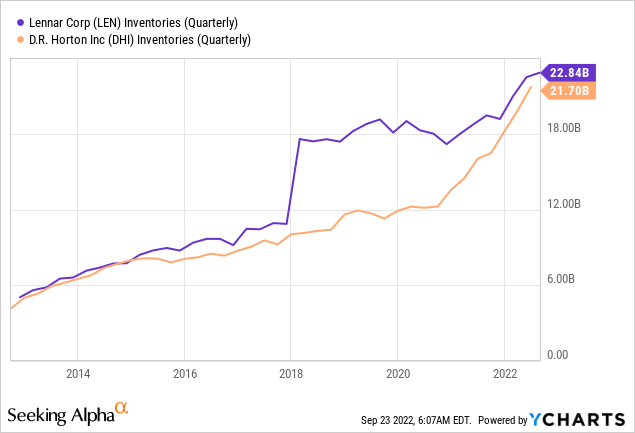
Moreover, it is expected that the company will maintain tight inventory control. Although Lennar’s inventory was up 20% YoY at the end of Q3 2022, the company highlighted that the increase in inventory level resulted from supply chain dysfunction and expanded cycle time. The management expects the inventory levels to shrink and generate substantial cash flow in the future.
A Regional Analysis Snapshot Of LEN’s Markets
Providing regional color regarding demand trends during Q3, LEN broke down its 38 markets into three categories, including those with no to minimal impact from the weaker environment (9 markets), those with modest impact (22), and those with more significant impact (7). Markets with no to minimal impact included Southwest Florida, Southeast Florida, Palm Atlantic, New Jersey, Maryland, Virginia, Charlotte, Indianapolis, and San Diego. Of note, however, while these markets remained strong, sales pace and pricing have begun to flatten at the same time. As a result, to maintain sales and momentum, LEN has offered mortgage buydown programs and normalized incentives.
Markets with a modest softening in pricing include 22 markets, including Tampa, Raleigh, Dallas, and Houston. These markets have seen traffic slow along with an uptick in cancellation rates. While inventory is limited in these markets, LEN has offered more aggressive financing programs and targeted price reductions to keep sales in line with production, which has been successful. Lastly, markets that reflect a more significant softening and correction include the Philly Metro area, Minnesota, Pensacola, Austin, Reno, Boise, and Utah.
Nevertheless, the company’s efforts to reduce the prices in many communities and offer highly competitive mortgage programs have begun to generate increased sales activity, mitigating a large part of the risk.
LEN Stock – A Positive Risk & Reward Profile
Undoubtedly, the main risk of an economic downturn will lead to declining sales and contracting margins for homebuilders. Even though LEN engages in multifamily business, which is inherently riskier than other types, the company has hedged its risk exposure by outsourcing and using joint ventures to deliver those projects. Additionally, the company has a prudent allocation of capital and has wisely used the acquisition strategy to buy smaller homebuilders and fund its growth. The company remains underleveraged compared to its peers while maintaining ample liquidity and around $1.3 billion in cash, which allows targeting smaller players in the current low valuation environment.
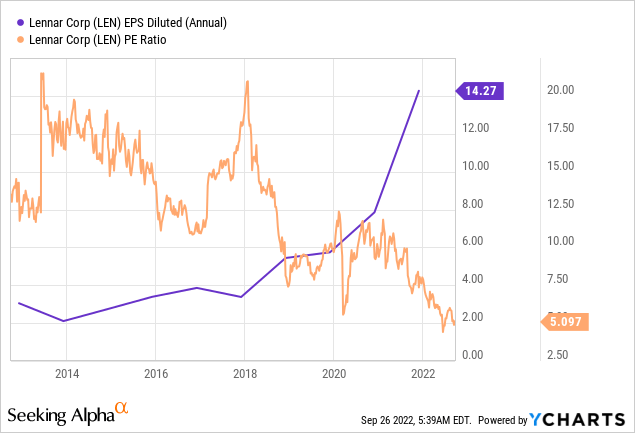
Not surprisingly, LEN has consistently increased its DEPS since 2014, with only a minor pullback in 2017, while the market keeps assigning lower valuations year over year, suggesting an intrinsically undervalued investment. Thus, the recent pullback has factored in the stock price the relevant risks and, accounting for the slowing housing market demand and the slower expected growth through 2024-2025, I maintain my target price of $121 for the next three to five year period, implying a 57% upside from the current levels.
Takeaway
The housing market is far from crashing, and the fears are overblown, driving homebuilders’ stock valuations to historically low levels. But, undoubtedly, house prices and demand will keep softening, weighing in homebuilders’ sales and profit margins.
I do not anticipate a collapse in home prices for the rest of 2022; instead, I anticipate additional pullback, which is common for any asset class. For the rest of 2022 and throughout 2023, home price growth in the United States will continue to “moderate” or slow down. Nevertheless, value investors with at least three years of investment horizon should consider quality homebuilding stocks such as LEN.
Be the first to comment