

halbergman/E+ via Getty Images
If I told you that homebuilder stocks (BATS:ITB) are now down nearly 30% for the year, would you believe me? What if I told you that these same homebuilders are trading for less than 5x earnings in many cases, implying a massive slowdown in earnings or even losses for homebuilders? I covered this earlier this year as probably the most under-the-radar story of this year.
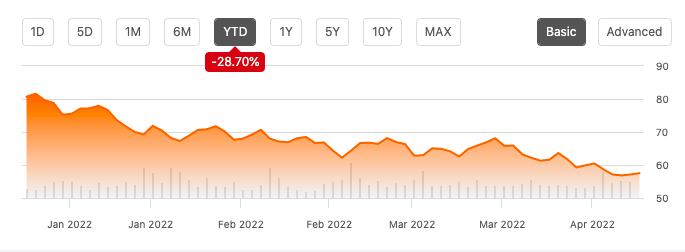
ITB Chart – Seeking Alpha
The actions of investors in homebuilder stocks imply that the housing market is about to see a substantial correction, mirroring similar price action seen in 2006-2007 when earnings were high but trouble loomed on the horizon. Meanwhile, sell-side analysts continue to raise earnings estimates while panicked home buyers are still scrambling to purchase homes irrespective of price. There are two scenarios here to consider.
- The traders are right and the home buyers are wrong. This is probably the most likely scenario given that banks and long/short hedge funds have sophisticated data on consumer-facing stocks like retailers and homebuilders, while many buyers are acting on emotion. Academic research shows that the stock market tends to lead the real economy by 6-12 months, so this would portend a looming housing correction hitting full steam by autumn.
- The buyers are right and the traders are wrong. I don’t think this scenario is right but it should be considered. Given that homebuilder stocks are trading for 5x earnings or less, this would make them among the highest upside stocks in the market if this time is indeed different. I don’t think there’s much dispute that housing is cyclical, but if the cycle lasts longer than expected you could find yourself saved by the bell with a nice profit to spare.
My very first article for Seeking Alpha was on the housing market, highlighting how home prices were out of whack with fundamentals for some hot housing markets in the US given that mortgage rates don’t always go down.
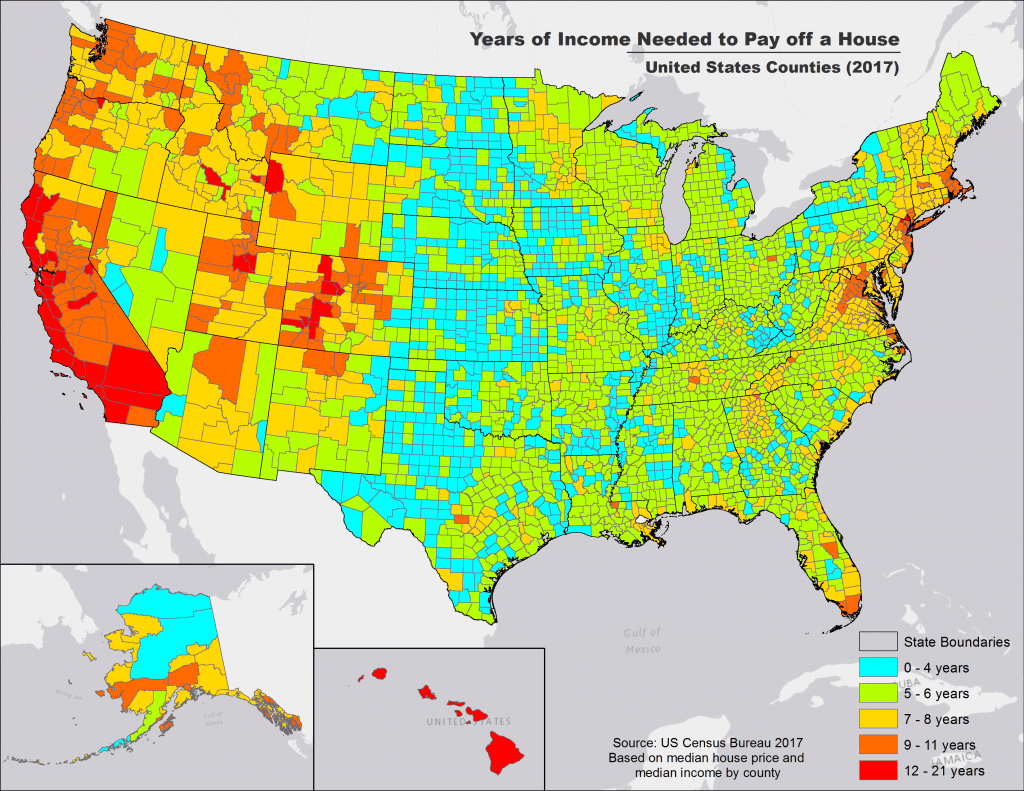
Home Prices vs. Income (Census Bureau)
The U.S. housing market was fairly balanced before the pandemic (outside of the West Coast, New York City, and some resort areas), but the basic idea was that home prices had risen enough that further increases in the mortgage rate would start to cause prices to fall. This was true on both counts, as ITB fell about 20% until rates started to fall again and the median home price ticked down in the US. Especially at the high end of the market, homes were hard to sell. Nationally, the U.S. had plenty of affordable, high-quality housing, but the trouble is much of it isn’t within commuting distance of good jobs. Of course, realtors and mortgage brokers put out research saying that there was a huge housing shortage of millions of homes before the pandemic, but I don’t think the data showed a serious shortage of any kind on a national level.
We’ll never know how the thesis would have played out over the full economic cycle, because 18 months after I wrote my housing article, the coronavirus pandemic threw the economy for a massive rollercoaster ride.
Why Is The Housing Market In Trouble Now?
In short, rising rates on top of previous price gains.
There are a lot of people out there who think housing is a no-risk, high-return investment. History shows that this clearly isn’t true, but like stocks, it’s clear that housing does have a positive return in the long run. As in stocks, most people transact too much, pay excessive fees and get middling returns, but long-term investors tend to come out fine.
Pre-pandemic studies show that the long-run (unleveraged) returns to housing are about 5%-7% annually when you account for price appreciation and the rent you save from owning a home. This said – I think the returns to housing in the future are likely to be lower than they have been in the past, given sky-high prices, population growth slowing to zero, and homebuilders continuing to add supply.
The problem here now is the speed and magnitude of the move in interest rates. Let’s use a hypothetical example of a young family looking for a $625,000 home with a $500,000 mortgage. At a 3% mortgage, the monthly principal and interest payment comes out to roughly $2100 per month. At a 5% mortgage, the same house will cost roughly $2700 per month. Mortgage rates appear headed to 6%, which would take the payment to roughly $3000. This change has happened in the last three months, meaning that many people signed contracts thinking their payment would be $2,100 and now it’s $2,700 if they didn’t have a rate lock. When your wife and kids love the house but your payment changes due to the Federal Reserve removing emergency support for the mortgage market, you’re probably just going to have to eat the change in price, even if it’s a substantial chunk of your disposable income. But new buyers are likely to make different calculations.
At a 3% rate, our hypothetical young family can qualify to buy a $720,000 home with a $100,000 annual income using the traditional 36% DTI rule, a 20% down payment, and assuming no other debt. At 5%, this same family can only qualify for a $587,000 home. This is all in the last three months. At 6%, they can only qualify for a $533,000 purchase. Mechanically speaking, doubling interest rates from 3% to 6% reduces buyer purchasing power by nearly 25%. Wages aren’t up very much since the pandemic, so if buyers can’t get cheap interest rates, they won’t be able to pay up for homes. This process will be even starker in places like Canada where variable-rate mortgages predominate and payments reset.
We can divide the national housing market into four quadrants this way. Demographics and the dynamics of local economies will make houses trade for different prices in different areas, but the macro assumptions should hold for any market.
- The first quadrant is low prices and low rates (i.e., 2009-2016). This is the best time to buy a home as your payment is lowest and you can benefit from a rise in prices.
- The second quadrant is low prices and high rates (i.e., the 1990s and early 2000s before the bubble got rolling). This is the second-best scenario because if rates drop you can refinance your house, your payment will go down, and you’ll have more money to spend.
- The third quadrant is high prices and low rates. This was the situation in 2020, and this is fine too if you plan on staying in the home you buy for a long time. You can get a fair deal this way, but if rates rise, it can be tough to find a buyer who can qualify to buy your home. Interestingly, when the subprime boom was rolling in the US in the 2000s, buyers took out adjustable-rate mortgages that kept them in quadrant 3 for a couple of years but then dumped them into quadrant 4 when their payments reset. This also explains how home prices rose faster than median incomes in the 2010s, but mortgage payments stayed reasonable.
- The fourth quadrant is high prices and high rates (i.e., 2006 and now). If you pay a high price relative to your income and the income of your resale buyers for a house and have a high mortgage interest rate, you’re likely looking at a bad investment. The best you can do is for rates to go down, which gets you back to quadrant 3. If you buy in quadrant 4, you’re likely to lose money as prices fall, which can also make it difficult to refinance if rates come down.
I think most people intuitively understand that paying a high interest rate on a home that’s 30% more expensive than one year ago is not a good idea (or their banks will make this decision for them because they don’t qualify), so sales volume will slow dramatically and inventory will build until prices come back down toward where they were in early 2020. Over the next two years, we should steadily move from quadrant 4 to quadrant 2. Unlike last time, rates are unlikely to go down anytime soon with the Fed fighting out-of-control inflation. Note that even with a risk premium for sellers of TIPS, the markets assess the Fed as most likely to be credible in fighting inflation, as seen by 10-year inflation breakevens below 3%.
Most people sell one home to buy another, so they really aren’t “supply” from an economic perspective. Instead, supply comes from housing starts, which are far higher than population growth (decline) would imply we need, and from the 3 Ds (death, divorce, and desperation). One might not expect home prices to go up as much as they did, given existing demographic trends, but emotions are powerful. Past cycles have shown that speculators can turn from a source of demand to a source of supply rather quickly as well.
Isn’t Demand Unstoppable?
A popular narrative is that rental demand is unstoppable and therefore housing prices will continue to rise. But to assess this we need to consider supply and demand in the context of the pandemic response. We’ve established that there wasn’t really a housing shortage before the pandemic, so we shouldn’t expect one in the long run after the pandemic either. The issue was the emergency policies after the pandemic – the eviction moratorium, the foreclosure moratorium, relief checks, expanded unemployment, student loan pause, etc. These policies all served to increase demand while decreasing supply that would otherwise be available.
Since 2020, fewer people worked while more people were able to live on their own. Working is generally a prerequisite to owning your own place, but if the government says you don’t have to, then you don’t, for the first time since WW2.
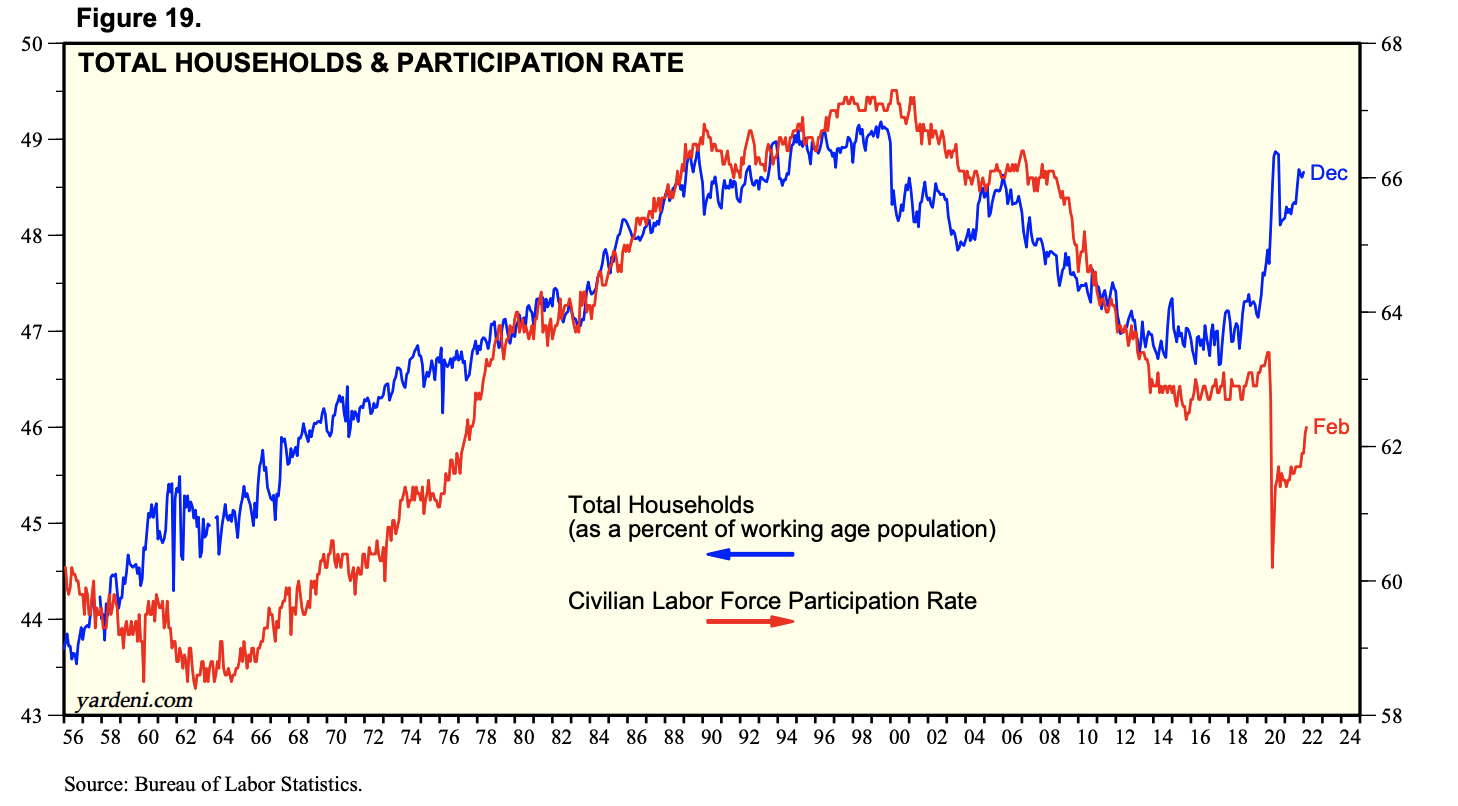
Labor Force Participation vs. Households (BLS)
These will converge. Consumer confidence is low while real wages are falling. Americans are starting to learn the consequences of excessive amounts of government interference in the free market.
The total demand for housing has not fundamentally changed in the long run. Perhaps more white-collar workers will stay in lower-cost-of-living areas and work remotely, but the free market is perfectly capable of handling this transition – we’ve already completed close to 2.5 million homes since the start of the pandemic against a flat population. Instead, housing demand had a lot to do with emergency policies that rippled up and down the economy and will not be continued due to their inherent unsustainability and the economic chaos they caused. Going forward, people will have to work to own or rent housing, and the amount they can afford will depend on how much they earn, as has been the case for 99.9% of history. This will destroy artificial housing demand, leaving only the true demand supported by the jobs market.
Demand overall seems to be slowing. Restoration Hardware (RH) reported earnings late last month and cited rapidly slowing demand. A high-profile analyst called for a slowdown in shipping a couple of days after, challenging the prevailing idea that consumer demand is unstoppable and earnings will smash records in 2022. We’re only three months removed from the child tax credit being removed and the Fed has just begun tightening, leaving a big question mark for what amounts to extremely optimistic earnings estimates across the board. With consumer spending boosted by the wealth effect, what happens when people have to live on what they earn rather than being boosted by government stimulus and speculative profits? I would guess a correction is the result.
Will The Fed Bail You Out?
There seems to be a common belief among speculators in both housing and stocks that the Fed will bail them out if asset prices start to fall. This is a dangerous assumption. Pandemic era policies disproportionately benefited the rich at the expense of the working and middle classes–especially renters who are getting hit by big rent increases due to the aftershocks of the pandemic.
It’s fashionable to believe that the Fed is lying and that they’ll gladly hose the working class and middle class to bail out speculators. I’m cynical, but not quite that cynical. Speculators also are making an implicit assumption that the Fed wants asset prices to go even higher. This contradicts public statements by Fed officials as well as recent research where the Dallas Fed expressed concern about a brewing housing bubble.
The idea that the Fed will bail out the market if the S&P 500 falls 20% peak-to-trough or if the housing market begins to decline is no longer true. My guess is the White House and the Fed are in agreement here that controlling inflation is more important than bailing out house flippers or stock traders. The last time the Fed took a strong stand against inflation was under Paul Volcker’s leadership in the 1980s, and the Fed didn’t listen to the political pundits who cared more about short-term pain than long-term gain. For all the flak he caught for the housing crisis, Alan Greenspan ran a pretty tight ship as well in terms of controlling inflation, and Ben Bernanke ran fairly restrictive monetary policy as well despite helping support the economy during the global financial crisis. Powell backed down from tightening in 2018 with low inflation and asset prices in free fall at the time. Don’t expect him to back down this time with inflation where it is.
Economic theory says that as interest costs rise for the government, it crowds out private investment, which can be bad if it’s overdone. Here, that’s exactly the point, to crowd out speculative demand and restore balance to the economy. Don’t expect the Fed to come to the rescue here.
Bottom Line
Homebuilder stocks are crashing and interest rates are surging, flashing a clear warning to those who are willing to pay attention. The classic advice in Hamlet is to “neither a borrower nor lender be,” and in the housing market, I don’t think most people should be buyers or sellers here given transaction costs. For housing-related stocks, which are more liquid– I’d sell them before the housing correction gets going in full force.
Be the first to comment