

BreakingTheWalls/iStock via Getty Images
Tom Phelps once said, “fortunes are made by buying right and holding on.”
That’s because buying a quality blue-chip can deliver not just generous and safe income to pay the bills today, but also long-term wealth creation that can help you retire in safety and splendor.
But the corollary to that rule is that buying the wrong company, a value trap, can lead to years, or even decades of frustrating low returns, poor dividend safety, and even a failure to achieve your long-term financial goals.
AT&T (NYSE:T), a failed dividend aristocrat, has long been a hotbed of controversy.
Bulls point to some of the best valuations in over two decades as a reason that Ma Bell might make a good investment.
I made 26% annual returns in AT&T by buying this “cigar butt”
Morningstar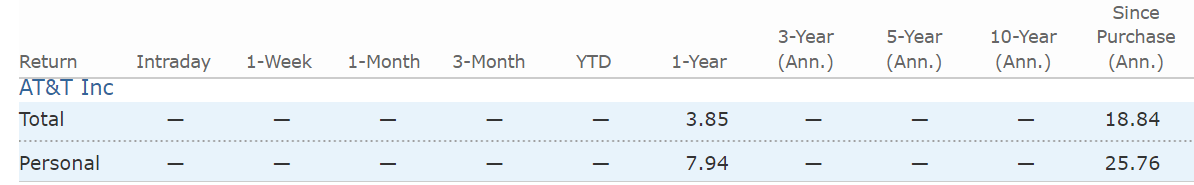
Back when AT&T was still a speculative blue-chip, a struggling aristocrat with a new CEO and a sensible plan to deleverage and grow at a modest 3% rate, I first bought it in October 2020 during a 12-day losing streak, which drove the yield to almost 8%, the best valuation in over 20 years.
I sold my AT&T shares after management announced the merger/spin-off of WarnerMedia with Discovery, and plans to cut the dividend for the first time in over four decades.
Ycharts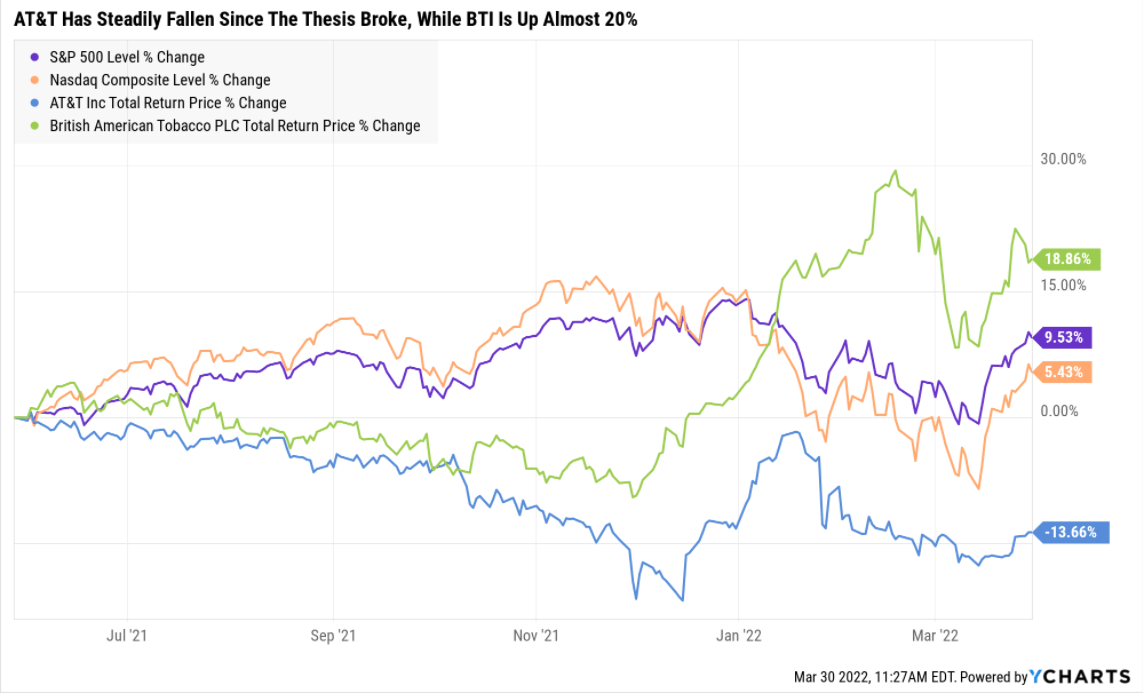
Since I sold AT&T and recommended DK members do the same, it’s down almost 14% including dividends (the dividend was just cut for this coming quarter).
In contrast, the company I put those AT&T proceeds into, British American (BTI), is up almost 20%, double the returns of the broader market.
Stocks are NOT
- symbols on a screen to be traded willy nilly
- a fun way to gamble
- risk-free bond alternatives used purely for income
Stocks are a real ownership stake in a company and that means you need to protect your hard-earned money from poor and deteriorating fundamentals.
Buy the right blue-chip, at a reasonable to attractive price, and you can retire rich and stay rich in retirement.
Buy the wrong company, and stubbornly refuse to admit the facts have changed, and you could suffer a permanent catastrophic loss of capital.
“When the facts change, I change my mind. What do you do sir?” – John Maynard Keynes
So let me first share with you the three reasons why I consider AT&T a value trap to avoid.
Then I’ll share with you seven higher-yielding far superior blue-chips.
- Verizon (VZ)
- Magellan Midstream Partners (MMP) – uses a K1 tax form
- BASF (OTCQX:BASFY)
- Altria (MO) – dividend king
- Allianz (OTCPK:ALIZY) – hasn’t missed a dividend payment in 130 years
- Main Street Capital (MAIN) – monthly dividend stock
- Realty Income (O) – monthly dividend stock
Why are these 7 blue-chips better than AT&T?
- they yield a very safe 6.0% (more than AT&T’s 4.6%)
- are growing at 6.2% (2X AT&T’s rate)
- are expected to deliver 12.2% CAGR long-term returns (compared to AT&T’s 7.8%)
- similar to the 11.7% CAGR returns they’ve delivered since 2008
Historical Returns Since 2008 (Annual Rebalancing)
Portfolio Visualizer Premium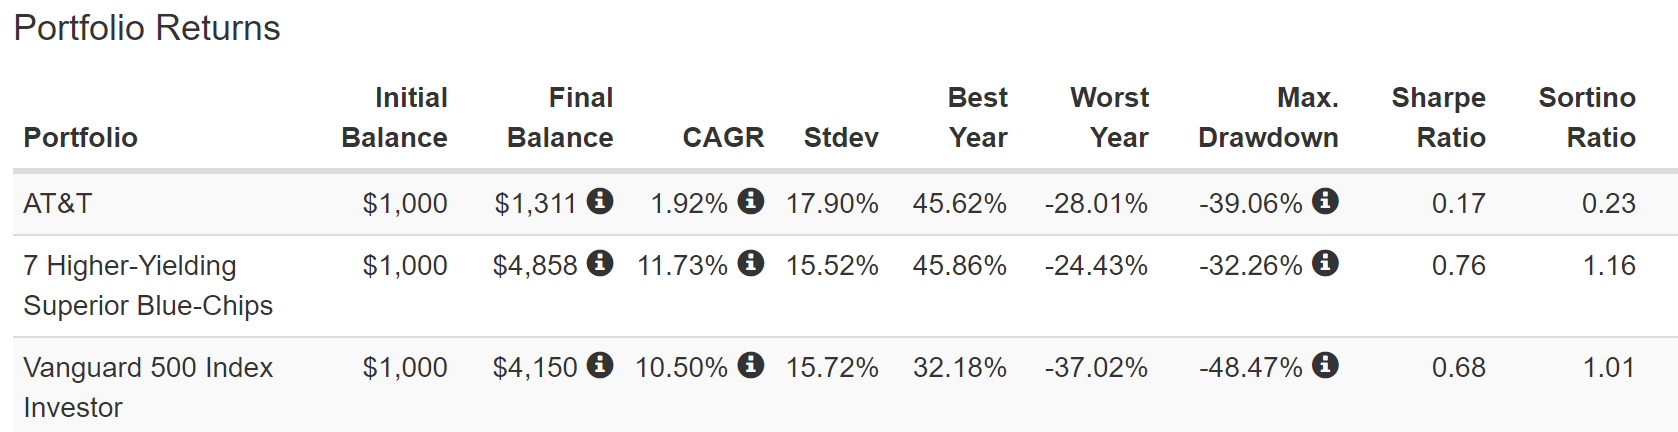
Not just are these higher-yielding blue-chips far higher quality, they are proven market beaters that have run circles around AT&T for the last 14 years (actually far longer than that).
They are low volatility stocks that have delivered 15% better volatility-adjusted returns than the S&P 500 and 400% more than AT&T.
So let’s go on a journey together, to see how to recognize a value trap like AT&T, and potentially find much better ways to help you achieve the rich retirement of your dreams.
3 Reasons Why AT&T Is A Value Trap To Avoid
There are many time-tested ways to measure the quality, safety, and dependability of companies.
Which ones do I entrust my life savings to? All of them.
The Dividend King’s overall quality scores are based on a 241 point model that includes:
-
dividend safety
-
balance sheet strength
-
credit ratings
-
credit default swap medium-term bankruptcy risk data
-
short and long-term bankruptcy risk
-
accounting and corporate fraud risk
-
profitability and business model
-
growth consensus estimates
-
management growth guidance
-
historical earnings growth rates
-
historical cash flow growth rates
-
historical dividend growth rates
-
historical sales growth rates
-
cost of capital
-
long-term risk-management scores from MSCI, Morningstar, FactSet, S&P, Reuters’/Refinitiv, and Just Capital
-
management quality
-
dividend friendly corporate culture/income dependability
-
long-term total returns (a Ben Graham sign of quality)
-
analyst consensus long-term return potential
In fact, it includes over 1,000 fundamental metrics including the 12 rating agencies we use to assess fundamental risk.
How do we know that our safety and quality model works well?
During the two worst recessions in 75 years, our safety model 87% of blue-chip dividend cuts, the ultimate baptism by fire for any dividend safety model.
And then there’s the confirmation that our quality ratings are very accurate.
DK Zen Phoenix: Superior Fundamentals Lead To Superior Long-Term Results
| Metric | US Stocks | 187 Real Money DK Phoenix Recs |
| Great Recession Dividend Growth | -25% | 0% |
| Pandemic Dividend Growth | -1% | 6% |
| Positive Total Returns Over The Last 10 Years | 42% | 99.5% (Greatest Investors In History 60% to 80% Over Time) |
| Lost Money/Went Bankrupt Over The Last 10 Years | 47% | 0.5% |
| Outperformed Market Over The Last Decade (299%) | 36% | 51% |
| Bankruptcies Over The Last 10 Years | 11% | 0% |
| Permanent 70+% Catastrophic Decline Since 1980 | 44% | 0.5% |
| 100+% Total Return Over The Past 10 Years | NA | 88% |
| Sources: Morningstar, JPMorgan, Seeking Alpha |
Basically, historical market data confirms that the DK safety and quality model is one of the most comprehensive and accurate in the world.
This is why I entrust 100% of my life savings to this model and the DK Phoenix blue-chip strategy.
So how does AT&T score on one of the world’s most comprehensive and accurate safety and quality models?
AT&T Dividend Safety (The New Smaller One)
| Rating | Dividend Kings Safety Score (151 Point Safety Model) | Approximate Dividend Cut Risk (Average Recession) |
Approximate Dividend Cut Risk In Pandemic Level Recession |
| 1 – unsafe | 0% to 20% | over 4% | 16+% |
| 2- below average | 21% to 40% | over 2% | 8% to 16% |
| 3 – average | 41% to 60% | 2% | 4% to 8% |
| 4 – safe | 61% to 80% | 1% | 2% to 4% |
| 5- very safe | 81% to 100% | 0.5% | 1% to 2% |
| AT&T | 56% | 2.0% | 4.80% |
| Risk Rating | Medium Risk (75th industry percentile risk-management consensus) | BBB stable outlook credit rating 7.5% 30-year bankruptcy risk |
2.5% OR LESS Max Risk Cap Recommendation – speculative |
Long-Term Dependability
| Company | DK Long-Term Dependability Score | Interpretation | Points |
| Non-Dependable Companies | 21% or below | Poor Dependability | 1 |
| Low Dependability Companies | 22% to 60% | Below-Average Dependability | 2 |
| S&P 500/Industry Average | 61% (58% to 70% range) | Average Dependability | 3 |
| Above-Average | 71% to 80% | Very Dependable | 4 |
| Very Good | 81% or higher | Exceptional Dependability | 5 |
| AT&T | 55% | Below-Average Dependability | 2 |
Overall Quality
| AT&T | Final Score | Rating |
| Safety | 56% | 3/5 safe |
| Business Model | 70% | 2/3 narrow moat |
| Dependability | 55% | 2/5 below-average |
| Total | 57% | 7/13 Below-Average |
| Risk Rating |
2/3 Medium Risk |
|
| 2.5% OR LESS Max Risk Cap Rec – speculative |
40% Margin of Safety For A Potentially Good Buy |
AT&T is the 3rd lowest quality company on the DK Master List.
The DK 500 Master List includes the world’s highest quality companies including:
-
All dividend champions
-
All dividend aristocrats
-
All dividend kings
-
All global aristocrats (such as BTI, ENB, and NVS)
-
All 13/13 Ultra Swans (as close to perfect quality as exists on Wall Street)
- 48 of the world’s best growth stocks
In order to ensure the highest quality of companies, each week I delete the lowest quality company and replace it with a far higher quality name requested by Dividend Kings’ members.
That’s why AT&T is set for deletion in the coming weeks.
OK, but what if you don’t want to trust our safety and quality model, even with all the evidence that it works?
Reason Two AT&T Is A Value Trap: 35 Years Of Terrible Returns
Ben Graham famously said in the short-term, a market is a voting machine, but in the long-term, it’s a weighing machine, correctly “weighing the substance of a company”.
Fidelity 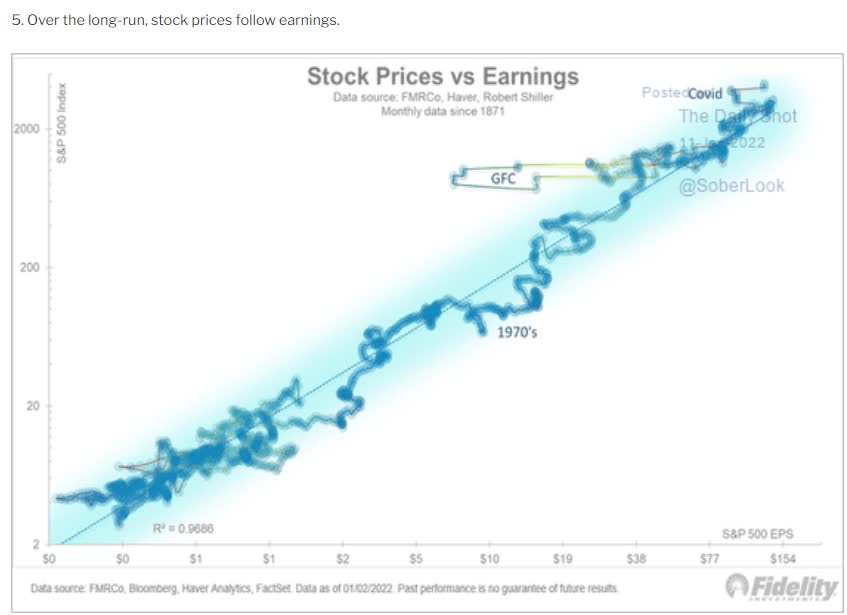
According to Fidelity, a company’s fundamentals over 30+ years determine 97% of its stock returns.
Or to put it another way, if a stock delivers poor returns for over three decades, there is a 97% chance it’s a low-quality company to avoid.
Total Returns Since 1986
Portfolio Visualizer Premium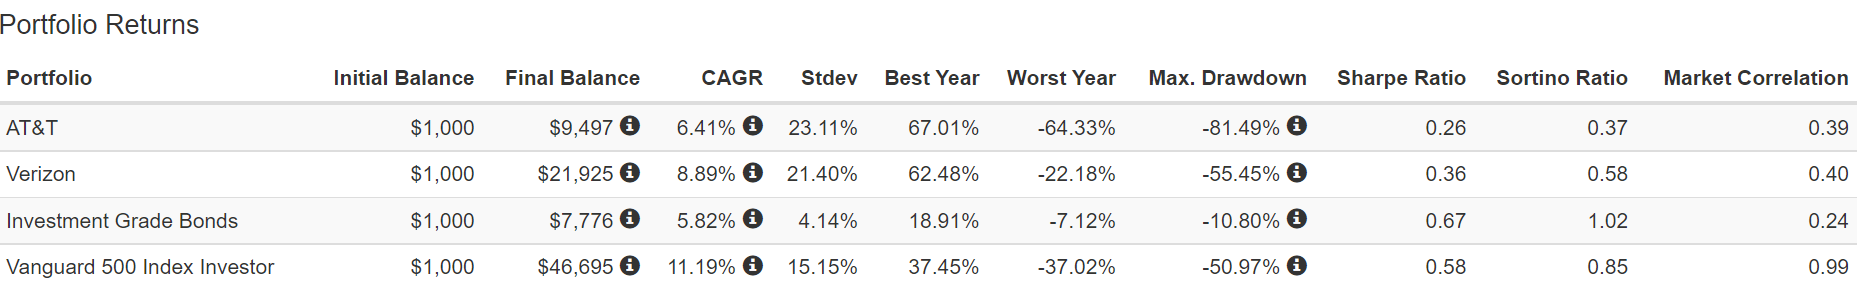
AT&T’s returns over the last 35 years are very poor. So poor it barely outperformed investment-grade bonds which are 6X less volatile and delivered 3X better volatility-adjusted turns.
Verizon is an Ultra SWAN quality telecom and often serves as a top high-yield alternative to AT&T.
You might think that VZ outperforming AT&T by just 2.5% annually doesn’t amount to much. But you’d be wrong.
Verizon: 130% Higher Inflation-Adjusted Total Returns Than AT&T Over 35 Years
Portfolio Visualizer Premium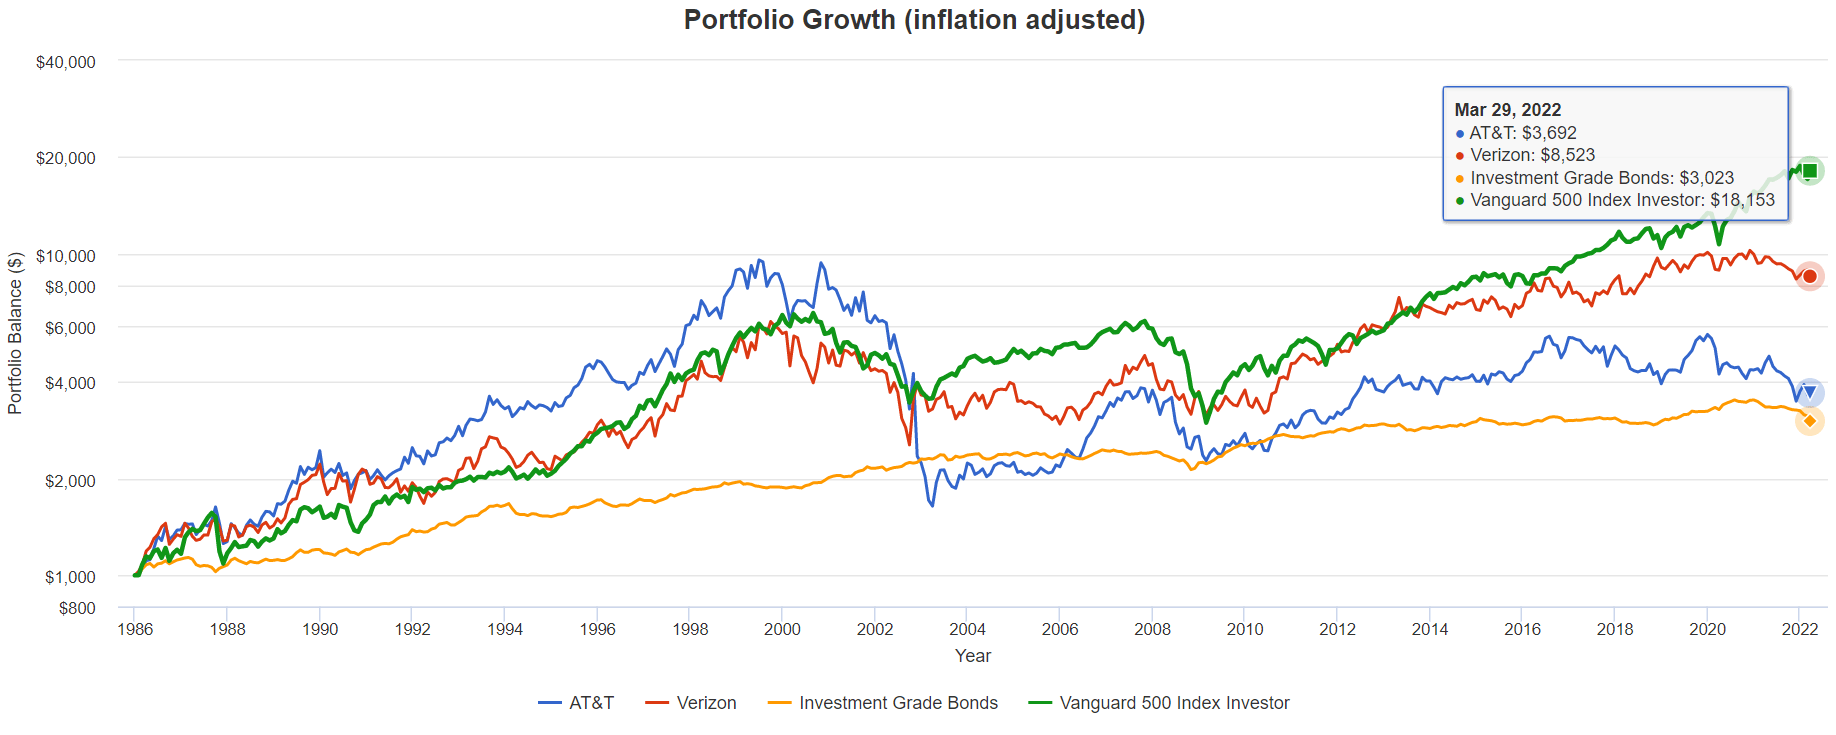
Verizon has delivered 130% higher inflation-adjusted returns than AT&T, which has trailed VZ’s returns since 2003.
- 18 consecutive years of worse returns are strong evidence that VZ is a far superior company
- in fact, there is a 91% statistical chance that VZ is a superior company
Rolling Returns Since 1986
Portfolio Visualizer Premium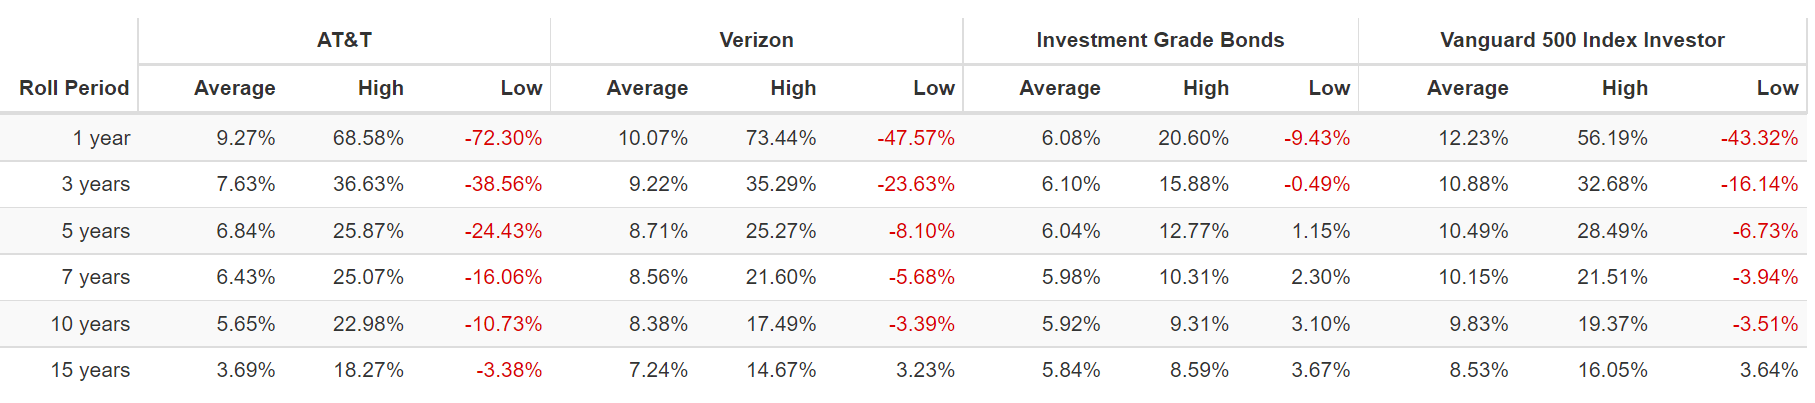
AT&T’s worse returns have come during a bear market that is now in its 19th year!
Portfolio Visualizer Premium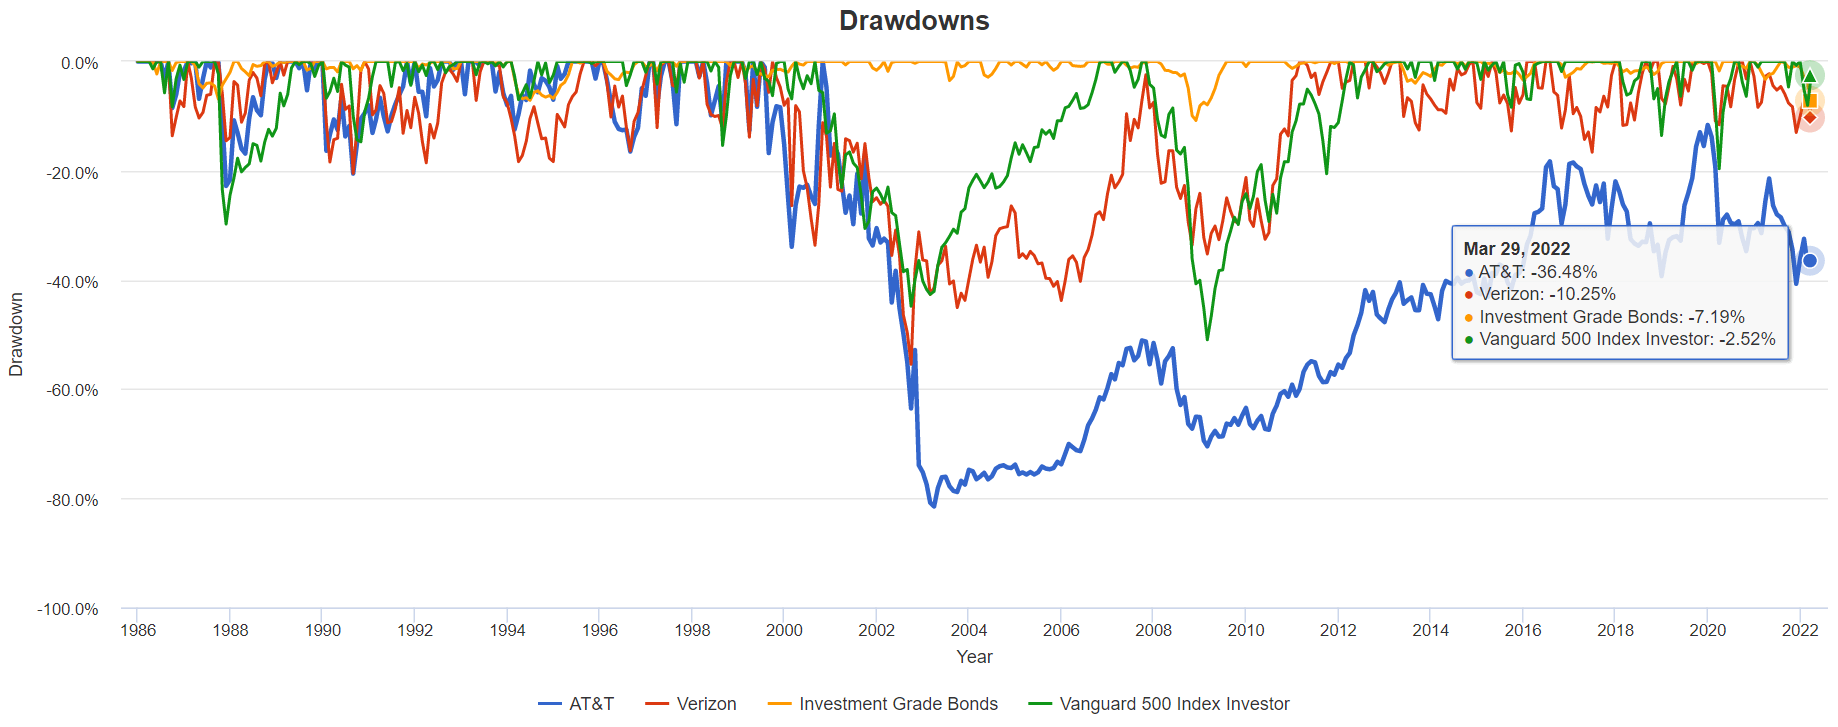
Granted AT&T’s valuation during the tech bubble was insane, but even with dividends it’s still 36% off its all-time highs.
Portfolio Visualizer Premium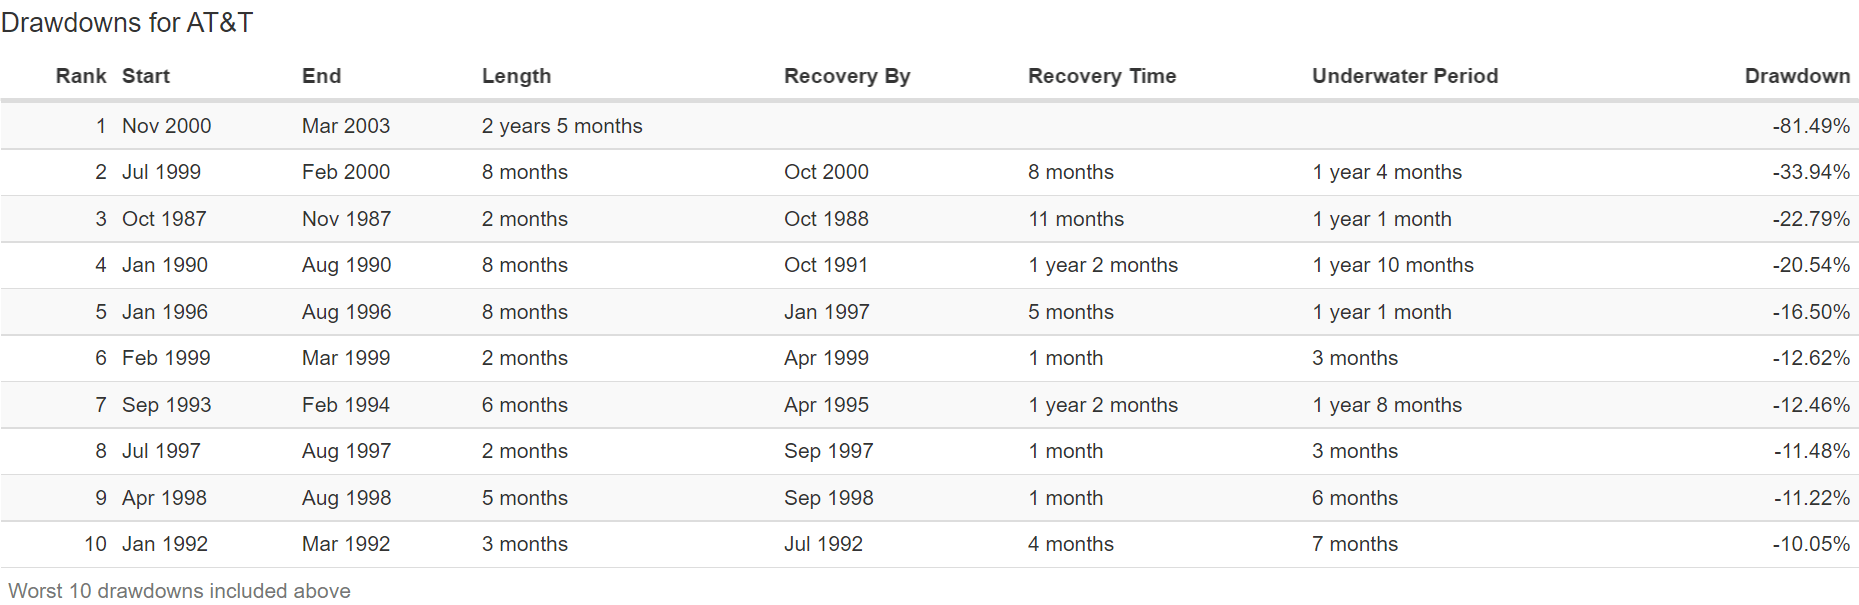
Verizon was also obscenely overvalued during the tech bubble, but it managed to still break even by 2014.
Portfolio Visualizer Premium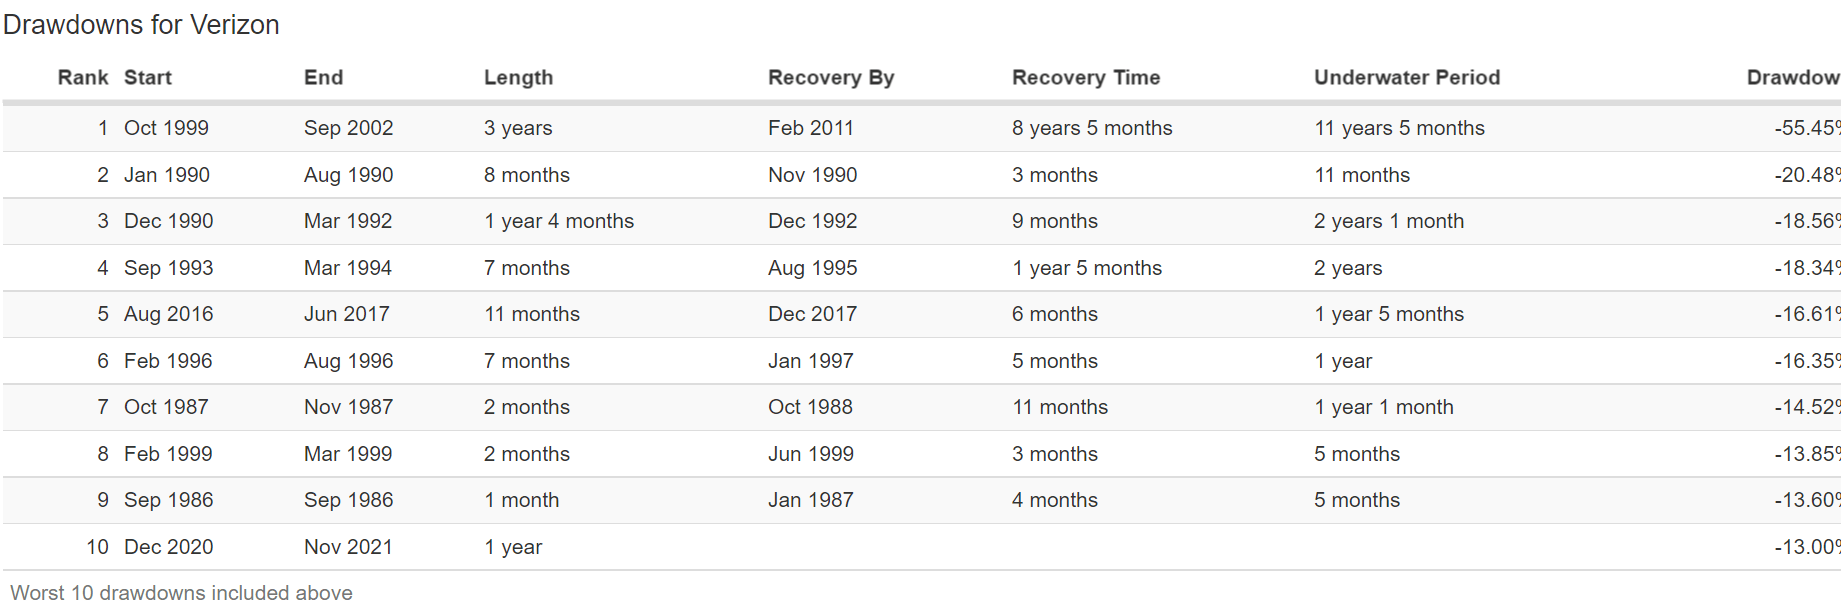
And how many bear markets have Verizon investors suffered since the tech crash? Zero.
Portfolio Visualizer Premium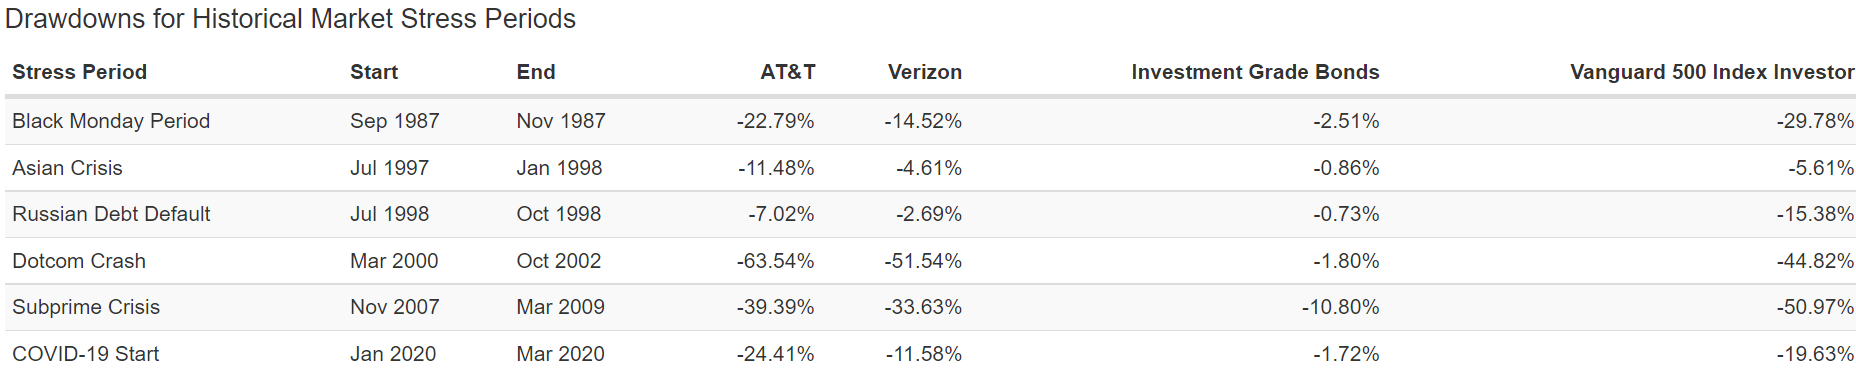
During every major market crisis, AT&T has fallen a lot more than Verizon, showing the power of superior quality to help you sleep well at night when panic grips Wall Street.
Meanwhile, Verizon’s largest correction has been a 17% decline in 2016 and it fell just 12% during the Pandemic crash.
- a 60/40 stock/bond portfolio suffered a 13% decline during the Pandemic crash
So to summarize:
- 130% better inflation-adjusted total returns
- much lower volatility
- far superior quality and management
This is why Verizon is a much better alternative to AT&T.
Reason Three AT&T Is A Value Trap: Poor Long-Term Return Potential
When it announced its plans to slash the dividend and spin off its media properties, AT&T’s new management said it thinks it can deliver 4% to 6% medium-term growth.
AT&T 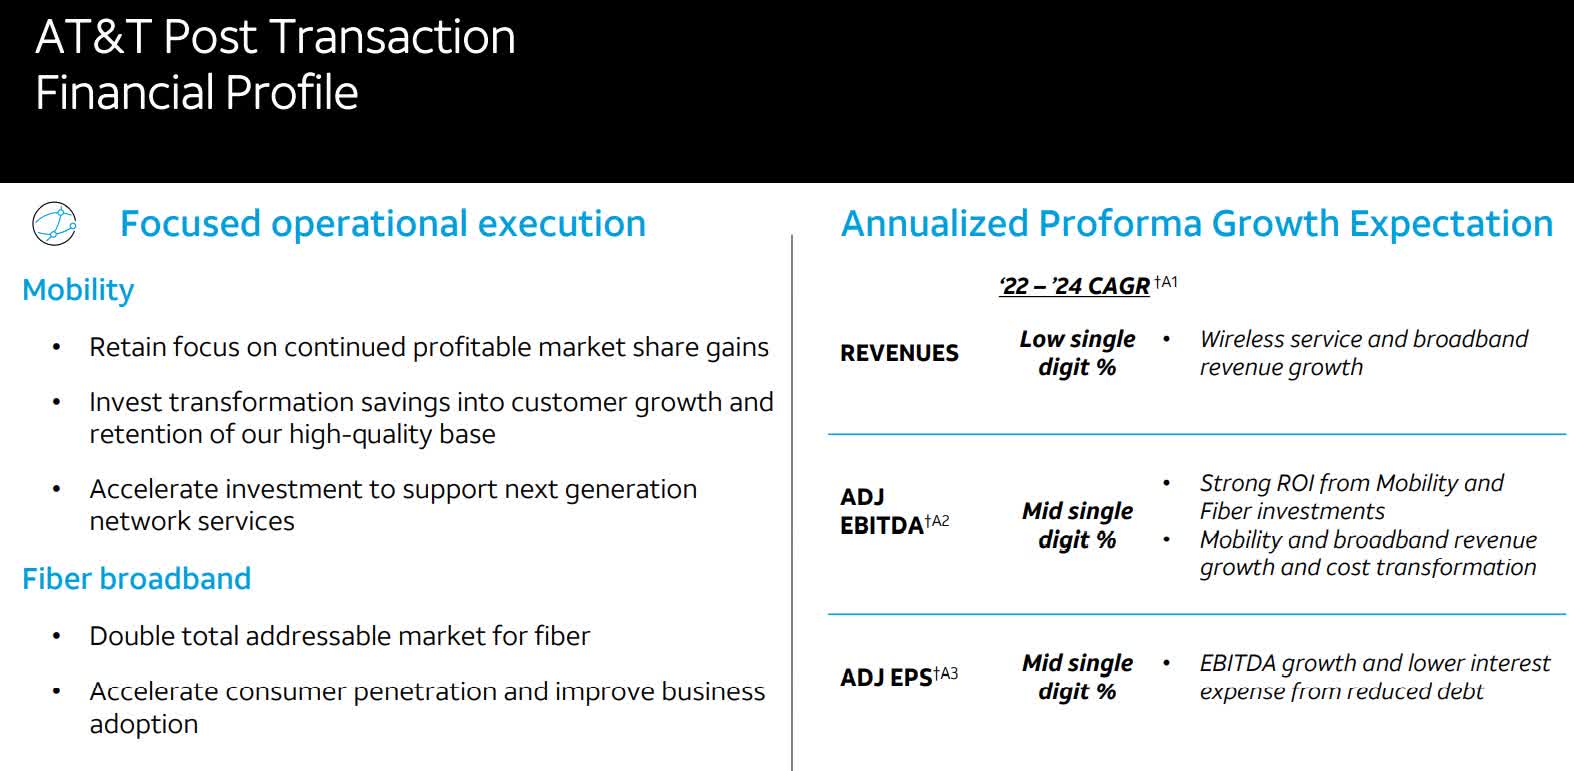
If AT&T were able to accelerate growth to 5% over time, then the new 4.6% yield could potentially deliver 9.6% CAGR long-term returns, a very healthy return for a defensive company.
But the reason I sold my AT&T after the thesis broke was that I was skeptical that AT&T could actually grow at 4% to 6%, even over just the next few years.
And guess what? Analysts now agree with me.
After AT&T has had almost 18 months to execute its turnaround plan, here is what analysts expect in terms of EPS growth.
- 2022 EPS consensus: $2.97
- 2024 EPS consensus: $2.95
- consensus growth rate: -0.34% CAGR
AT&T has a rich history of overpromising and underdelivering. And currently, the 27 analysts that cover it on Wall Street expect it to keep doing that, in grand fashion.
Ok, but what about the long-term? Maybe AT&T’s new pure telecom strategy can result in faster growth in the future?
FactSet Research Terminal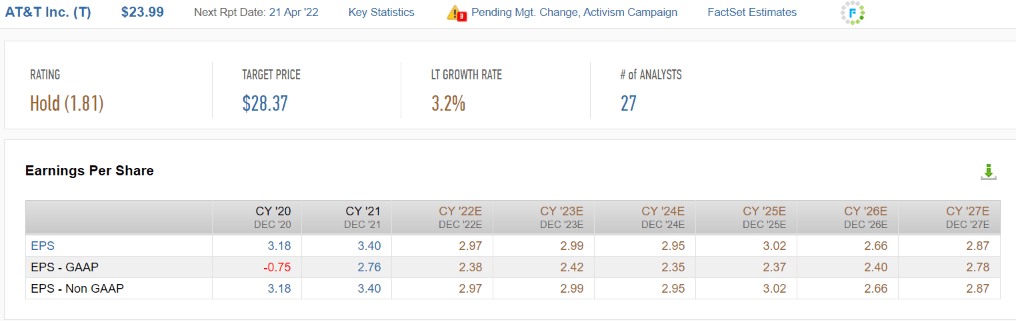
When I first recommended AT&T it was yielding nearly 8% and analysts expected about 3% long-term growth.
Today they still expect 3% long-term growth except that AT&T has cut its dividend almost in half and now yields just 4.6%.
- 8% yield + 3% growth = 11% long-term returns vs 9.9% CAGR S&P consensus
- the reason I was willing to buy a few thousand dollars worth of AT&T
And notice how AT&T isn’t expected to generate positive growth until after 2027! Negative growth for the next five years, the definition of a dead money value trap.
And what about the long-term?
| Investment Strategy | Yield | LT Consensus Growth | LT Consensus Total Return Potential | Long-Term Risk-Adjusted Expected Return | Long-Term Inflation And Risk-Adjusted Expected Returns | Years To Double Your Inflation & Risk-Adjusted Wealth |
10 Year Inflation And Risk-Adjusted Return |
| Europe | 2.6% | 12.8% | 15.4% | 10.7% | 8.6% | 8.4 | 2.27 |
| Value | 2.1% | 12.1% | 14.1% | 9.9% | 7.7% | 9.3 | 2.10 |
| High-Yield | 2.8% | 11.3% | 14.1% | 9.9% | 7.7% | 9.4 | 2.10 |
| High-Yield + Growth | 1.7% | 11.0% | 12.7% | 8.9% | 6.7% | 10.8 | 1.91 |
| Safe Midstream + Growth | 3.3% | 8.5% | 11.8% | 8.3% | 6.1% | 11.8 | 1.80 |
| Nasdaq (Growth) | 0.8% | 10.7% | 11.5% | 8.1% | 5.9% | 12.3 | 1.77 |
| Safe Midstream | 5.3% | 6.0% | 11.3% | 7.9% | 5.7% | 12.6 | 1.75 |
| Dividend Aristocrats | 2.2% | 8.9% | 11.1% | 7.8% | 5.6% | 12.9 | 1.72 |
| REITs + Growth | 1.8% | 8.9% | 10.6% | 7.4% | 5.2% | 13.7 | 1.67 |
| S&P 500 | 1.4% | 8.5% | 9.9% | 7.0% | 4.8% | 15.1 | 1.59 |
| Dividend Growth | 1.6% | 8.0% | 9.6% | 6.7% | 4.5% | 15.9 | 1.56 |
| REITs | 2.9% | 6.5% | 9.4% | 6.6% | 4.4% | 16.4 | 1.54 |
| AT&T | 4.6% | 3.2% | 7.8% | 5.5% | 3.3% | 22.0 | 1.38 |
| 60/40 Retirement Portfolio | 2.1% | 5.1% | 7.2% | 5.1% | 2.9% | 24.9 | 1.33 |
| 10-Year US Treasury | 2.4% | 0.0% | 2.4% | 1.7% | -0.5% | -144.0 | 0.95 |
(Source: Morningstar, FactSet, Ycharts)
The only thing analysts think AT&T can outperform in the future is a 60/40 portfolio and risk-free US treasury bonds.
What does this actually mean for income investors in the coming decades?
AT&T Vs Aristocrats And S&P 500 Inflation-Adjusted Consensus Forecast: $1,000 Initial Investment
| Time Frame (Years) | 7.7% CAGR Inflation-Adjusted S&P Consensus | 9.0% Inflation-Adjusted Aristocrat Consensus | 5.6% CAGR Inflation-Adjusted AT&T Consensus | Difference Between Inflation Adjusted EPD Consensus And S&P 500 |
| 5 | $1,449.03 | $1,540.04 | $1,314.41 | -$134.62 |
| 10 | $2,099.70 | $2,371.71 | $1,727.67 | -$372.03 |
| 15 | $3,042.53 | $3,652.52 | $2,270.87 | -$771.66 |
| 20 | $4,408.74 | $5,625.01 | $2,984.86 | -$1,423.88 |
| 25 | $6,388.41 | $8,662.72 | $3,923.32 | -$2,465.08 |
| 30 | $9,257.02 | $13,340.91 | $5,156.85 | -$4,100.16 |
(Source: DK Research Terminal, FactSet)
| Time Frame (Years) | Ratio Aristocrats/S&P | Ratio Inflation-Adjusted AT&T Consensus Vs S&P 500 |
| 5 | 1.06 | 0.91 |
| 10 | 1.13 | 0.82 |
| 15 | 1.20 | 0.75 |
| 20 | 1.28 | 0.68 |
| 25 | 1.36 | 0.61 |
| 30 | 1.44 | 0.56 |
(Source: DK Research Terminal, FactSet)
You’re not likely to lose money buying AT&T today…assuming you own it long enough.
But if you hope to achieve a comfortable or even rich retirement? Then forget AT&T and take a look at these rich retirement blue-chips instead.
7 Higher-Yielding Blue-Chips To Buy Instead Of AT&T
(Source: DK Research Terminal)
Why should you consider these blue-chips instead of AT&T?
Far Higher Quality
| Company | Quality Rating (out Of 13) | Quality Score (Out Of 100) | Dividend/Balance Sheet Safety Rating (out of 5) | Safety Score (Out Of 100) | Dependability Rating (Out Of 5) | Dependability Score (out Of 100) |
| Verizon | 12 | 83% | 5 | 86% | 4 | 80% |
| Magellan Midstream Partners (uses K-1) | 13 | 85% | 5 | 86% | 5 | 83% |
| BASF SE | 10 | 76% | 4 | 74% | 4 | 75% |
| Altria | 13 | 88% | 5 | 91% | 5 | 83% |
| Allianz SE | 12 | 96% | 5 | 97% | 5 | 100% |
| Main Street Capital | 10 | 69% | 4 | 64% | 4 | 79% |
| Realty Income | 13 | 85% | 5 | 89% | 5 | 83% |
| Average | 11.9 Super SWAN | 83.1% | 4.7 Very Safe | 83.9% | 4.6 Exceptional | 83.3% |
(Source: DK Research Terminal)
For context the average dividend aristocrat has 85% 11.7/13 Super SWAn quality.
These higher-yielding Super SWANs have some of the safest dividends on earth. How safe?
| Rating | Dividend Kings Safety Score (151 Point Safety Model) | Approximate Dividend Cut Risk (Average Recession) |
Approximate Dividend Cut Risk In Pandemic Level Recession |
| 1 – unsafe | 0% to 20% | over 4% | 16+% |
| 2- below average | 21% to 40% | over 2% | 8% to 16% |
| 3 – average | 41% to 60% | 2% | 4% to 8% |
| 4 – safe | 61% to 80% | 1% | 2% to 4% |
| 5- very safe | 81% to 100% | 0.5% | 1% to 2% |
| 7 High-Yield Super SWANs | 84% | 0.5% | 1.9% |
| Risk Rating | Medium Risk (47th industry percentile risk-management consensus) | BBB+ stable outlook credit rating 4.6% 30-year bankruptcy risk |
15% OR LESS Max Risk Cap Recommendation (Each) |
(Source: DK Research Terminal)
In a historically average recession since WWII, the risk of a dividend cut is about 1 in 200.
Even in a Pandemic or Great Recession level downturn, it’s about 1 in 50.
| Company | Payout Ratio | Industry Safe Payout Ratio Guideline | Debt/Capital | Industry Safe Debt/Capital Guideline |
| Verizon | 57% | 70% | 65% | 60% |
| Magellan Midstream Partners (uses K-1) | 78% | 83% | 73% | 60% |
| BASF SE | 86% | 60% | 25% | 40% |
| Altria | 80% | 85% | 101% | 60% |
| Allianz SE | 51% | 50% | 22% | 20% |
| Main Street Capital | 95% | 95% | 45% | 50% |
| Realty Income | 76% | 90% | 38% | 60% |
| Average | 74.7% | 76.1% | 52.7% | 50.00% |
(Source: DK Research Terminal)
That’s courtesy of safe payout ratios and balance sheets that are far safe than they first appear.
Elevated debt/capital is primarily a result of stock buybacks for Altria.
When a company buys back stock above book value it reduces shareholder equity and pushes up debt/capital.
Shares that are repurchased sit on the balance sheet as treasury stock which is primarily used for stock option compensation for employees. It’s treated as a liability. In fact, it’s an asset that can be sold to raise cash.
| Company | Long-Term Risk Management Consensus Industry Percentile | Risk-Rating | Risk-Management Rating | S&P Credit Rating | 30-Year Bankruptcy Risk |
| Verizon | 78% | Low | Good | BBB+ | 5.0% |
| Magellan Midstream Partners (uses K-1) | 69% | Low | Above-Average | BBB+ | 5.0% |
| BASF SE | 70% | Low | Good | A | 0.7% |
| Altria | 69% | Low | Above-Average | BBB | 7.5% |
| Allianz SE | 87% | Low | Very Good | AA | 0.6% |
| Main Street Capital | NA | Medium | NA | BBB- | 11.0% |
| Realty Income | 58% | Medium | Average | A- | 2.5% |
| Average | 71.8% | Low | Good | BBB+ Stable | 4.6% |
(Source: DK Research Terminal)
S&P estimates the average risk of bankruptcy for these companies at 4.6% thanks to their average BBB+ stable credit rating.
- AT&T has a BBB stable rating indicating a 7.5% 30-year bankruptcy risk
Six rating agencies estimate these high-yield blue-chips’ long-term risk management in the top 28% of their industry peers. For context:
- Dividend Champions: 57th percentile – average
- Monthly Dividend Stocks: 60th percentile – above-average
- Hyper-Growth stocks: 61st percentile – above-average
- Master List average: 62nd percentile -above-average
- Dividend Kings: 63rd percentile -above-average
- Dividend Aristocrats: 67th percentile -above-average
- Ultra SWANs: 71st percentile – good
- 7 High-Yield Super SWANs: 72nd percentile – good
- Foreign Dividend Stocks: 75th percentile – good
- Strong ESG Stocks: 78th percentile – good bordering on very good
| Company | Dividend Growth Streak (Years) | ROC (Greenblatt) | ROC Industry Percentile | 13-Year Median ROC |
| Verizon | 15 | 30% | 72% | 27% |
| Magellan Midstream Partners (uses K-1) | 20 | NA | NA | NA |
| BASF SE | 1 | 16% | 66% | 18% |
| Altria | 52 | 712% | 85% | 416% |
| Allianz SE | 2 | NA | NA | NA |
| Main Street Capital | 14 | NA | NA | NA |
| Realty Income | 27 | NA | NA | NA |
| Average | 19 | 253% | 74% | 154% |
(Source: DK Research Terminal)
Ben Graham considered a 20+ year dividend growth streak to be a sign of excellent quality.
Justin Law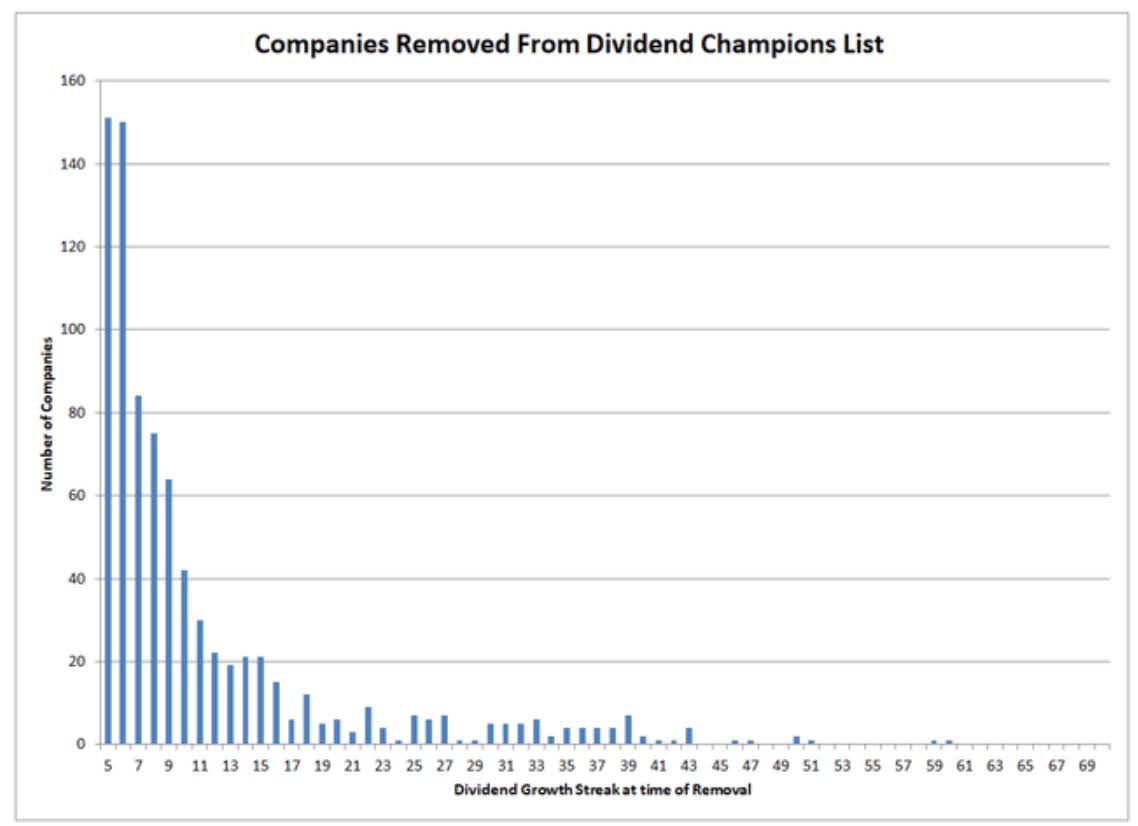
If a company has grown its dividends for 20+ years, there is very little risk that it will cut its dividend or even fail to keep raising it in all economic and industry conditions.
The average dividend growth streak for these blue-chips is 19 years, just one year shy of the Graham standard of excellence.
Return on capital is pre-tax profit/operating capital (the money it takes to run the business).
- Joel Greenblatt’s gold standard proxy for quality and moatiness
The S&P 500’s 2021 ROC was 14.6%.
- on average it takes the typical S&P company about 7 years to recoup investments they make
The average return on capital for these Super SWANs is 253%.
- average investment recouped in 5 months
- 17X higher quality than the average S&P 500 company according to one of the greatest investors in history
These Super SWAN’s ROC is in the top 26% of their industries, just shy of wide-moat status (75th percentile or better).
ROC is 100% higher than their 13-year median, confirming a stable or improving moat.
Ok, so we can see that these are some of the world’s best companies.
And here’s why you might want to buy them today.
Wonderful Companies At Wonderful Prices
For context, here’s the valuation profile of the S&P 500.
S&P 500 Valuation Profile
| Year | EPS Consensus | YOY Growth | Forward PE | Blended PE | Overvaluation (Forward PE) |
Overvaluation (Blended PE) |
| 2021 | $206.30 | 50.38% | 20.7 | 21.9 | 20% | 25% |
| 2022 | $225.37 | 9.24% | 20.6 | 20.6 | 19% | 17% |
| 2023 | $248.05 | 10.06% | 18.7 | 19.6 | 9% | 11% |
| 2024 | $275.12 | 10.91% | 16.8 | 17.8 | -2% | 1% |
| 12-Month forward EPS | 12-Month Forward PE | Historical Overvaluation | PEG | 25-Year Average PEG | S&P 500 Dividend Yield |
25-Year Average Dividend Yield |
| $227.28 | 20.378 | 20.94% | 2.40 | 3.62 | 1.41% | 2.01% |
(Source: DK S&P 500 Valuation And Total Return Tool)
S&P 500 2027 Consensus Return Potential
| Year | Upside Potential By End of That Year | Consensus CAGR Return Potential By End of That Year | Probability-Weighted Return (Annualized) | Inflation And Risk-Adjusted Expected Returns |
Expected Market Return Vs Historical Inflation-Adjusted Return |
| 2027 | 30.90% | 5.53% | 4.15% | 0.58% | 8.92% |
(Source: DK S&P 500 Valuation And Total Return Tool)
Adjusted for inflation, the risk-expected returns of the S&P 500 are about 0.6% for the next five years.
- 1/11th of the S&P’s historical inflation-adjusted returns are 6% to 7% CAGR
Now let’s consider the valuation profile of these seven high-yield Super SWANs.
| Company | Discount To Fair Value | PE/EBITDA/FFO 2021 | Earnings Yield 2021 | 12-Month Consensus Total Return Potential | 12-Month Fundamentally Justified Upside Total Return Potential |
| Verizon | 13.0% | 9.4 | 10.6% | 21.6% | 20% |
| Magellan Midstream Partners (uses K-1) | 24.6% | 9.1 | 11.0% | 15.8% | 41% |
| BASF SE | 35.8% | 9.4 | 10.7% | 48.1% | 62% |
| Altria | 17.4% | 10.7 | 9.4% | 10.6% | 28% |
| Allianz SE | 10.1% | 9.7 | 10.3% | 23.0% | 16% |
| Main Street Capital | 1.1% | 14.7 | 6.8% | 10.4% | 7% |
| Realty Income | 2.6% | 17.9 | 5.6% | 25.2% | 21% |
| Average | 15% Strong Buy | 11.6 | 9.2% | 22.1% | 28.0% |
(Source: DK Research Terminal)
They are almost the mirror image of the S&P 500, with an average PE of 11.6, and an earnings yield of 9.2%.
- the last time the S&P traded at 11.6X earnings was March 2009
- near the lows of the Great Recession
Is it any wonder that analysts expect these Super SWANs to deliver 22% total returns in just the next year?
S&P 500 12-Month Total Return Consensus
| 12-Month Forward S&P Bottom-Up Consensus | 5284.16 | Forward PE Forecast (12 Months From Now) |
Forward Overvaluation Forecast (12 Months From Now) |
| 12-Month Consensus Market Return Potential | 14.7% | 20.78 | 23.3% |
| 12-Month Historical Margin-of-Error Consensus Market Return Potential | 13.1% | Historical Margin Of Error | 1.60% |
(Source: DK S&P 500 Valuation And Total Return Tool)
Analysts are extremely bullish about the market, expecting a 15% gain.
That requires the market’s forward PE to rise to 21, and it to become 23% historically overvalued.
- when interest rates are expected to rise to 3.2% on the 10-year treasury yield
- seems rather unlikely to me
In contrast, these Super SWANs growing as expected over the next year and returning to historical fair value would justify a 28% total return.
- making the analyst forecast of 22% 100% justified by fundamentals
But I don’t care about 12-month returns, I’m interested in helping you retire rich over the long-term.
Long-Term Fundamentals That Put AT&T To Shame
| Company | Yield | FactSet Long-Term Consensus Growth Rate | LT Consensus Total Return Potential | LT Risk-Adjusted Expected Return |
| Verizon | 5.0% | 2.9% | 7.9% | 5.5% |
| Magellan Midstream Partners (uses K-1) | 8.4% | 4.1% | 12.5% | 8.8% |
| BASF SE | 6.7% | 11.0% | 17.7% | 12.4% |
| Altria | 7.0% | 5.3% | 12.3% | 8.6% |
| Allianz SE | 4.8% | 6.0% | 10.8% | 7.6% |
| Main Street Capital | 6.1% | 8.0% | 14.1% | 9.9% |
| Realty Income | 4.2% | 5.2% | 9.4% | 6.6% |
| Average | 6.0% | 6.1% | 12.1% | 8.5% |
(Source: DK Research Terminal)
Every single one of these high-yield blue-chips is expected to deliver superior returns over time compared to AT&T’s 7.8%.
- they yield 6.0% compared to AT&T’s 4.6%
- junk bonds yield 4.2% with 37% bankruptcy risk (“B” average credit rating)
- 43% higher yield with 8X less fundamental risk than junk bonds
- 30% higher yield with 39% less fundamental risk than AT&T
| Investment Strategy | Yield | LT Consensus Growth | LT Consensus Total Return Potential | Long-Term Risk-Adjusted Expected Return | Long-Term Inflation And Risk-Adjusted Expected Returns | Years To Double Your Inflation & Risk-Adjusted Wealth |
10 Year Inflation And Risk-Adjusted Return |
| 7 High-Yield Super SWANs | 6.0% | 6.10% | 12.1% | 8.5% | 6.3% | 11.4 | 1.84 |
| Safe Midstream | 5.3% | 6.0% | 11.3% | 7.9% | 5.7% | 12.6 | 1.75 |
| AT&T | 4.6% | 3.2% | 7.8% | 5.5% | 3.3% | 22.0 | 1.38 |
| Safe Midstream + Growth | 3.3% | 8.5% | 11.8% | 8.3% | 6.1% | 11.8 | 1.80 |
| REITs | 2.9% | 6.5% | 9.4% | 6.6% | 4.4% | 16.4 | 1.54 |
| High-Yield | 2.8% | 11.3% | 14.1% | 9.9% | 7.7% | 9.4 | 2.10 |
| Europe | 2.6% | 12.8% | 15.4% | 10.7% | 8.6% | 8.4 | 2.27 |
| 10-Year US Treasury | 2.4% | 0.0% | 2.4% | 1.7% | -0.5% | -144.0 | 0.95 |
| Dividend Aristocrats | 2.2% | 8.9% | 11.1% | 7.8% | 5.6% | 12.9 | 1.72 |
| 60/40 Retirement Portfolio | 2.1% | 5.1% | 7.2% | 5.1% | 2.9% | 24.9 | 1.33 |
| Value | 2.1% | 12.1% | 14.1% | 9.9% | 7.7% | 9.3 | 2.10 |
| REITs + Growth | 1.8% | 8.9% | 10.6% | 7.4% | 5.2% | 13.7 | 1.67 |
| High-Yield + Growth | 1.7% | 11.0% | 12.7% | 8.9% | 6.7% | 10.8 | 1.91 |
| Dividend Growth | 1.6% | 8.0% | 9.6% | 6.7% | 4.5% | 15.9 | 1.56 |
| S&P 500 | 1.4% | 8.5% | 9.9% | 7.0% | 4.8% | 15.1 | 1.59 |
| Nasdaq (Growth) | 0.8% | 10.7% | 11.5% | 8.1% | 5.9% | 12.3 | 1.77 |
(Source: Morningstar, FactSet, Ycharts)
6% very safe yield is exceptional, and on its own is enough to choose these companies over AT&T.
But 12.1% long-term return potential that’s better than the S&P 500, aristocrats, and even the Nasdaq is the clincher.
Inflation-Adjusted Consensus Forecast: $1,000 Initial Investment
| Time Frame (Years) | 7.7% CAGR Inflation-Adjusted S&P Consensus | 9.0% Inflation-Adjusted Aristocrat Consensus | 9.9% CAGR Inflation-Adjusted 7 High-Yield Super SWANs Consensus | Difference Between Inflation Adjusted 7 High-Yield Super SWANs Consensus And S&P 500 |
| 5 | $1,449.03 | $1,540.04 | $1,604.66 | $155.63 |
| 10 | $2,099.70 | $2,371.71 | $2,574.94 | $475.24 |
| 15 | $3,042.53 | $3,652.52 | $4,131.91 | $1,089.37 |
| 20 | $4,408.74 | $5,625.01 | $6,630.32 | $2,221.58 |
| 25 | $6,388.41 | $8,662.72 | $10,639.42 | $4,251.01 |
| 30 | $9,257.02 | $13,340.91 | $17,072.68 | $7,815.66 |
(Source: DK Research Terminal, FactSet)
- 3.5X AT&T’s inflation-adjusted return potential over the next 30 years
- and 30% higher and much safer yield on day one
| Time Frame (Years) | Ratio Aristocrats/S&P | Ratio Inflation-Adjusted 7 High-Yield Super SWANs Consensus Vs S&P 500 |
| 5 | 1.06 | 1.11 |
| 10 | 1.13 | 1.23 |
| 15 | 1.20 | 1.36 |
| 20 | 1.28 | 1.50 |
| 25 | 1.36 | 1.67 |
| 30 | 1.44 | 1.84 |
(Source: DK Research Terminal, FactSet)
AT&T is expected to deliver 50% lower inflation-adjusted long-term returns while these higher-yielding, higher-quality blue-chips could double the market’s returns.
Ok, so this is all great but what proof do we have that these high-yield Super SWANs can actually deliver 12% long-term returns?
Historical Returns Since 2008 (Annual Rebalancing)
“The future doesn’t repeat, but it often rhymes.” – Mark Twain
Past performance is no guarantee of future results, but studies show that blue-chips with relatively stable fundamentals over time offer predictable returns based on yield, growth, and valuation mean reversion.
Bank of America So let’s take a look at how these high-yield Super SWANs have performed over the last 13 years when 90% of total returns were the result of fundamentals, not luck. Portfolio Visualizer Premium
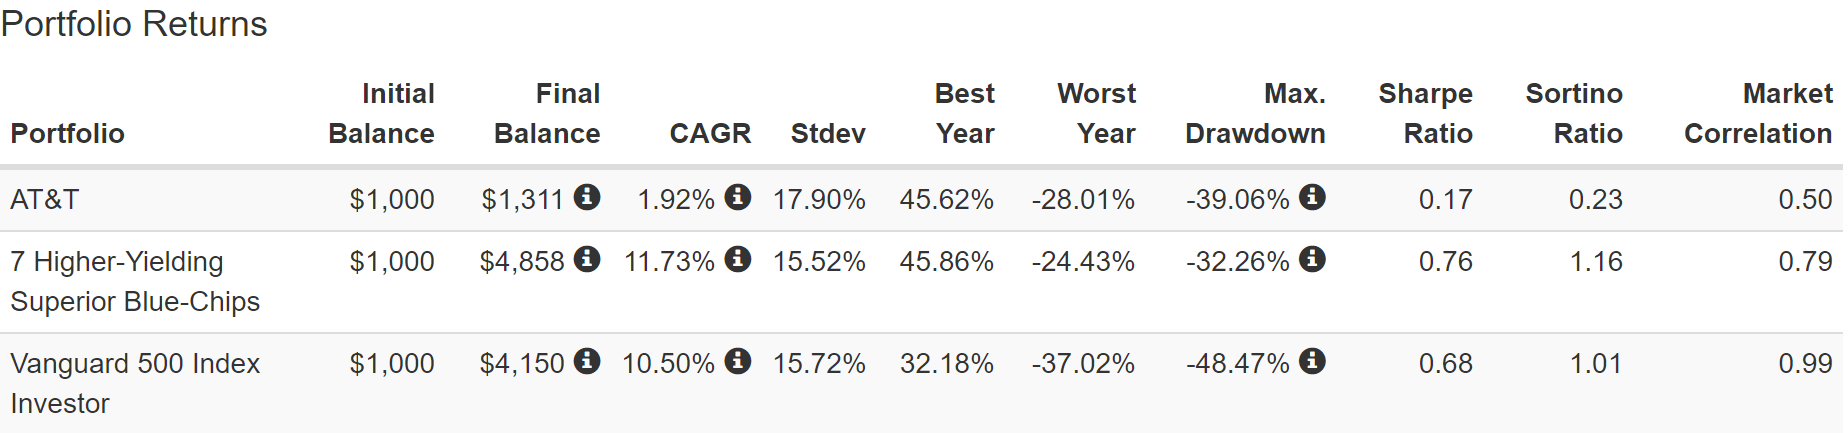
What does this data prove? That there is a 90% statistical probability that these high-yield Super SWANs are better than AT&T.
Portfolio Visualizer Premium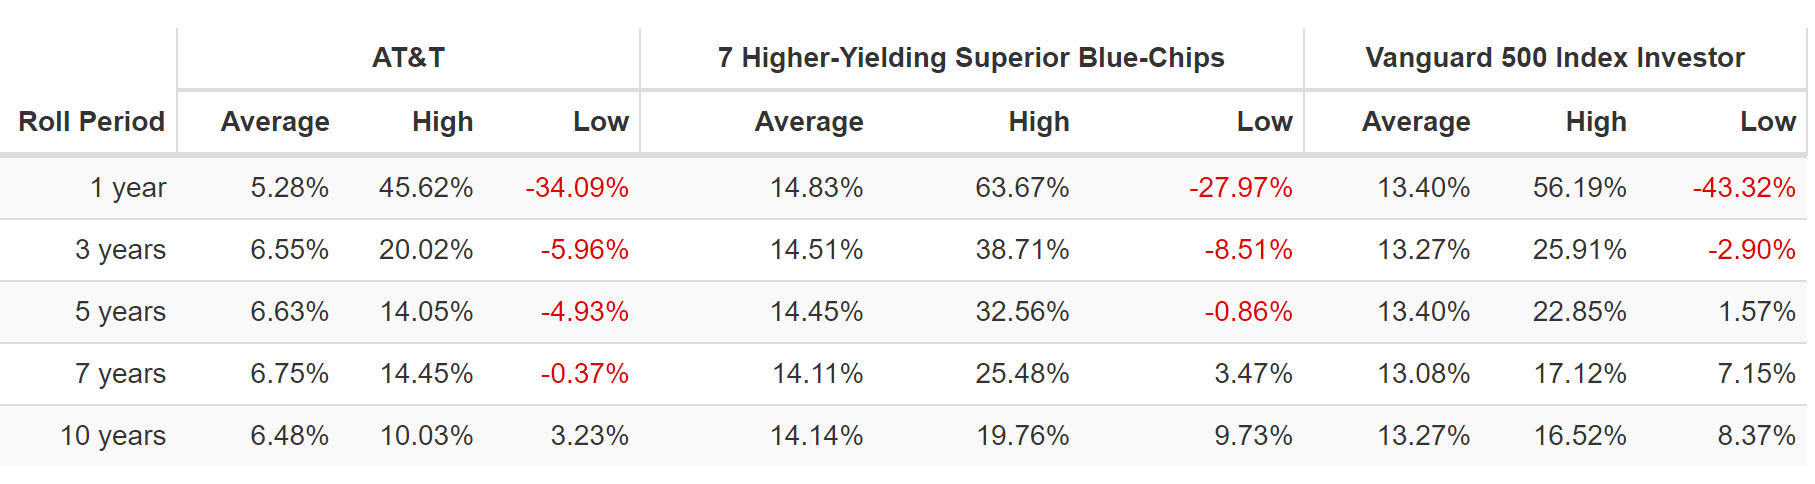
How about more than double AT&T’s rolling returns?
How about 1% higher rolling returns than the S&P 500…during one of the hottest tech bull markets in US history?
Portfolio Visualizer Premium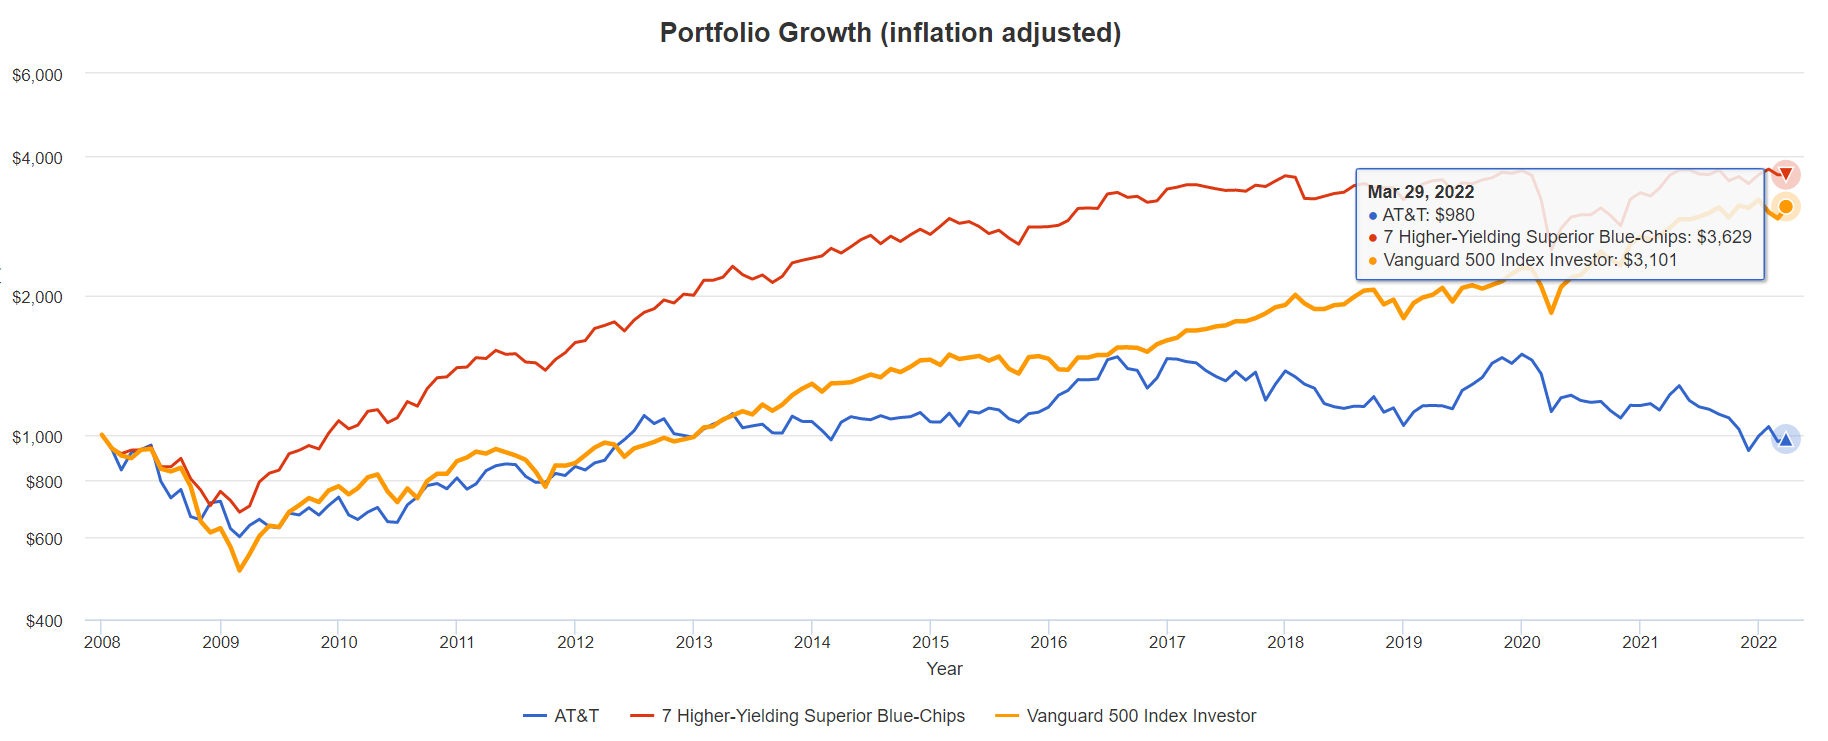
Adjusted for inflation, AT&T investors over the last 13 years have lost 2%.
Meanwhile, investors in these seven higher-yielding, higher-quality blue-chips have earned 263% inflation-adjusted returns, 17% more than S&P 500 investors.
And don’t forget about dividends, the entire reason anyone owns AT&T in the first place.
Far Superior Dividend Income And Growth
| Portfolio | 2008 Income Per $1,000 Investment | 2021 Income Per $1,000 Investment | Annual Income Growth | Starting Yield | 2021 Yield On Cost |
| AT&T | $39 | $112 | 8.45% | 3.9% | 11.2% |
| 7 High-Yield Super SWANs | $67 | $283 | 12.76% | 6.7% | 28.3% |
(Source: Portfolio Visualizer Premium)
Including dividend reinvestment, AT&T delivered 8.5% income growth which is decent.
But these Super SWANs delivered 13% annual income growth.
| Analyst Consensus Income Growth Forecast | Risk-Adjusted Expected Income Growth | Risk And Tax-Adjusted Expected Income Growth |
Risk, Inflation, And Tax Adjusted Income Growth Consensus |
| 13.2% | 9.2% | 7.8% | 5.6% |
(Source: DK Research Terminal, FactSet)
In the future analysts expect continued 13% annual income growth.
If we adjust for the risk of these companies not growing as expected, inflation, and taxes, that works out to 5.6%.
- S&P 500’s historical inflation- and tax-adjusted income growth rate is 3%
- These Super SWANs offers almost 2X the S&P’s historical income growth
- FactSet consensus for a 60/40’s inflation and tax-adjusted income growth rate is 0.5%
- These Super SWANs offer 12X the 60/40’s consensus income growth potential
Bottom Line: Why Buy Trash When High-Yield Treasure Is On Sale?
(Source: Dividend Kings Automated Investment Decision Tool)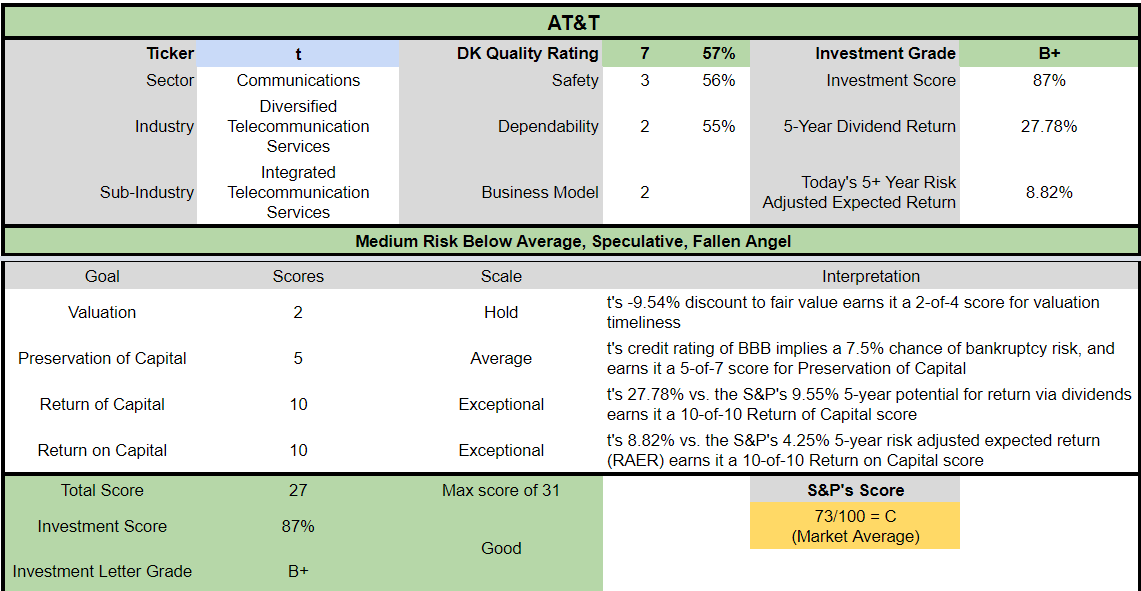
Don’t get me wrong, I’m not saying that AT&T is going to zero, or that it’s even a terrible investment right now.
Compared to the S&P 500 it’s actually a potentially good one, offering just over 2X the market’s risk-adjusted expected returns, and nearly 3X the expected income over 5 years.
But why use any hard-earned savings on a company whose safety, income dependability, and management quality leave so much to be desired?
Especially when you can buy VZ, MMP, BASF, MO, ALIZY, MAIN, and O and get fundamentals like these.
- very safe 6.0% yield (30% more than AT&T)
- Super SWAN quality equal to the aristocrats
- 6.1% growth potential (2X that of AT&T)
- 11.6X earnings, 15% discount to fair value, potentially strong buy
- 12.1% CAGR long-term return potential vs 11.7% CAGR historical returns since 2008
- compared to just 7.8% CAGR long-term return potential for AT&T
- 3.5X the inflation-adjusted consensus long-term wealth that AT&T can generate
And let’s not forget that seven dividends from seven Super SWAN cash flow sources are always safer than income from a single source.
And if owning a 100% stock portfolio is more than you’re comfortable with? Guess what?
With just four low-cost ETFs you can turn high-yield blue-chips into a Zen Ultra SWAN retirement portfolio that can potentially help the typical retired couple
- generate an extra $1.6 million in inflation-adjusted retirement income over 30 years compared to a 60/40 retirement portfolio
- deliver $4 million more inflation-adjusted wealth over 30 years than a 60/40 retirement portfolio
- turn $555,000 in median retirement savings into $6.3 million inflation-adjusted wealth after 30 years more than a 60/40 retirement portfolio
AT&T was a retirement staple for millions for nearly 40 years. It was a dividend aristocrat that investors could rely on no matter what the economy or stock market did.
That is no longer the case. AT&T is a failed aristocrat, and an objectively low-quality company, with limited growth prospects, poor management, and a dividend culture that is no longer dependable.
You deserve better than what AT&T can offer today.
You deserve high-yield Super SWANs that can help you enjoy some of the safest 6% yield on earth, and return potential that can help you retire in safety and splendor.
A careful analysis of both AT&T and these seven Super SWANs makes one thing abundantly clear.
AT&T Is A Value Trap So Buy These 7 Higher-Yielding Super SWANs Instead
Be the first to comment