

kaisersosa67
Dividend champions are companies that have raised their dividend for 25 consecutive years. At present, 143 companies meet this criterion. Achieving this feat is challenging because it requires a company to keep growing through various economic and competitive environments.
These companies are coveted by dividend growth investors for the expected safety of the dividend. However, many companies with very long dividend growth streaks will have slower dividend growth than younger companies. Often this occurs because these companies have run out of room to expand the payout ratio any further, so dividend growth can only match earnings growth.
This is an important consideration with any dividend growth stock. Is the company growing the dividend out of earnings or by expanding the payout ratio? Companies expanding the payout ratio will eventually need to slow the dividend growth rate to match earnings growth.
Companies that have long dividend growth histories, higher yields, and fast-growing dividends are hard to find. Dividend champions with fast growing dividends often have miniscule dividends, due to their high quality. With the current bear market, opportunities may exist to get into these companies at exceptionally high yields.
Below I have selected an additional six companies to the five shown in Part 1, 5 Dividend Champions with High Yields and High Growth, that offer decent yields today and are still growing the dividends at a relatively high rate. I review their outlooks for continued dividend growth and do a quick review of their current valuations. This article is intended to be a jumping off point for further research, not a detailed analysis.
Target Corporation (TGT)
With 55 years of dividend growth, Target has the second longest-running dividend streak amongst retailers. The longest is Lowe’s (LOW) at 60 years. Even with such a long streak, Target still manages to raise the dividend at a healthy clip. The 10-year growth rate stands at 11.1%, and although the 5-year is slower at 6.4%, the last two raises have been 17 and 20%.
Target’s payout ratios had been creeping up steadily for years, peaking at over 50% in 2018 before coming down in the pandemic years of 2021 and 2022. However, as analysts expect a massive earnings cut over the next year, the ratio should be expected to increase significantly.
Given Target’s long history of increasing the dividend, I have no concerns about the company’s ability to raise the distribution in the future. Although the next few years may see leaner increases, the long-range forecasts stand near or above double-digit growth, which translates to similar dividend growth.
When the price of Target cratered on an ugly earnings report in May, I took a closer look at the company’s valuation. The table below shows the dividend yields of Target over the last ten years. You can see that the current yield of under 3% isn’t particularly special over that time span.
Seeking Alpha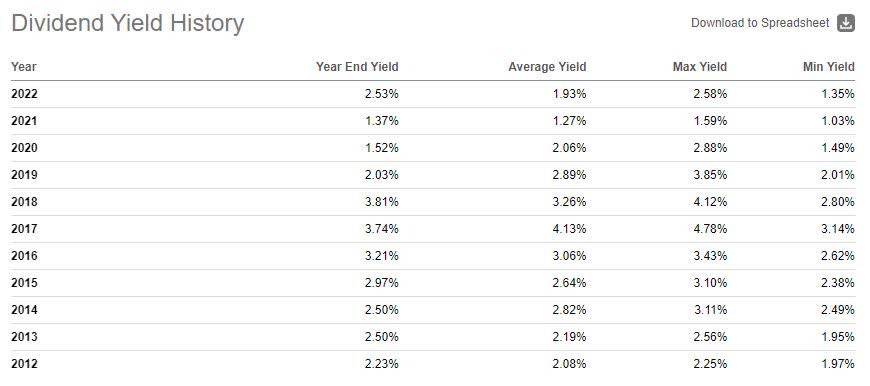
However, when we take a longer-term view of the yields, 3% looks much better. In fact, during the GFC, the yield never reached 2.5%. In the history shown in the graph below, 3% looks like a decent buy over the long term.
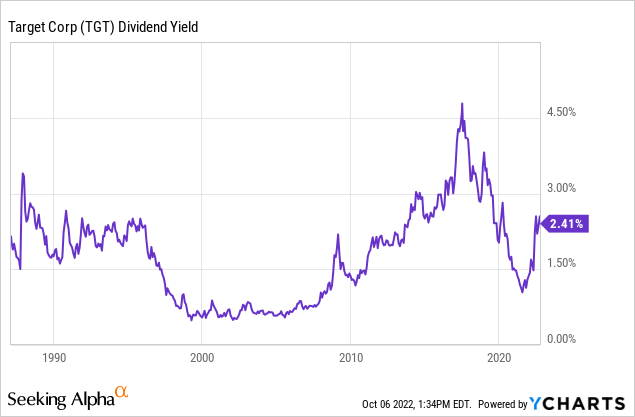
On a PE basis, the current PE of 15 is below the long-term historical average of about 17. This is shown in the Fastgraph below. However, as earnings estimates are falling, it is doubtful as to their accuracy. In such a situation, I am more inclined to trust a historical dividend yield valuation, how much room there is to absorb a shock in the cash flow payout ratios, and the company’s overall quality.
fastgraphs.com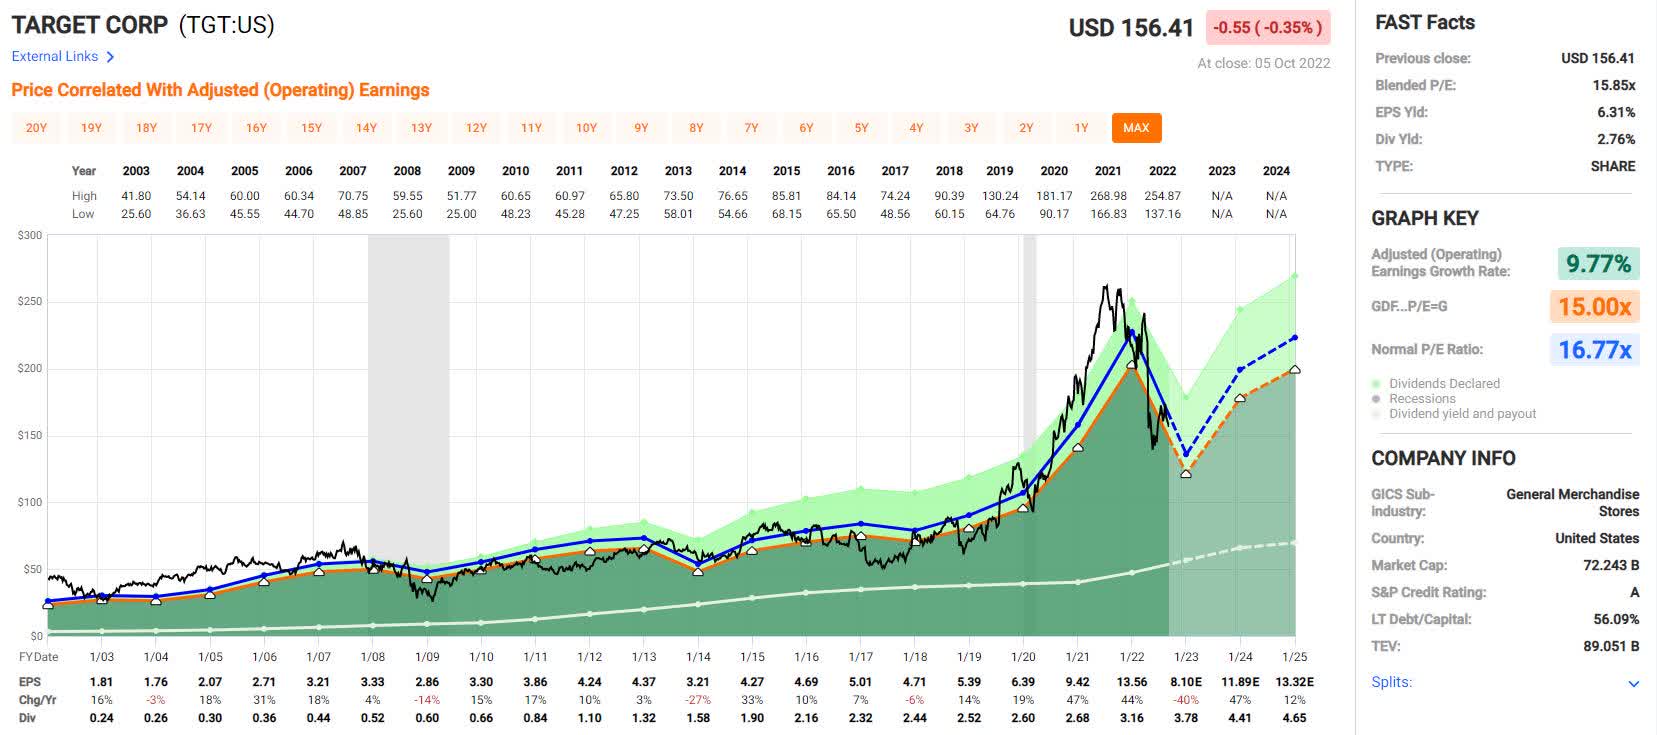
Illinois Tool Works (ITW)
There are 28 Industrial companies on the dividend champions list, second only to financials. Illinois Tool Works is one of 14 industrial companies with streaks of over 45 years. The company is still providing healthy increases after all this time.
ITW has a 10-year dividend growth rate of 13% and a 5-year growth rate of 15%, although the last two have been smaller at around 7%. While the dividend growth looks fantastic, the payout ratios tell a different story.
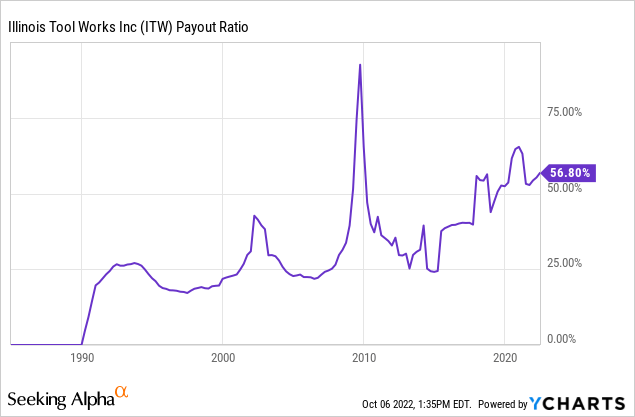
The chart below shows a clear trend in the adjusted earnings payout ratio for ITW, and it’s not going in the right direction. A decade ago, the company paid out in the mid-30% range. Today it stands in the mid-50% range. This is undoubtedly still a manageable ratio; however, it is unlikely the company will be able to expand the payout ratio much further.
Wyo Investments w/data from fastgraphs.com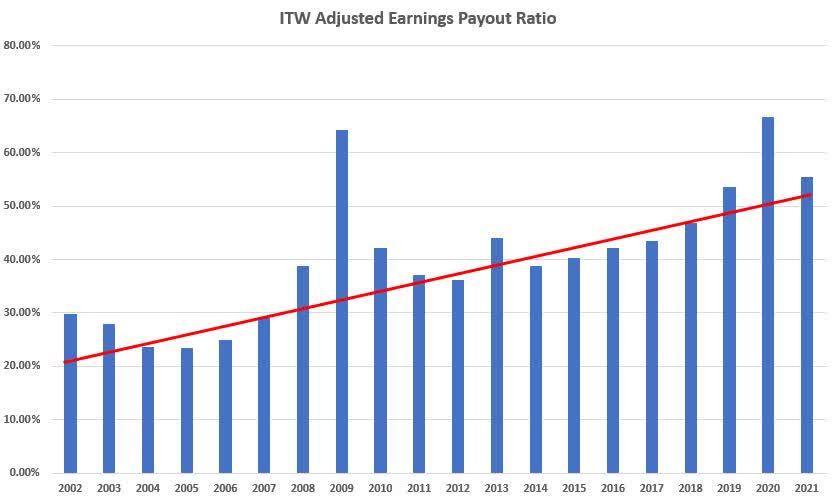
There is one other thing of note with the payout ratio. During the GFC, the payout ratio of ITW nearly doubled. At the time, this took it over the 60% range. If a similar situation were to occur today, it would be over 100%, placing the dividend well in the danger zone. This is shown in the chart below. (Note this is not based on adjusted earnings.) While it is likely they could manage this in a short recession; a prolonged one may be a different story.
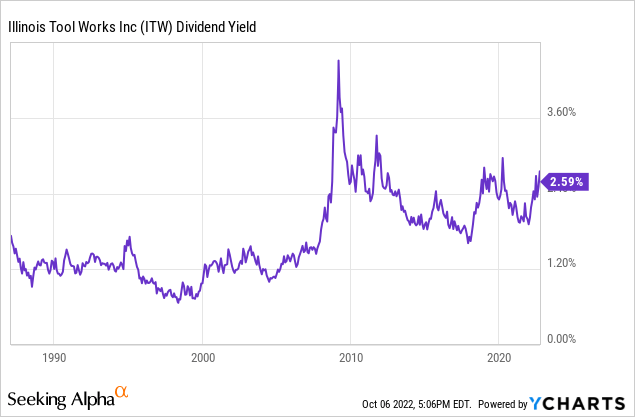
Most industrials have held up reasonably well this year. Of course, they entered the year well overvalued and have further to fall to reach bargain territory. The current yield of 2.8% has been matched regularly since 2018, although it was an unusually high yield before 2018. It topped 3.5% during the flash crash and hit 4.5% during the GFC. This is shown in the chart below.
ITW has commanded an above-average PE for the last twenty years, as can be seen in the fastgraph below. The current PE of just below 21 stands in line with its historical average. During the GFC, the PE fell into the single digits and stayed below and near 15 for several years. Illinois Tool Works has a long way to fall in a recession.
fastgraphs.com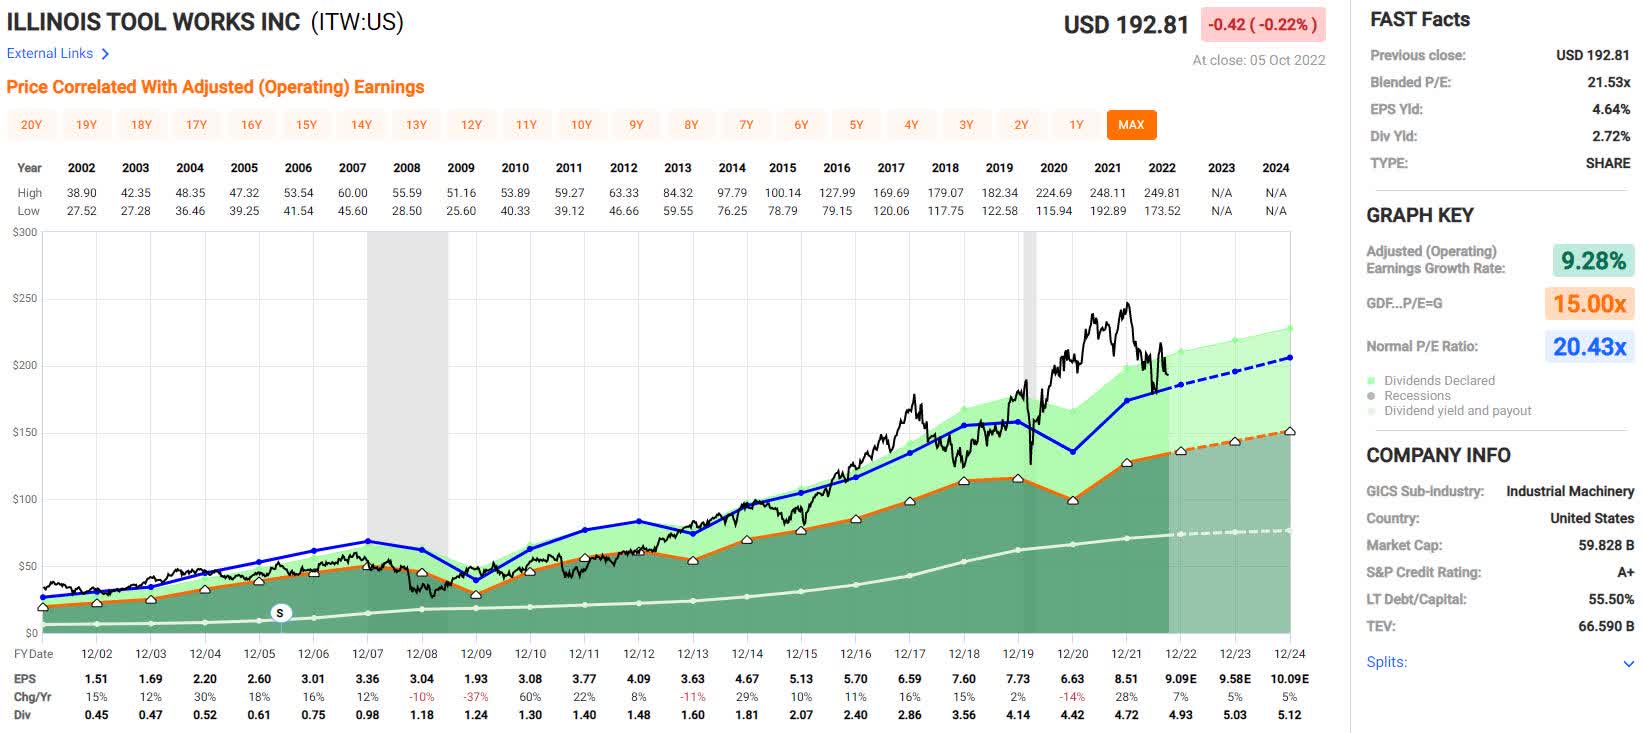
Caterpillar Inc. (CAT)
As a highly cyclical company, Caterpillar is an unusual company to find on the champions list. It takes a lot of discipline from a highly cyclical company to manage the cash flow well enough to continue to increase the dividends through a down cycle, but CAT has been doing just that for 29 years.
The dividend growth tends to move with the cycles, with some very great years followed by very lean years. Caterpillar has a 10-year dividend growth rate of 9% and a 5-year growth rate of just under 7%. However, the 3-year jumps back to 9%, with the most recent increase at 8%. It’s common for some increases to be sub-5%.
The Fastraph below shows the highly cyclical nature of the business. A long-term dividend growth investor wants to avoid buying at the top of the cycle. An investor wishing to initiate a position in CAT may wait several years for the right buying opportunity.
fastgraphs.com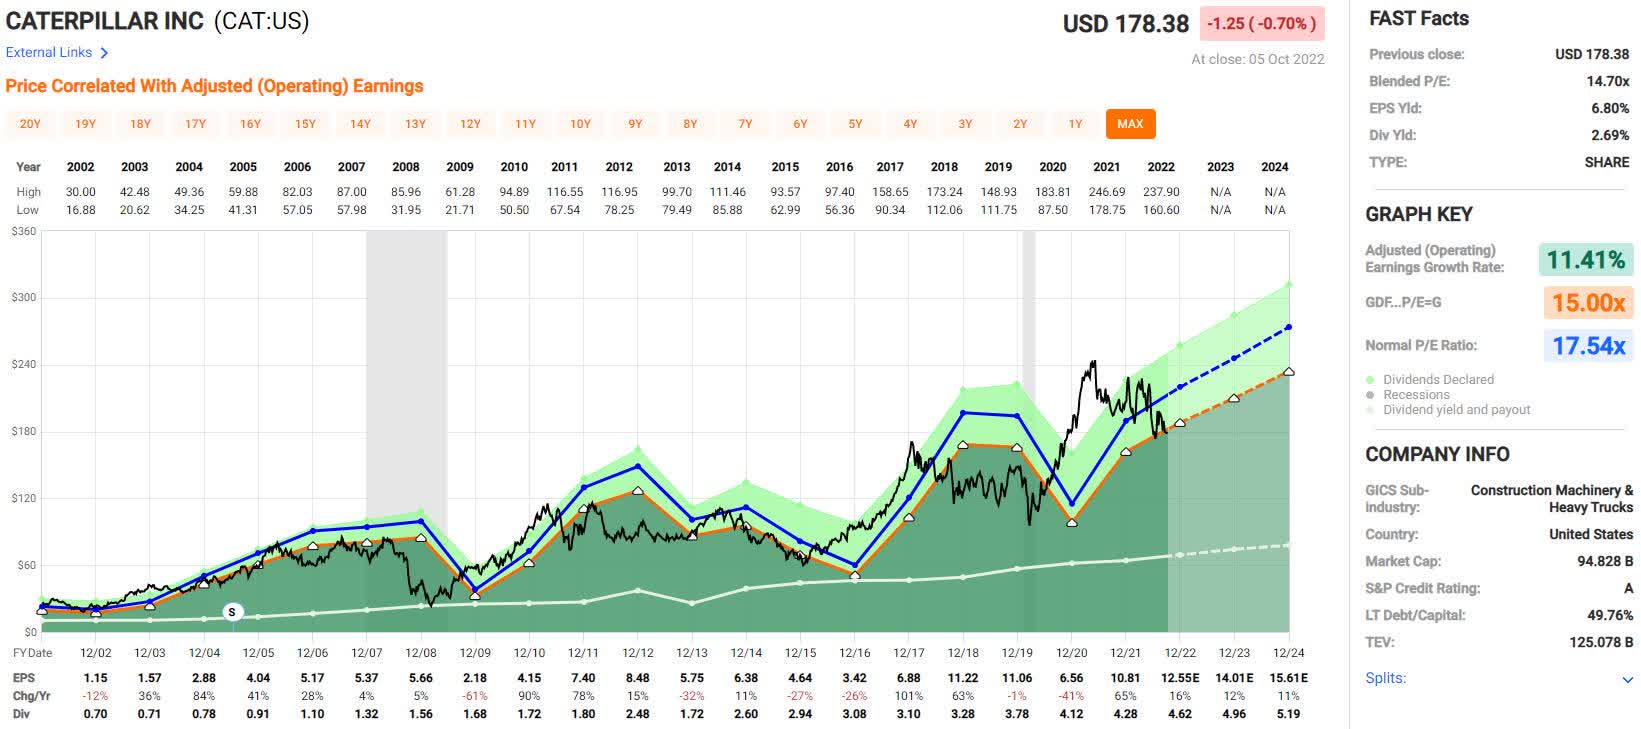
Payout ratios fluctuate wildly with the earnings peaks and valleys and can range from mid-20% to 90%. However, the cash flow payout ratios smooth some of this, with the operating cash flow payout ratio maintaining steady in the mid-30 % range.
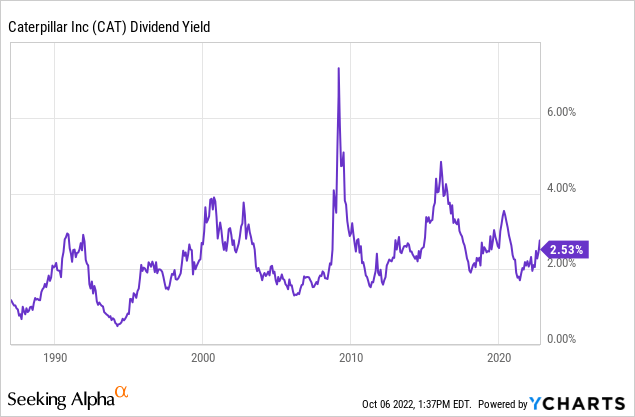
Caterpillar is tricky to value, as earnings forecasts generally don’t reflect the downturns accurately, especially when projecting long-range. I find historical dividend yields more useful when evaluating CAT than historical PE.
The chart below shows the dividend yield of CAT since 1990. The peaks correspond with the bottom of the cycle, as aligned with the Fastgraph shown above. CAT nearly always reaches near a 4% yield. In the present cycle, CAT and most industrials hit abnormally high PE ratios (and corresponding low yields). For this reason, CAT may not reach 4% without a deep recession in the next downturn. It’s worth noting that the yield exceeded 7% during the GFC.
The Gorman-Rupp Company (GRC)
The final industrial company on our list has the longest dividend growth streak at 49 years and will become a dividend king next year. Gorman-Rupp is a relatively tiny company with less than a $1B market cap. As with many industrial companies, GRC is cyclical but not nearly to the degree of Caterpillar. This is shown in the Fastgraph below.
fastgraphs.com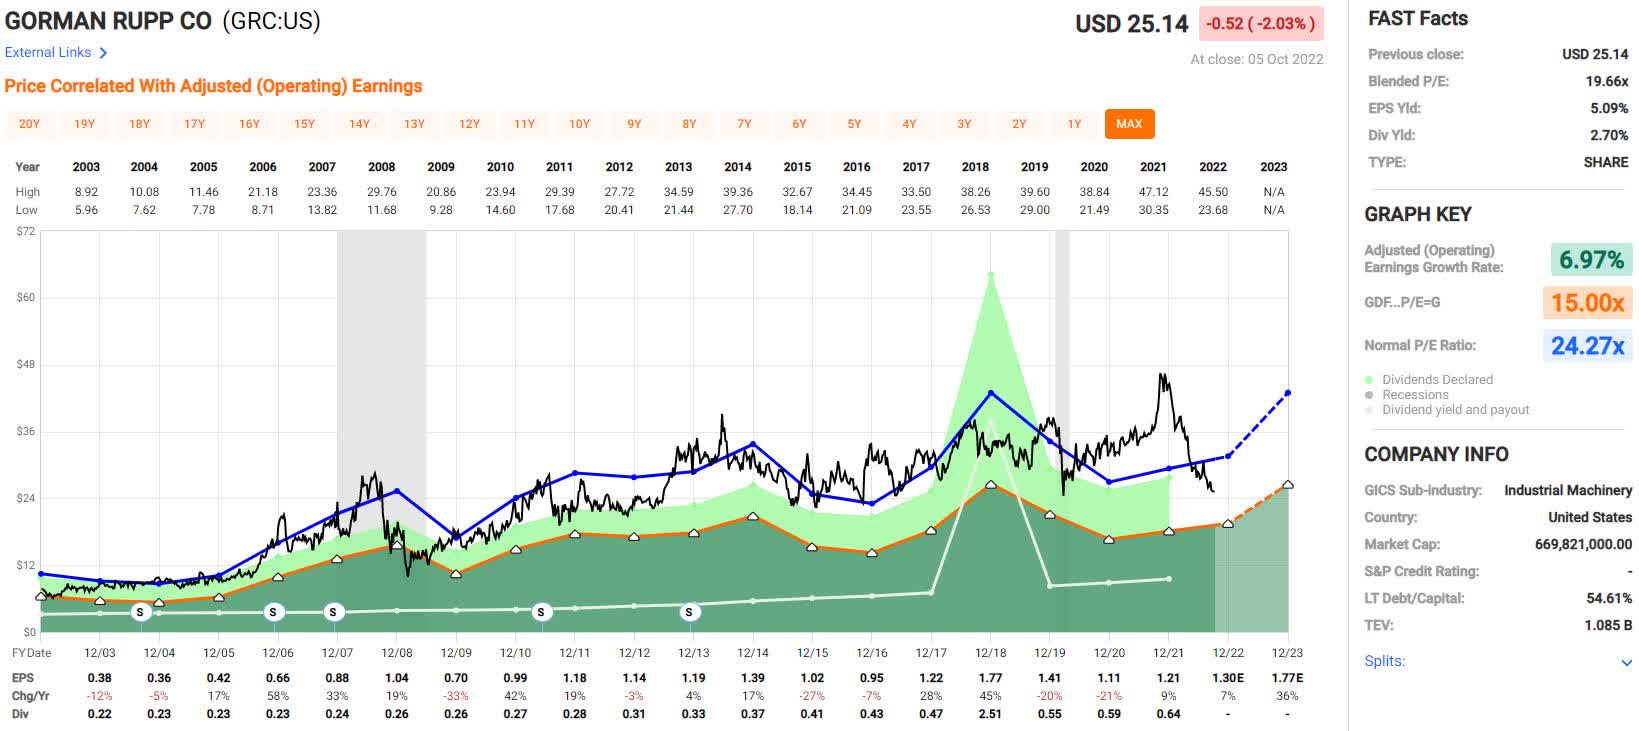
The valuations of GRC are not inspiring. The blue line on the fastgraph shows an average PE of nearly 25 for a company growing at an average of only 7% over the timeframe. The current PE of 20 compares favorably to this average but seems high given the current market environment and compared with the other industrials, CAT and ITW above.
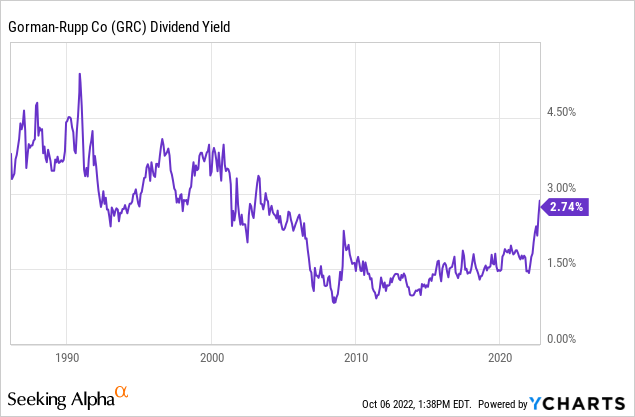
Gorman-Rupp has managed payout ratios in the mid-20% to mid-50% range. Currently, they are at the high end of this range, indicating that they may be near the bottom of a cycle. The dividend yield tends to confirm this, as the company is offering the highest yield since the mid-2000s. However, before the mid-2000s, the company provided much better yields than it does today. This is shown in the chart below.
GRC has 10-year and 5-year dividend growth rates above 8%, and its most recent increase was closer to 10%. These are impressive for a company with a 49-year dividend growth history. While the most recent decade has provided remarkable dividend growth, the prior one was abysmal, with most raises below 5% and several below 2%. Do your research on this one before buying at such a high valuation.
Lowe’s
Lowe’s is the dividend growth stock every company wishes it could be. With 60 years of dividend growth and 3, 5, and 10-year growth rates well over 15%, every DGI investor should want to hold this company. In addition, the most recent raises have been 24% and 31%! All this while maintaining a steady payout ratio in the mid-20 to mid-30% range. So, what’s not to like?
Typically, Lowe’s has a very low yield, generally running well below that of its competitor, Home Depot (HD), which is another fantastic dividend growth company. In fact, as shown in the chart below, Lowe’s has topped a 3% dividend only once in the past 35 years. I considered this the greatest dividend growth deal of the flash crash.
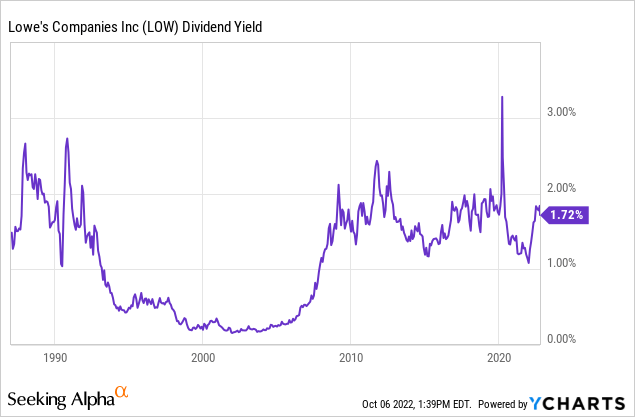
In June, Lowe’s reached a yield of 2.4%, which is still an unusually high starting point, as can be seen on the yield chart above. It has yet to be seen if the best moment to buy for the year has come and gone, but today’s price still offers an above-average starting yield.
Looking at the historical valuations on the Fastgraph below, we can see that Lowe’s commands an average PE of 19.6, well above today’s 15, indicating the company may be a bargain today. During the GFC, the company’s PE ratio fell into the single digits, although it was lower than average entering the recession. Lowe’s is a company worth watching closely in a downturn, as retailers tend to get beaten up more than average. However, given its long history and low payout ratio, the long-term buy-and-hold investor should sleep soundly and expect many more future dividend increases.
fastgraphs.com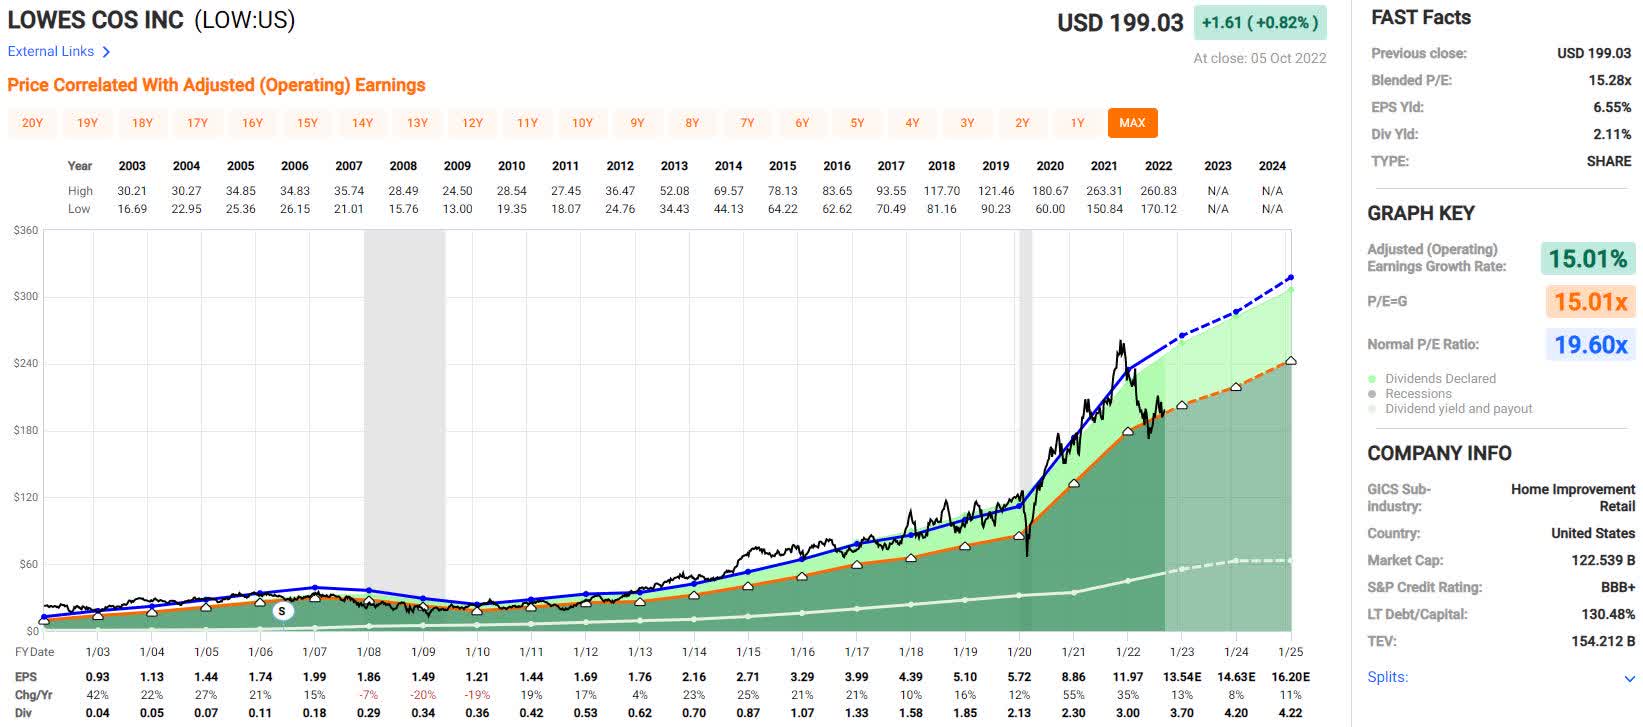
Atmos Energy Corporation (ATO)
Unless we are talking NextEra Energy (NEE), utilities aren’t what generally come to mind when considering high dividend growth. (By the way, NEE almost made this list, but its yield was still too low.) But, Atmos is no slouch to dividend growth, with a 5-year dividend growth rate of 8.4% and its two most recent increases above 8.5%.
Everything points to Atmos maintaining this dividend growth rate into the future. ATO maintains a flat payout ratio of about 50%, which is on the low side for utility companies. Additionally, for what they are worth, long-range forecasts show 8% growth into the foreseeable future.
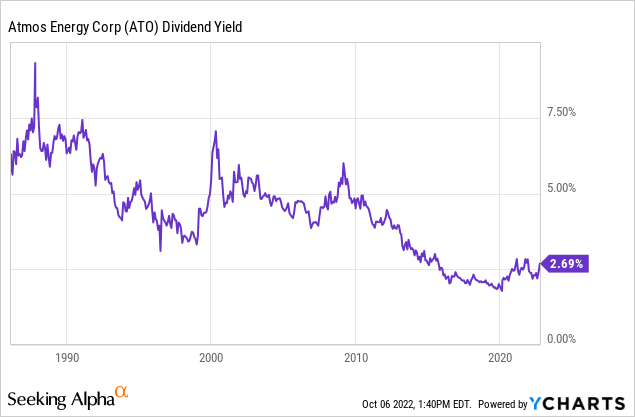
Like industrials, utilities have been overvalued for several years. As tends to happen, overvalued companies going into bear markets stay high relative to other opportunities, and Atmos is no exception. The yield chart below shows just how far yields have fallen, especially since 2016.
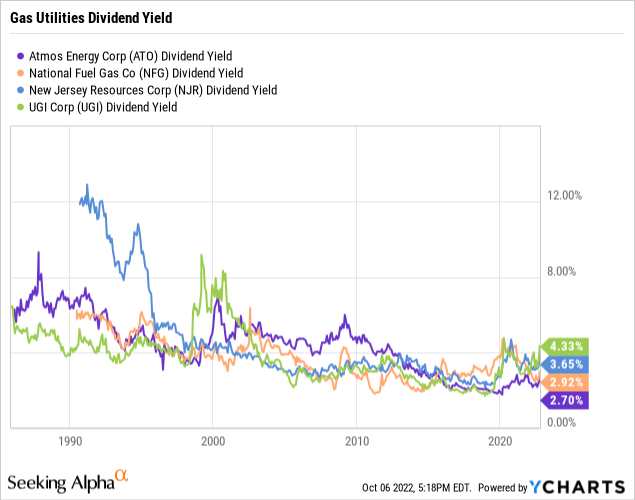
The historical overvaluation isn’t unique to Atmos. The yield chart below adds several competitors. It can be seen that most utilities experienced a significant drop in yield over the past decade.
This same overvaluation can be seen in the Fastgraph below. Notice since 2016, the price (black line) has been significantly above the normal PE ratio line (blue line). Today’s PE of 19 is still well above the average PE of 17.
fastgraphs.com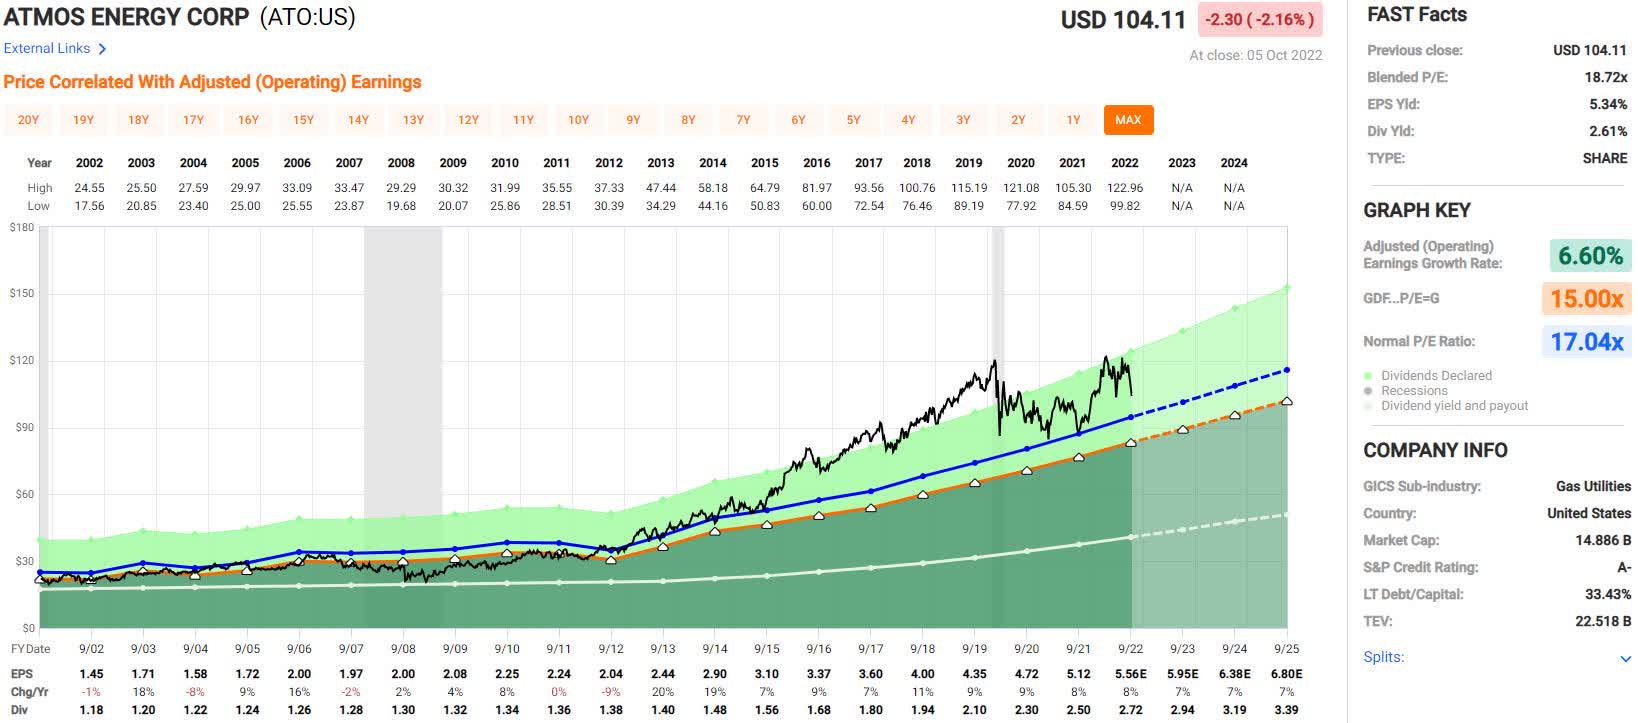
As utilities are not known for fast growth, an investor today should weigh the relative opportunities in the market before jumping into any utility, not just Atmos.
Be the first to comment