

Olivier Le Moal
In this monthly article, we try to identify five closed-end funds (“CEFs”) that have a solid past history, pay high-enough distribution and offer reasonable valuations at the current time.
The outlook for the market has not changed much since last month. It remains as muddy as it was last month. The specter of recession is still on everyone’s mind, even though the most recent upbeat employment numbers created some confusion. If the economy is still generating a lot of new jobs, how could we be in a recession? However, inflation is still rearing its ugly head, and there is not much sign of it going down as yet. As we write this, the CPI (consumer price index) report came out this morning, and the headline number is 9.1%, a 40-year high and even higher than the consensus of 8.8%. Some of the market participants are now expecting a 100 basis point increase in the interest rates during the next Fed meeting.
Obviously, the CEFs have been moving up and down with the broader markets, sometimes with higher volatility due to the leverage. However, not all CEFs are created equal. Some of them have held up quite okay in this downturn, while others have not. Usually, equity-focused funds move in tandem with the markets or their respective sectors. However, there are many funds with underlying asset classes that are known to provide some level of divergence from the market. So, it is of utmost importance that we make our CEF portfolio a diversified one in terms of underlying asset classes. As our own benchmark, as of 07/08/2022, our “8%-CEF-Income” portfolio is down roughly 11% since the beginning of the year, compared to -18% of the S&P 500. Besides, for CEFs, we need to measure the attractiveness of a fund in terms of the income yield as long as that income is reliable and sustainable.
All that said, market uncertainties will always remain with us, but that should not prevent us from acting on our long-term investing goals. It’s best to keep the focus on our long-term goals and strategies that have proven to work in good times and bad. If you are a new investor and/or starting a brand new CEF portfolio, our recommendation would be to start small and build the positions over time. We believe, for most investors (but not all), a 20%-25% allocation to closed-end and high-income funds should be enough. In that spirit, we keep looking for good investment opportunities and try to separate the wheat from the chaff on a regular basis.
Why Invest In CEFs?
For income-focused investors, closed-end funds remain an attractive investment class that offers high income (generally in the range of 6%-10%, often 8% plus), broad diversification (in terms of variety of asset classes), and market-matching total returns in the long term, if selected carefully and acquired at reasonable price points. A $500K CEF portfolio can generate nearly $40,000 a year, compared to a paltry $6,500 from the S&P 500. Now, if you were a retiree and needed to use all of that income, the portfolio probably might not grow as much, but it may still grow enough to beat the rate of inflation. That certainly beats investment vehicles like annuities. However, if you are in a position to withdraw 5% (or under 6%), the rest of the yield can be reinvested in the original fund or a new fund to ensure reasonable growth of the capital. In our view, if managed with some due diligence and care, a CEF portfolio could deliver 10% (or better) long-term total returns.
All that said, it’s important to be aware of the risks and challenges that come with investing in CEFs. We list various risk factors at the end of this article. They are not suitable for everyone, so please consider your goals, income needs, and risk tolerance carefully before you invest in CEFs.
With that in view, one should buy selectively and in small and multiple lots. No one can predict the future direction of the market with any degree of certainty. So, we continue to be on the lookout for good investment candidates that have a solid track record, offer good yields, and are offering great discounts.
Five Best CEFs To Consider Every Month
This series of articles attempts to separate the wheat from the chaff by applying a broad-based screening process to 500 CEF funds followed by an eight-criteria weighting system. In the end, we’re presented with about 30-40 of the most attractive funds in order to select the best five. However, please note that we do not consider funds that have a history of fewer than five years. We use our multi-step filtering process to select just five CEFs from around 500 available funds. For readers who are looking for a wider selection and diversification, we also include a list of top 10 funds.
This is our regular series on CEFs, where we highlight five CEFs that are relatively cheap, offer “excess” discounts to their NAVs, pay reasonably high distributions, and have a solid track record. We also write a monthly series to identify “5 Safe and Cheap DGI” stocks. You can read our most recent article here.
The selected five CEFs this month, as a group, are offering an average distribution rate of 9.60% (as of 07/08/2022). Besides, these five funds have an excellent past record and collectively returned 8.94%, 9.04%, and 10.5% in the last three, five, and ten years. The average leverage is low at about 12.75%, with an average excess discount of -6%. Since this is a monthly series, there may be some selections that could overlap from month to month.
Please note that these are not recommendations to buy but should be considered as a starting point for further research.
Author’s Note: This article is part of our monthly series that tries to discover the five best buys in the CEF arena at that point in time. Certain parts of the introduction, definitions, and the section describing selection criteria/process may have some commonality and repetitiveness with our other articles in the series. This is unavoidable as well as intentional to keep the entire series consistent and easy to follow for new readers. Regular readers who follow the series from month to month could skip the general introduction and sections describing the selection process. Further, a version of this article is made available a few days early to the subscribers of the HIDIY Marketplace service.
Goals For The Selection Process
Our goals are simple and are aligned with most conservative income investors, including retirees who wish to dabble in CEFs. We want to shortlist five closed-end funds that are relatively cheap, offer good discounts to their NAVs, pay relatively high distributions, and have a solid and substantial past track record in maintaining and growing their NAVs. Please note that we are not necessarily going for the cheapest funds (in terms of discounts or highest yields), but we also require our funds to stand out qualitatively. We adopt a systematic approach to filter down the 500-plus funds into a small subset.
Here’s a summary of our primary goals:
- High income/distributions.
- Reasonable long-term performance in terms of total return on NAV: We also try to measure if there has been an excess NAV return over and above the distribution rate.
- Cheaper valuation at the time of buy, determined by the absolute discount to NAV and the “excess” discount offered compared to their history.
- Coverage ratio: We try to measure to what extent the income generated by the fund covers the distribution. Not all CEFs fully cover the distribution, especially the equity, and specialty funds, as they depend on the capital gains to cover their distributions. We adjust this weight according to the type and nature of the fund.
We believe that a well-diversified CEF portfolio should consist of at least 10 CEFs, preferably from different asset classes. It’s also advisable to build the portfolio over a period rather than invest in one lump sum. If you were to invest in one CEF every month in a year, you would have a well-diversified CEF portfolio by the year’s end. What we provide here every month is a list of five probable candidates for further research. We think a CEF portfolio can be an important component in the overall portfolio strategy. One should preferably have a DGI portfolio as the foundation, and the CEF portfolio could be used to boost the income level to the desired level. How much should one allocate to CEFs? Each investor needs to answer this question himself/herself based on the personal situation and factors like the size of the portfolio, income needs, risk appetite, or risk tolerance.
Selection Process
We have more than 500 CEF funds to choose from, which come from different asset classes like equity, preferred stocks, mortgage bonds, government and corporate bonds, energy MLPs, utilities, infrastructure, and municipal income. Just like in other life situations, even though the broader choice always is good, it does make it more difficult to make a final selection. The first thing we want to do is to shorten this list of 500 CEFs to a more manageable subset of around 75-100 funds. We can apply some criteria to shorten our list, but the criteria need to be broad and loose enough at this stage to keep all the potentially good candidates. Also, the criteria that we build should revolve around our original goals. We also demand at least a five-year history for the funds that we consider. However, we do take into account the 10-year history, if available.
Criteria to Shortlist:
|
Criteria |
Brings down the number of funds to… |
Reason for the Criteria |
|
Baseline expense < 2.5% and Avg. Daily Volume > 10,000 |
Approx. 435 Funds |
We do not want funds that charge excessive fees. Also, we want funds that have fair liquidity. |
|
Market-capitalization > 100 Million |
Approx. 400 Funds |
We do not want funds that are too small. |
|
Track record/ History longer than five years (inception date 2016 or earlier) |
Approx. 375 Funds |
We want funds that have a reasonably long track record. |
|
Discount/Premium < +7% |
Approx. 350 Funds |
We do not want to pay too high a premium; in fact, we want bigger discounts. |
|
Distribution (dividend) Rate > 5% |
Approx. 260-290 Funds |
The current distribution (income) to be reasonably high. |
|
5-Year Annualized Return on NAV > 0% AND 3-Year Annualized Return on NAV >0% |
Approx. 220-250 Funds |
We want funds that have a reasonably good past track record in maintaining their NAVs. |
After we applied the above criteria this month, we were left with 242 funds on our list. But it’s too long a list to present here or meaningfully select five funds.
Note: All tables in this article have been created by the author (unless explicitly specified). Most of the data in this article are sourced from Cefconnect.com, Cefa.com, and Morningstar.com.
Narrowing Down To 50-60 Funds
To bring down the number of funds to a more manageable count, we will shortlist ten funds based on each of the following criteria. After that, we will apply certain qualitative criteria to each fund and rank them to select the top five.
At this stage, we also eliminate certain funds that have had substantial negative NAV returns for both three-year and five-year periods.
Seven Broad Criteria:
- Excess discount/premium (explained below).
- Distribution rate.
- Return on NAV, last three years (medium-term).
- Return on NAV, last five years (long term).
- Coverage ratio.
- Excess return over distributions.
- The total weight (calculated up to this point).
Excess Discount/Premium:
We certainly like funds that are offering large discounts (not premiums) to their NAVs. But sometimes, we may consider paying near zero or a small premium if the fund is otherwise great. So, what’s important is to see the “excess discount/premium” and may not be the absolute value. We want to see the discount (or premium) on a relative basis to their record, say 52-week average.
Subtracting the 52-week average discount/premium from the current discount/premium will give us the excess discount/premium. For example, if the fund has the current discount of -5%, but the 52-week average was +1.5% (premium), the excess discount/premium would be -6.5%.
Excess Discount/Premium = Current Discount/Premium (Minus) 52-Wk Avg. Discount/ Premium
So, what’s the difference between the 12-month Z-score and this measurement of Excess Discount/Premium? The two measurements are quite similar, maybe with a subtle difference. The 12-month Z-score would indicate how expensive (or cheap) the CEF is in comparison to the 12 months. Z-score also takes into account the standard deviation of the discount/premium. Our measurement (excess discount/premium) compares the current valuation with the last 12-month average.
We sort our list (of 242 funds) on the “excess discount/premium” in descending order. For this criterion, the lower the value, the better it is. So, we select the top 10 funds (most negative values) from this sorted list.
(All data as of 07/08/2022)
Table 1:
Author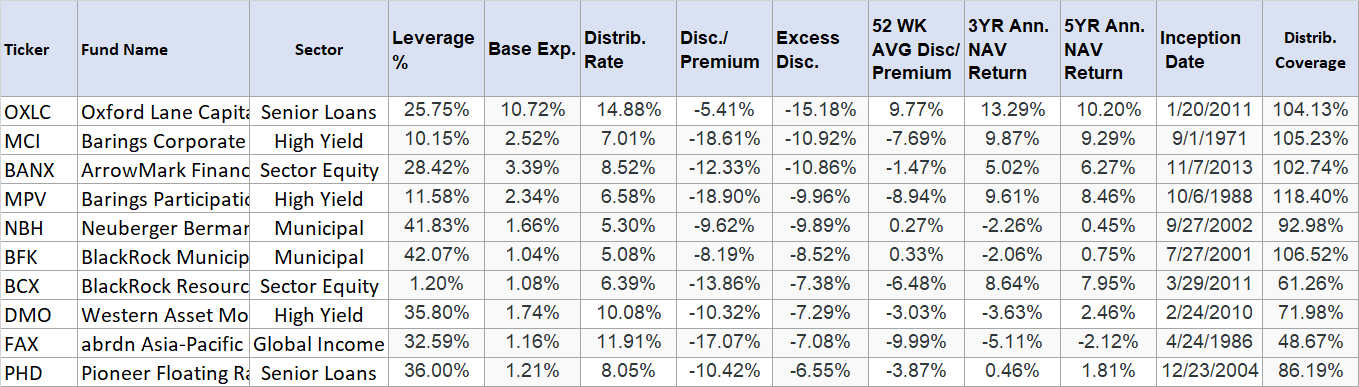
High Current Distribution Rate:
After all, most investors invest in CEF funds for their juicy distributions. We sort our list on the current distribution rate (descending order, highest at the top) and select the top 10 funds from this sorted list.
Table 2:
Author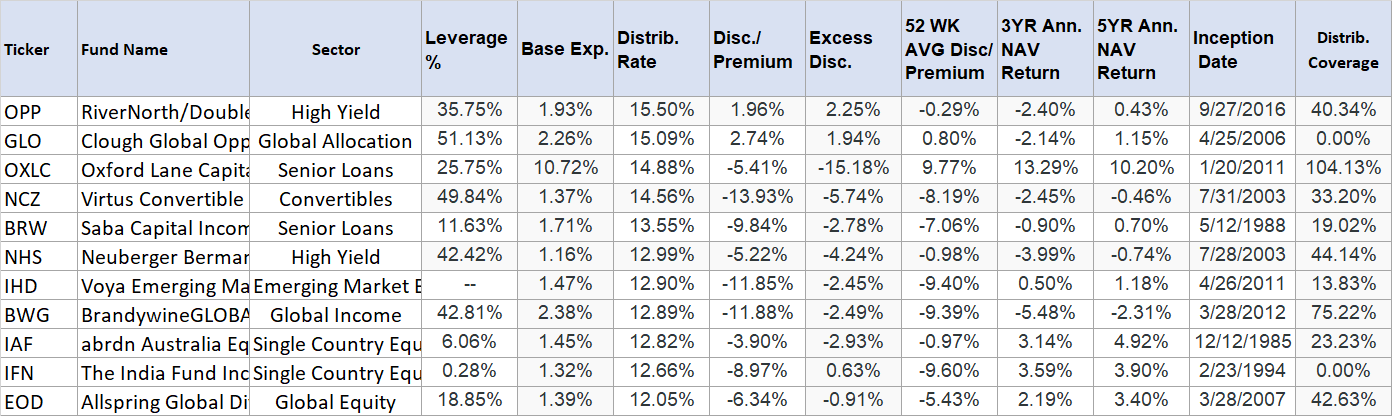
Medium-Term Return on NAV (last three years):
We then sort our list on a three-year return on NAV (in descending order, highest at the top) and select the top 10 funds.
Table 3:
Author
Five-Year Annualized Return on NAV:
We then sort our list on the five-year return on NAV (in descending order, highest at the top) and select the top 10 funds.
Table 4:
Author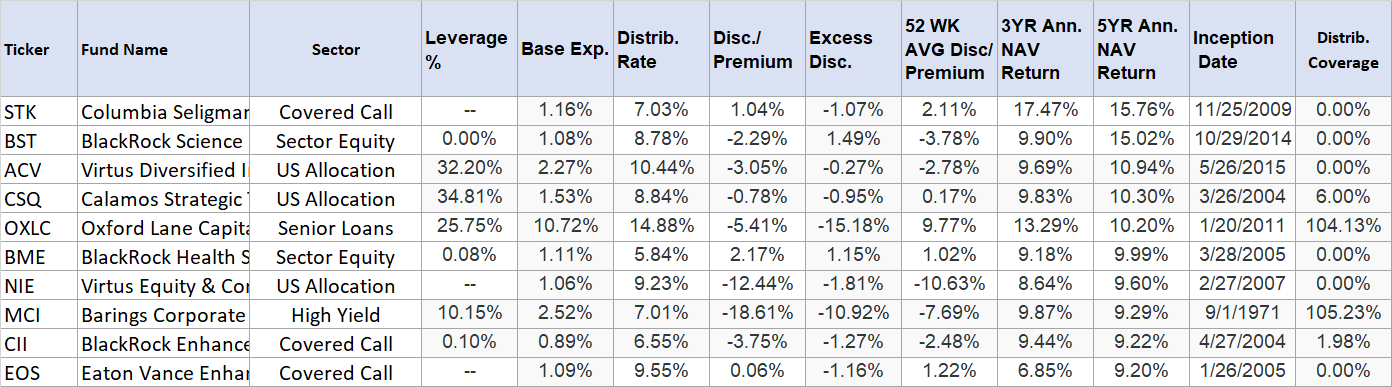
Coverage Ratio (Distributions Vs. Earnings):
We then sort our list on the coverage ratio and select the top 10 funds. The coverage ratio is derived by dividing the earnings per share by the distribution amount for a specific period. Please note that in some cases, the coverage ratio may not be very accurate since the “earnings per share” maybe three to six months old. But in most cases, it’s fairly accurate.
Table 5:
Author
Excess Return Over Distribution:
This is the “excess return” provided by the fund over the distribution rate. It’s calculated by subtracting the distribution rate from the three-year NAV return.
Table 6:
Author
Total Weight (Quality Score) Calculated Up to This Point:
Note: The Total Weight calculation is not fully completed at this point since we have not taken into account the 10-year NAV return. Also, we would adjust the weight for the coverage ratio at a later stage. However, we select the top 15 names on this basis.
Table 7:
Author
Now we have 76 funds in total from the above selections. We also added the top two funds from some of the missing asset classes (in our list of 76), like the “Preferred” and “Real-estate” categories.
We will see if there are any duplicates. In our current list of 81 funds, there were 29 duplicates, meaning there are funds that appeared more than once. The following names appear twice (or more):
Appeared two times:
- ACV, ARDC, BANX, BGX, BME, BST, CII, CSQ, DNIF, FUND, HFRO, NIE, PHD, THQ (14 duplicates)
Appeared three times:
Appeared four times:
Appeared five times:
So, once we remove 29 duplicate rows, we are left with 52 (81-29) funds.
Note: It may be worthwhile to mention here that just because a fund has appeared multiple times does not necessarily make it an attractive candidate. Sometimes, a fund may appear multiple times simply for the wrong reasons, like a high current discount, high excess discount, or a very high distribution rate that may not be sustainable. But during the second stage of filtering, it may not score well on the overall quality score due to other factors like poor track record. That said, if a fund has appeared four times or more, it may be worth a second look.
Narrowing Down To Just 10-12 Funds
In our list of funds, we already may have some of the best probable candidates. However, so far, they have been selected based on one single criterion that each of them may be good at. That’s not nearly enough. So, we will apply a combination of criteria by applying weights to eight factors to calculate the total quality score and filter out the best ones.
We will apply weights to each of the eight criteria:
- Baseline expense (Max weight 5)
- Current distribution rate (Max weight 7.5)
- Excess discount/premium (Max weight 5)
- 3-YR NAV return (Max weight 5)
- 5-YR NAV return (Max weight 5)
- 10-YR NAV return (Max weight 5, if less than ten years history, an average of three-year and five-year)
- Excess NAV return over distribution rate (Max weight 5)
- Adjusted Coverage Ratio (Max weight 5): This weight is adjusted based on the type of fund to provide fair treatment to certain types like equity and sector funds. We assign some bonus points to certain types of funds, which by their make-up depend on capital gains to fund their distributions, to bring them at par with fixed-income funds. These fund types include Equity/ Sector equity (two bonus points), real estate (two points), covered call (two points), and MLP funds (variable). However, please note that this is just one of nine criteria that are being used to calculate the total quality score.
Once we have calculated the weights, we combine them to calculate “Total Combined Weight,” also called the “Quality Score.” The sorted list (spreadsheet) of 52 funds on the “combined total weight” is attached here:
File-for-export_-_5_Best_CEFs_July2022.xlsx
Sector-Wise (Asset-Class) Diversification:
In order to structure a CEF portfolio, it’s highly recommended to diversify in funds that invest in different types of asset classes. The top 24 funds (out of 47) selected based on the types of asset class and quality scores are listed below. This list includes no more than three funds from any single asset class. Also, please note that the quality score only indicates the likelihood of a good candidate, but investors should do further research and due diligence on individual names. Also, an otherwise good fund may not make it to the top because it may have become expensive and may not offer value at the current pricing.
In our list of 52, if we were to look at first on the basis of asset type (sector) and then based on the total quality score/weight, below is the list of top funds. However, if we had too many similar funds from the same fund family, we would generally ignore some of them to avoid duplicity. We selected 28 names as top funds this month. Please note that some asset classes may not show any names in a particular month due to the fact that these ratings are dynamic and time-sensitive and change from month to month.
(STK), (CII), (EOS), (AGD), (AOD), (EOD), (FUND), (OTCPK:DNIF), (NIE), (CSQ), (NCZ), (CHY), (MPV), (MCI), (DMO), (OXLC), (HFRO), (NBH), (BFK), (DFP), (LDP), (RNP), (RQI), (BCX), (THQ), (BST), (IFN), (IAF)
Table 8:
Author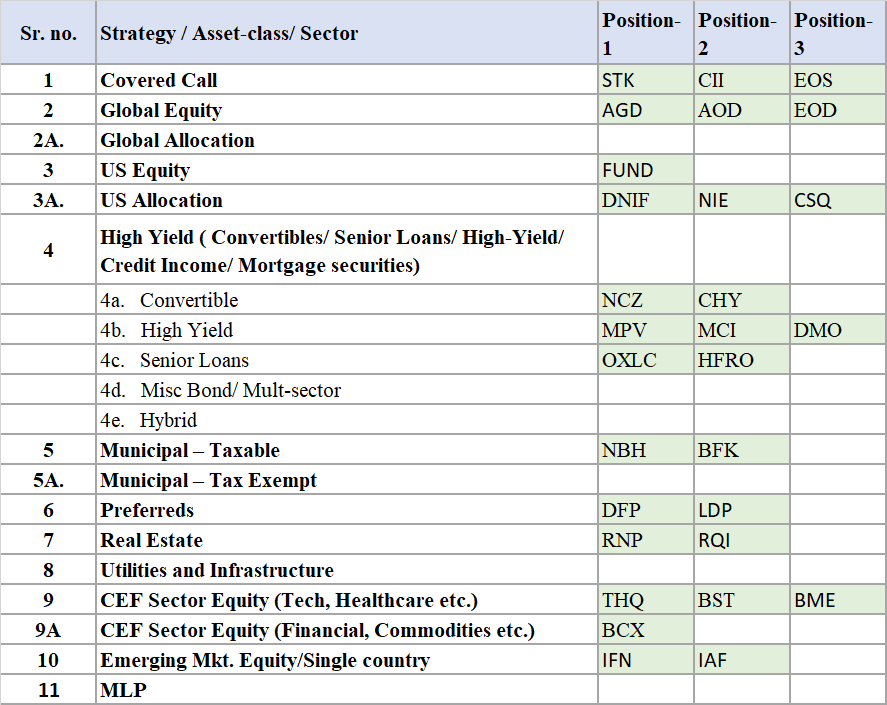
10-Positions Portfolio Of The Month
If you were to select ten picks, we could simply pick the top one from each of the above categories. That said, due diligence on each name is still highly recommended. Please note that some of these funds may have cut their distributions recently, and for some folks, that may be a good enough reason not to consider them. Also, in our final selections, we tend to give priority to funds that pay regular and consistent distributions on a monthly or quarterly basis. Funds that may have inconsistent dividends (even if they are high) generally do not make it to our top list. Also, be aware that many times, single-country funds score high in our rankings. Many of them pay variable dividends. In addition, being single-country funds, they can be inherently riskier since their future returns are tied to just one country, be it economic, regulatory, or geopolitical factors.
Here’s the list of the top 10 selections (from 10 different asset classes):
Table 9:
Author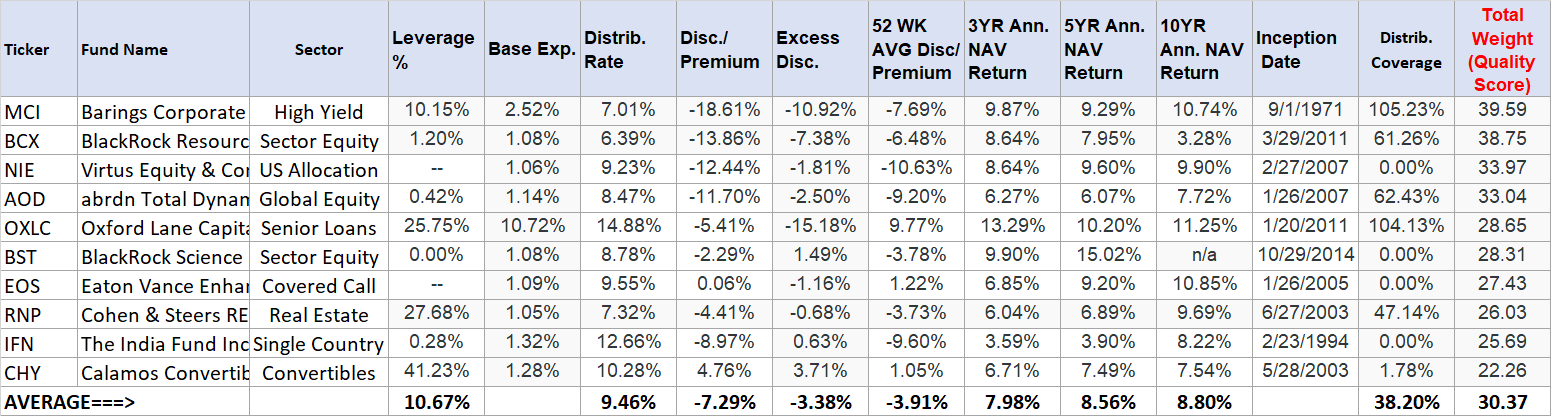
Final Selection: Our List Of Final Top 5
5-Positions Portfolio of the Month:
Now, if we had only five slots for investment and needed to select just five funds, we would need to make some subjective choices. We think our list of 10 selections above is quite compelling, and there are certainly more than five names that we like. While we narrow down this list, we should be careful to keep the list as diversified as possible in terms of asset classes. Since this step is mostly subjective, the choice would differ from person to person. Nonetheless, here are the selections for this month, based on our perspective:
Table: The Final 5 Funds:
Table 10:
Author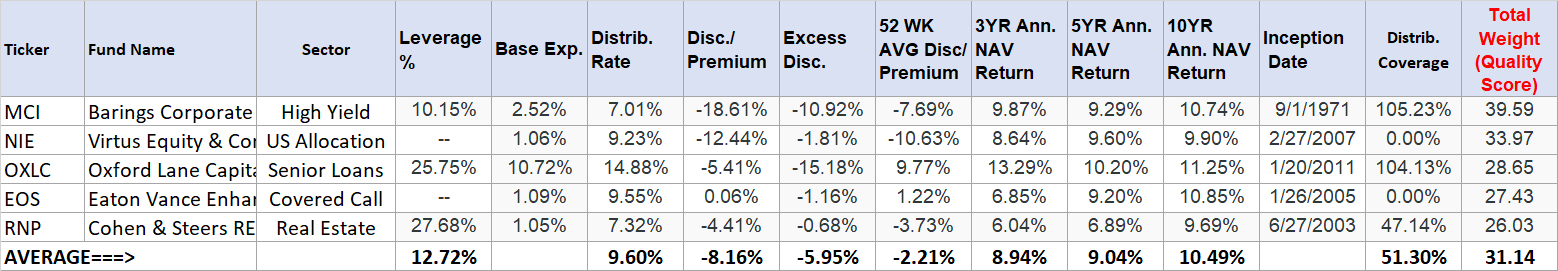
Some information about the selections:
- We recommend that readers look at both the top 10 and top 5 lists. The top-10 list offers much more of a diversified lot for the current market environment.
- MCI was incepted in 1971 and has a long history of success. Overall, it has returned roughly 12% per annum for the last 50 years, which is quite a feat. Since 1985 (37 years), the fund has returned a CAGR (Compounded Annual Growth Rate) of nearly 19% compared to 11% from the S&P500. The fund investments are privately placed, below-investment-grade, long-term corporate debt obligations with equity features such as warrants, conversion rights, and at times, preferred shares. It usually makes these investments directly from its issuers.
- NIE is a hybrid fund from the Allianz group with investments in equity as well as convertibles securities. The long-term performance record is good, and the yield is very attractive at 9.23%. It also offers a very attractive discount of over 12%.
- EOS is a covered call fund from the Eaton Vance family, focused on both dividend and growth stocks. The distribution yield is 9.5%, and the past performance record is one of the best in its category.
- RNP is a hybrid fund from Cohen & Steers fund family. It is invested in both Real-estate (or REITs) and Preferred securities. The yield is reasonable with a strong past performance record.
- OXLC is a fund that invests in Collateralized Loan Obligations (or CLOs). It invests primarily in senior, secured loans made to companies whose debt is unrated or rated below investment grade (Senior Loans), with the objective of generating income. The fund raised the dividend payout early this year, and its distribution is fully covered by net investment income. Moreover, the loans within CLOs that the fund is invested in are of floating rate type, so in a way, it is hedged against higher interest rates and inflation. The current yield is very high at over 14%.
CEF-Specific Investment Risks
It goes without saying that CEFs, in general, have some additional risks. This section is specifically relevant for investors who are new to CEF investing, but in general, all CEF investors should be aware of it.
They generally use some amount of leverage, which adds to the risk. The leverage can be hugely beneficial in good times but can be detrimental during tough times. The leverage also causes higher fees because of the interest expense in addition to the baseline expense. In the tables above, we have used the baseline expense only. If a fund is using significant leverage, we want to make sure that the leverage is used effectively by the management team – the best way to know this is to look at the long-term returns on the NAV. NAV is the “net asset value” of the fund after counting all expenses and after paying the distributions. So, if a fund is paying high distributions and maintaining or growing its NAV over time, it should bode well for its investors.
Due to leverage, the market prices of CEFs can be more volatile as they can go from premium pricing to discount pricing (and vice versa) in a relatively short period. Especially during corrections, the market prices can drop much faster than the NAV (the underlying assets). Investors who do not have an appetite for higher volatility should generally stay away from CEFs or at least avoid the leveraged CEFs.
CEFs have market prices that are different from their NAVs (net asset values). They can trade either at discounts or at premiums to their NAVs. Generally, we should stay away from paying any significant premiums over the NAV prices unless there are some very compelling reasons.
Another risk factor may come from asset concentration risk. Many funds may hold similar underlying assets. However, this is easy to mitigate by diversifying into different types of CEFs ranging from equity, equity covered calls, preferred stocks, mortgage bonds, government and corporate bonds, energy MLPs, utilities, and municipal income.
Concluding Thoughts
We use our screening process to highlight five likely best closed-end funds for investment each month. We also provide a larger list of ten CEFs, with some of the top candidates from each of the asset classes. As always, our filtering process demands that our selections have an excellent long-term record, maintain decent earnings to cover the distributions (in certain categories), offer an average of 7%-8% distributions, are cheaper on a relative basis, and offer a reasonable discount. Also, we ensure that the selected five funds are from a diverse group in terms of the types of assets. Please note that these selections are based on our rating system and are dynamic in nature. So, they can change from month to month (or even week to week). At the same time, some of the funds can repeat from month to month if they remain attractive over an extended period.
The selected five CEFs this month, as a group, are offering an average distribution rate of 9.60% (as of 07/08/2022). Besides, these five funds have an excellent past record and collectively returned 8.94%, 9.04%, and 10.5% in the last three, five, and ten years. The average leverage is low at about 12.75%, with an average excess discount of -6%.
When it comes to CEF investing, we always recommend that it’s best to be a bit conservative and build our positions by adding in small and multiple lots to take advantage of dollar-cost averaging. We believe that the above group of CEFs makes a great watch list for further research.
Be the first to comment