

peshkov/iStock via Getty Images
Stock picking is a lot harder than just throwing a dart at speculative tech stocks or SPACs in 2020 or 2021.
JPMorgan Asset Management 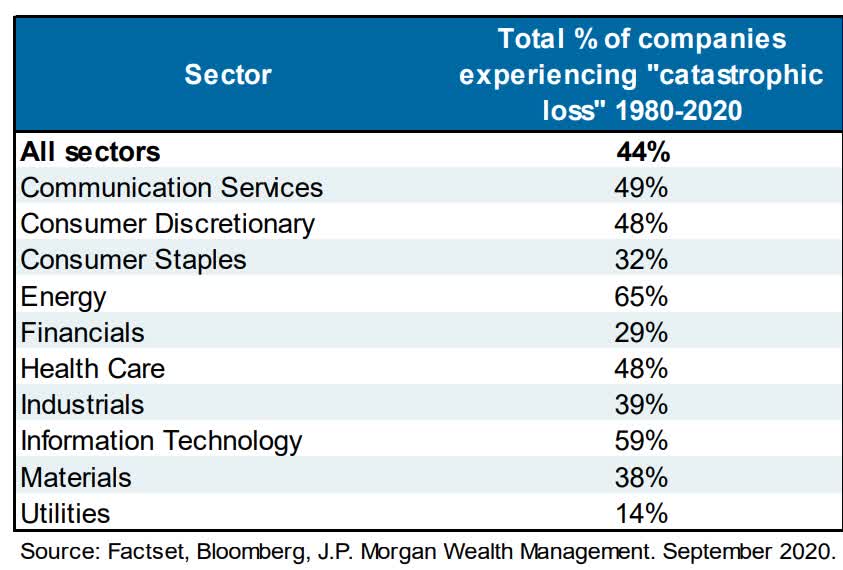
From 1980 to 2020 44% of US stocks suffered catastrophic 70+% losses and never recovered.
“In order to win the game, first you must not lose it.” – Chuck Noll
This is why I’m obsessed with safety and quality first, and prudent valuation, and sound risk-management always. But even the greatest investors in history only tend to be right 60% to 65% of the time.
Historically, 35% of Buffett’s stock picks lose money but holding the winners for decades is why he’s the greatest long-term investor in history.
“Fortunes are made by buying right and holding on.” – Tom Phelps
This doesn’t mean the stock market is a complete crap-shoot, there are proven long-term winning strategies.
BlackRock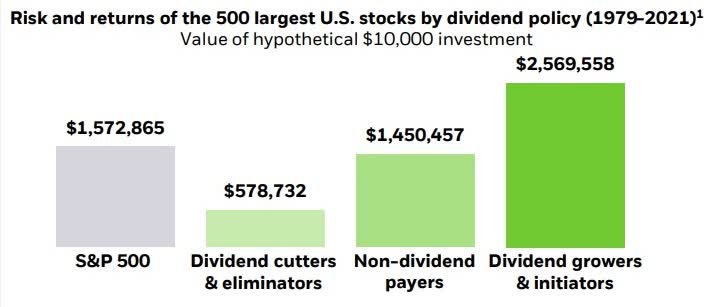
For example, dividend growth blue-chips, if owned for decades, are a proven way of generating about 66% higher historical returns or about 1.2% higher annual returns.
But here too the devil is in the details. Say you are a retired investor and your #1 priority is to pay the bills will safe and growing dividends.
Your #1 priority is to avoid dividend cuts, so that your income rises each year, faster than inflation, helping you to retire in safety and splendor.
Surely the dividend aristocrat ETF (NOBL) is the ideal investment for you right?
ProShares S&P 500 Dividend Aristocrats ETF Since November 2013
(Source: Portfolio Visualizer Premium) (Source: Portfolio Visualizer Premium)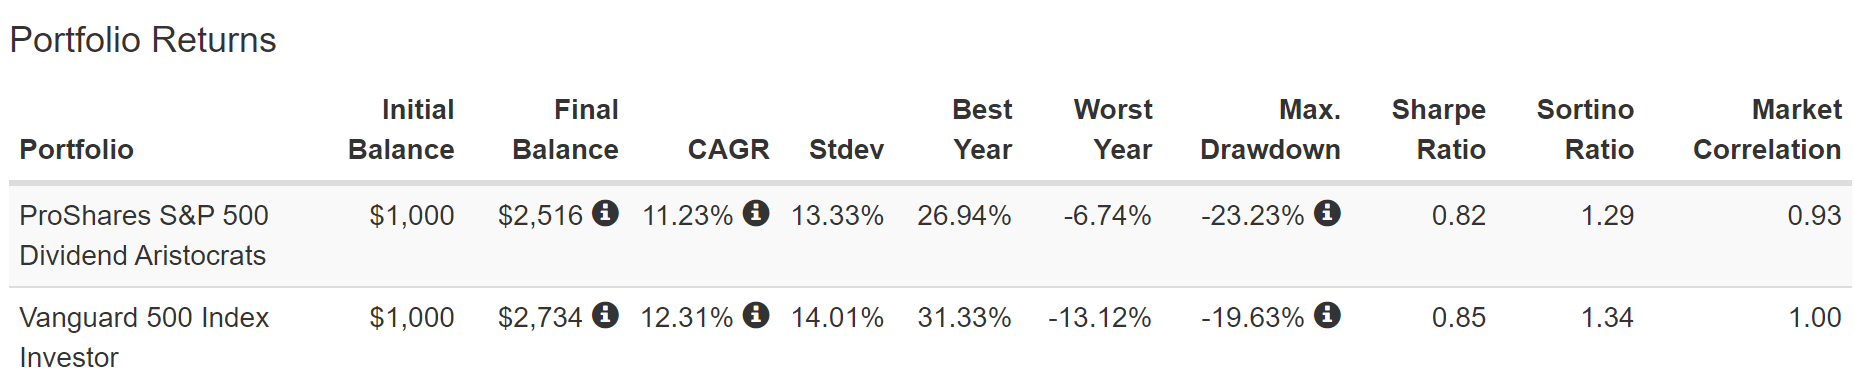
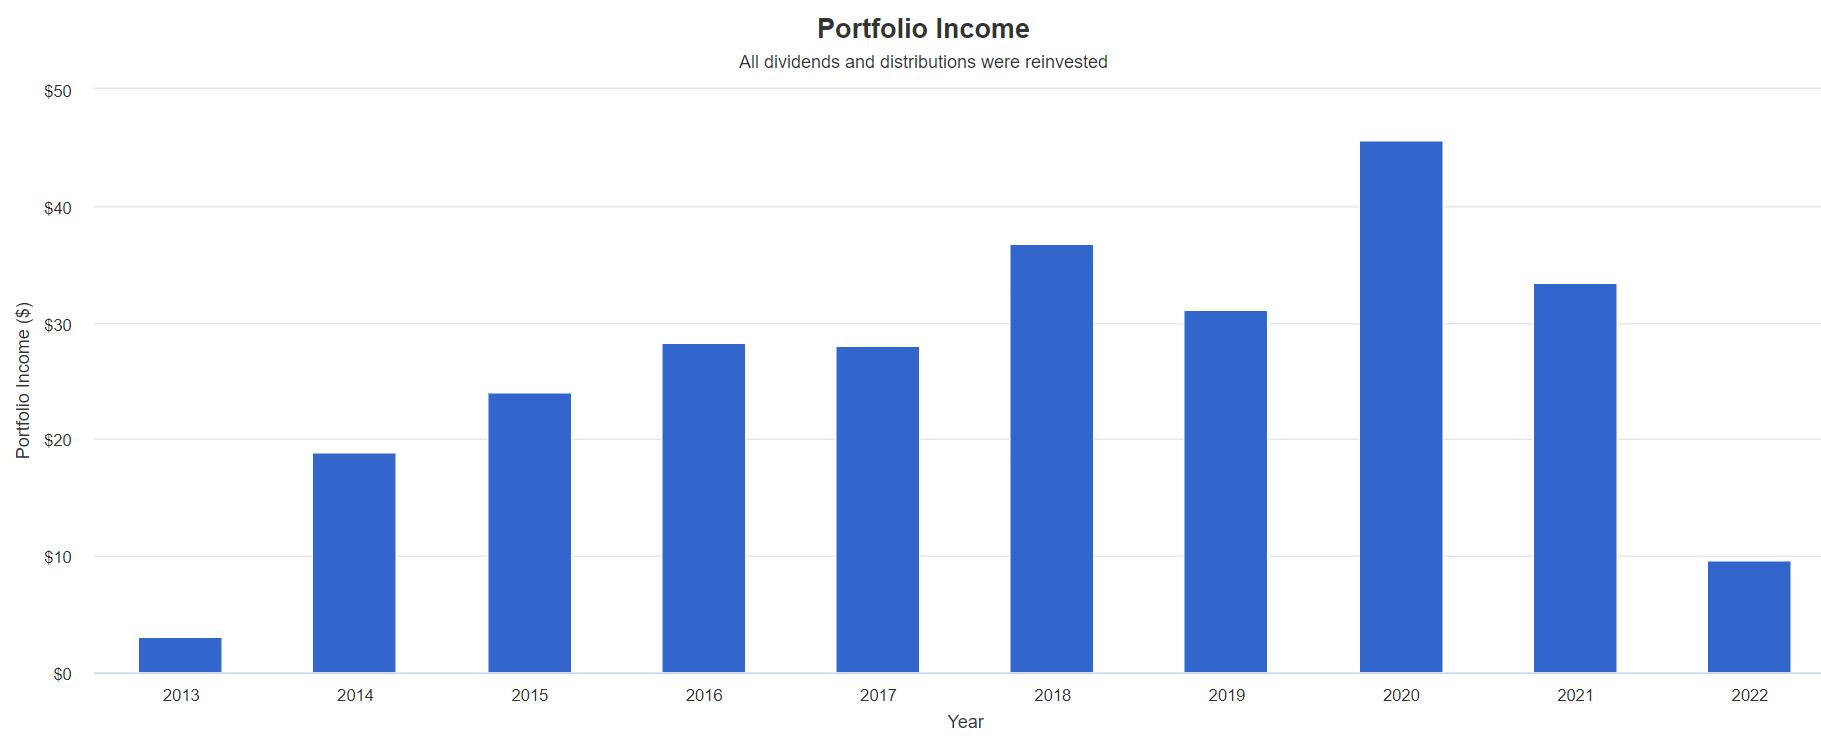
Actually, the dividend aristocrats have a somewhat variable dividend because of how the ETF is constructed and rebalanced each quarter.
The same is true of the S&P dividend ETF (SDY) which selects for blue-chips with 20+ year dividend growth streaks.
SPDR S&P Dividend ETF Since December 2005
(Source: Portfolio Visualizer Premium)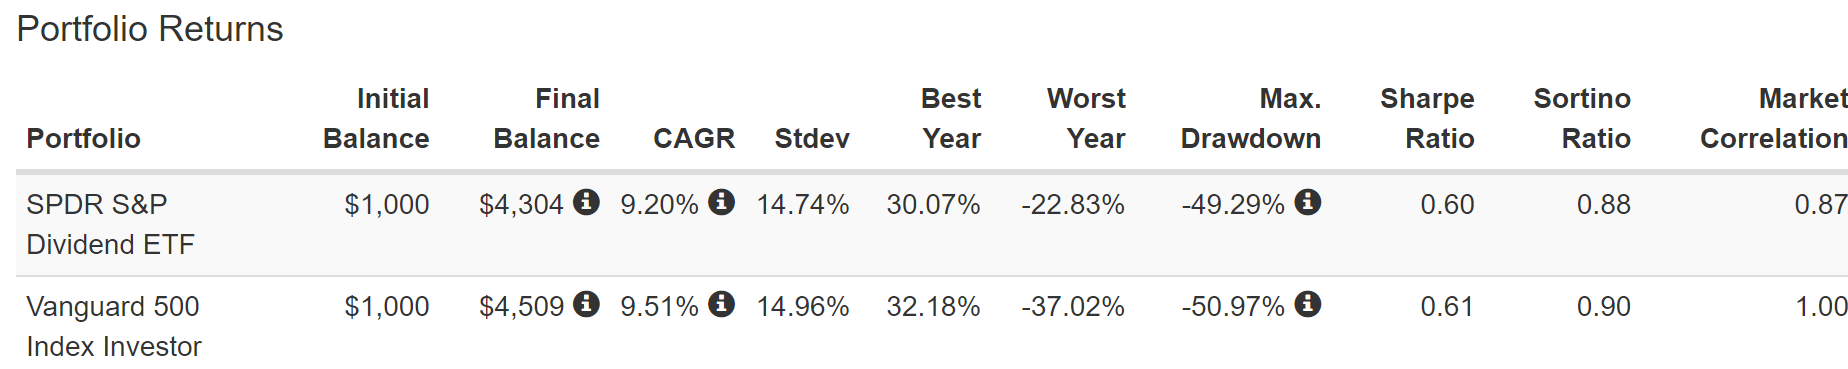
(Source: Portfolio Visualizer Premium)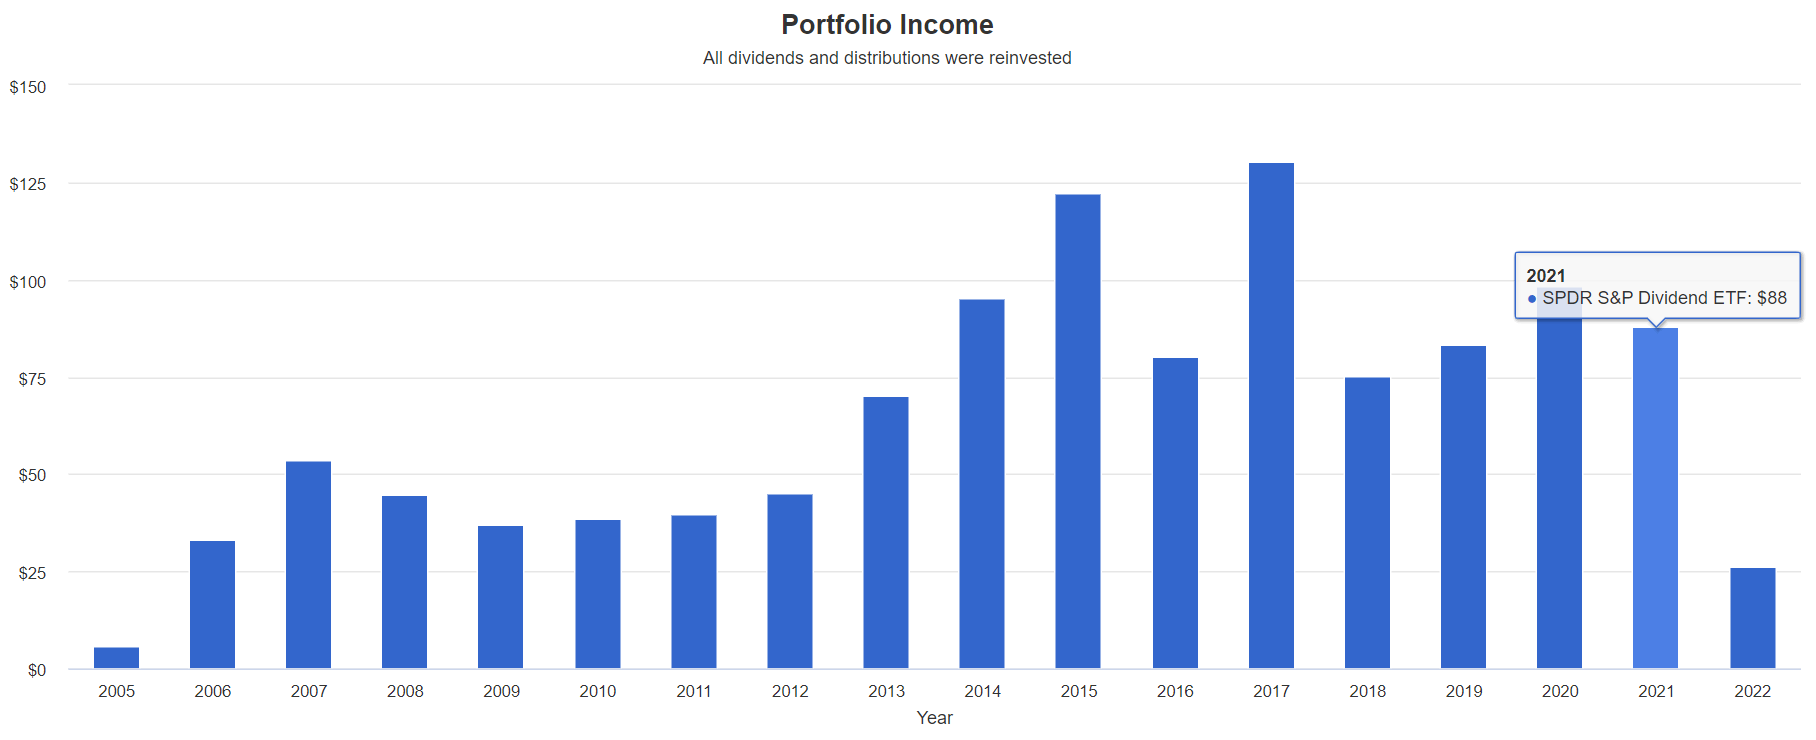
In fact, SDY’s dividend income is highly volatile and still hasn’t recovered from the 2017 peak.
Or how about this Morningstar silver-rated and highly recommended dividend growth mutual fund.
Vanguard Equity-Income Fund (VEIRX) Since September 2001
(Source: Portfolio Visualizer Premium) (Source: Portfolio Visualizer Premium)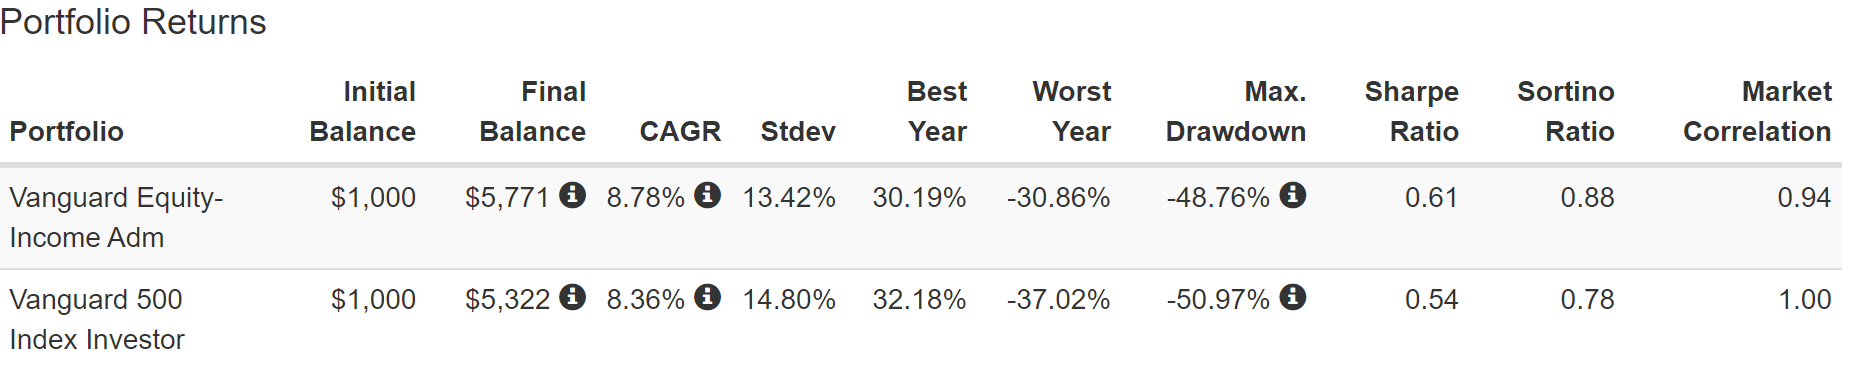
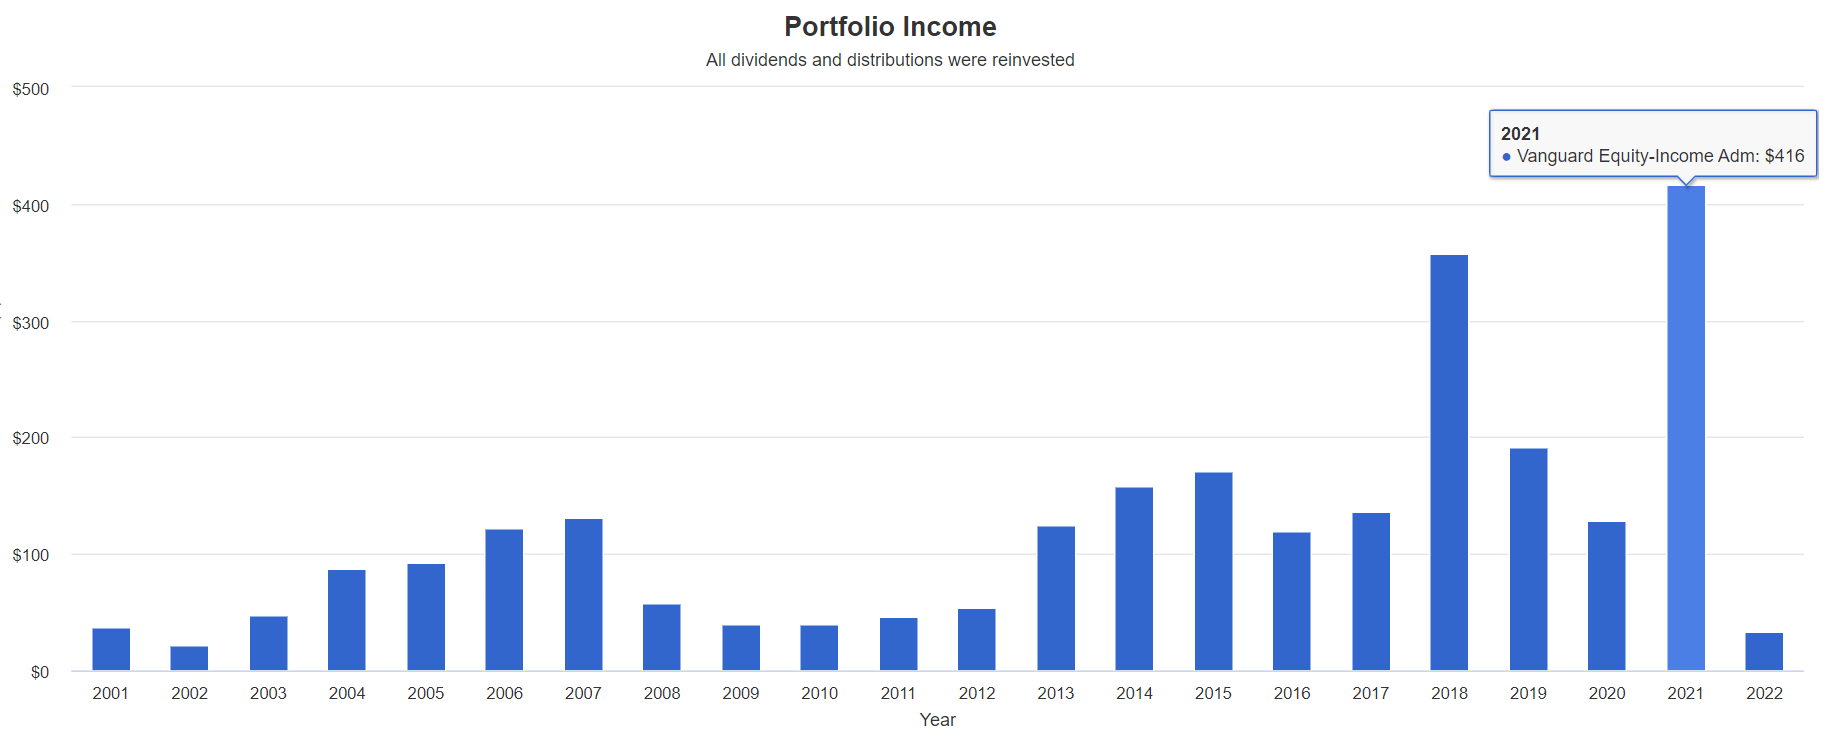
In other words, just because dividend growth investing is a proven way of helping you retire rich and stay rich in retirement, doesn’t necessarily mean you can just buy any old dividend ETF and sleep well at night.
So let me show you the result of many hours of research I’ve undertaken as part of the Dividend Kings Preparing for Recession series, a 40-part video comprehensive guide to sleeping well at night and thriving through the recession that 75% of Fortune 500 CEOs think is coming within 18 months.
4 Dividend ETFs Retirees Can Trust
My four favorite dividend ETFs are:
- Schwab U.S. Dividend Equity ETF (SCHD)
- Vanguard High Dividend Yield ETF (VYM)
- Vanguard Dividend Appreciation ETF (VIG)
- iShares Core Dividend Growth ETF (DGRO)
Why do I like these four the most? And why do I and the Dividend Kings incorporate them into some of our balanced portfolios?
Let’s take a closer look at each ETF and why I trust them and you likely can too.
Schwab U.S. Dividend ETF: My Favorite High-Yield Dividend Growth Choice
Morningstar Summary
Focuses on dividends and fundamentals. Schwab U.S. Dividend Equity ETF SCHD crafts a modified market-cap-weighted portfolio of disciplined dividend stocks with sound fundamentals. It applies constraints and buffers that diversify risk and curb turnover. This fund’s thoughtful construction and competitive fee earn it a Morningstar Analyst Rating of Silver.
This fund’s focus on fundamentals promotes durable yield, as stocks on firm financial footing are well-positioned to continue dividend policies. It also allows the fund to tap into the quality factor, which has historically been tied to market-beating performance.” – Morningstar
Portfolio Fundamentals
(Source: Morningstar)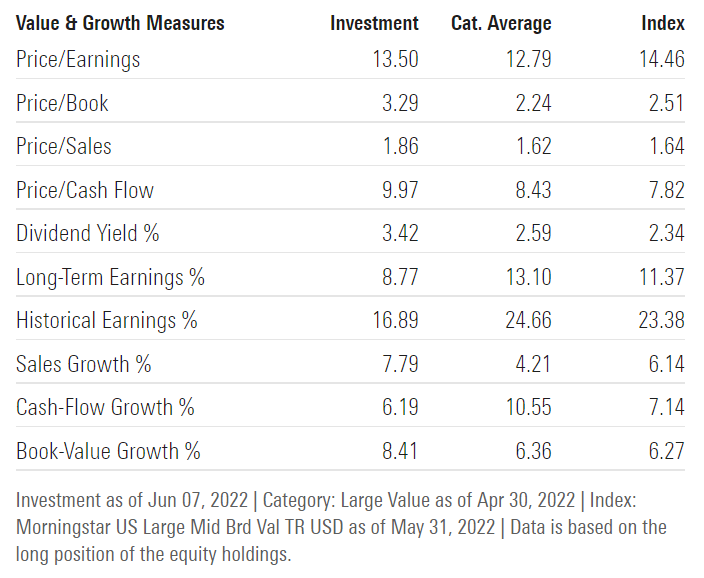
A very attractive 13.5X PE and solid market-level long-term expected growth rate.
(Source: Morningstar)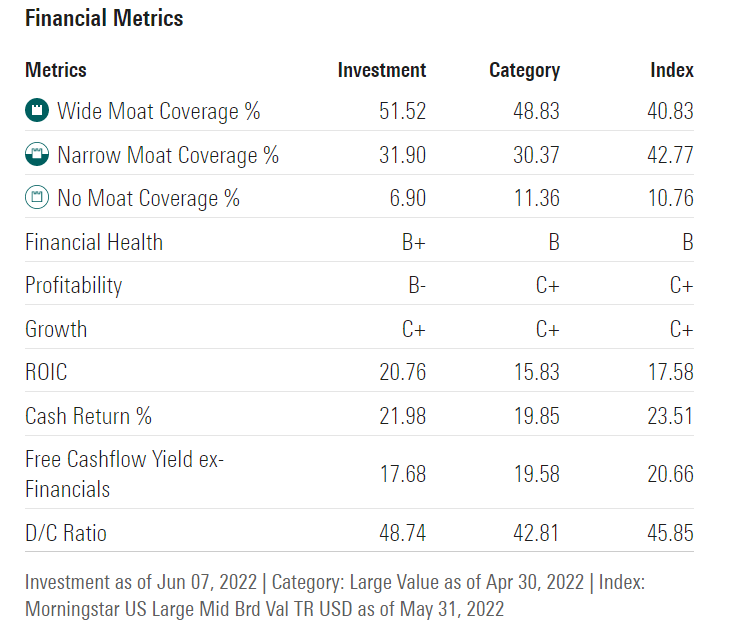
83% wide and narrow moat companies with the strongest financials we’ve seen yet from high-yield ETFs.
And a highly attractive 18% free cash flow yield and 49% dividend payout ratio.
- rating agencies consider 60% to be safe for most industries and sectors
(Source: Morningstar)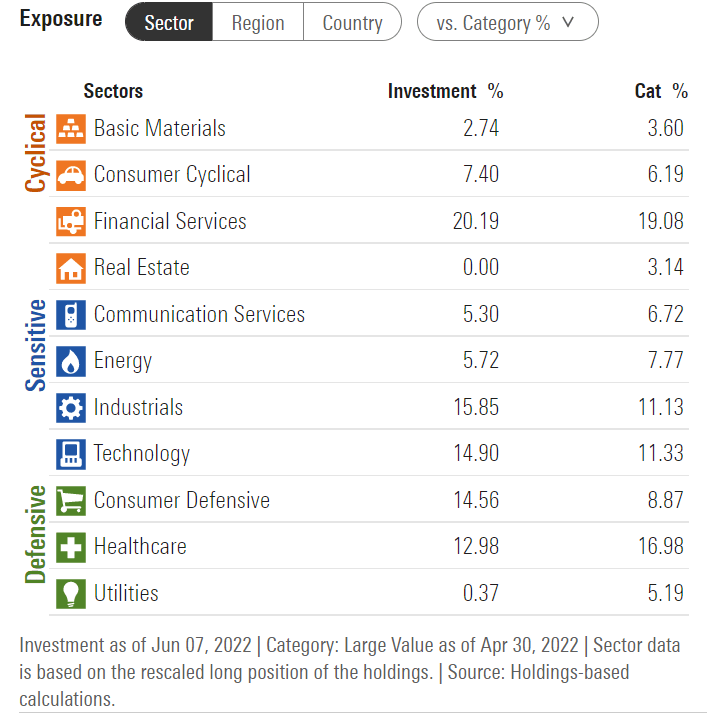
Slightly overweight consumer defensive, technology, and industrials.
(Source: Morningstar)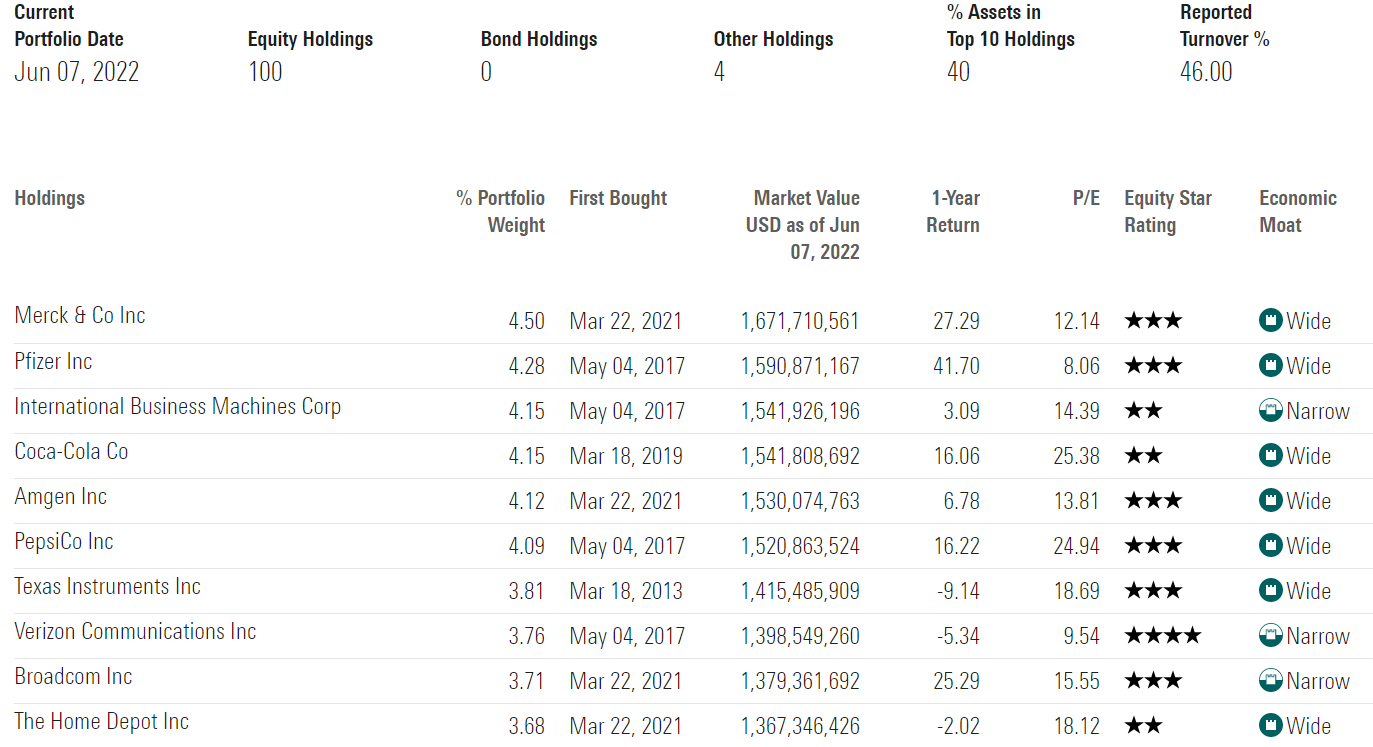
A more concentrated portfolio with 100 companies but the top 10 make up 40% of the portfolio.
- heavier exposure to Ultra SWANs like MRK, AMGN, PEP, TXN, and HD
- also about 20% tech exposure (such as AVGO)
- which is a good thing in my opinion since tech is the fastest-growing part of the economy
Vanguard High Dividend ETF: A Battle-Tested Source Of Safe High-Yield
Morningstar Summary
Higher yield with lower risk. Vanguard High Dividend Yield provides a delicate balance between pursuing yield and mitigating risk. Weighting stocks by market cap steer the fund toward more stable, large-cap stocks and away from those whose dividends may be distressed. However, while this fund has a strong process, there are risks lingering at the margin that prevent us from assigning it our highest-conviction positive rating. As such, we are downgrading our Morningstar Analyst Rating for the fund’s exchange-traded fund share class to Silver from Gold. Its Admiral share class maintains a Silver rating.
The fund tends to have lower turnover and firm-specific risk compared with many of its dividend-focused strategic-beta peers. Its annual turnover often ranges between 10% and 15%–even lower than the Morningstar Category index. It is also not very top-heavy. Typically, around 25% to 35% of its assets are allocated to its top 10 holdings. This compares with a range of 40% to 50% for dividend-yield-focused peers in its category.” – Morningstar
Portfolio Fundamentals
(Source: Morningstar)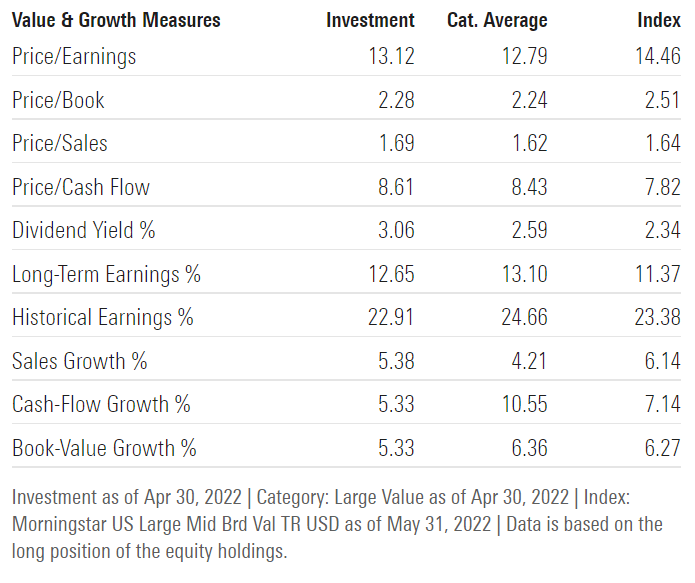
A highly attractive 13.1 average PE and relatively faster growth profile (according to Morningstar analysts).
(Source: Morningstar)
Not quite as wide moat as SCHD but close, with 92% wide or narrow moat.
Profitability is slightly less than SCHD but still slightly above-average and very attractive 20% FCF yield and very safe 46% payout ratio.
(Source: Morningstar)
Well diversified with a slight overweighting to consumer defensives.
(Source: Morningstar)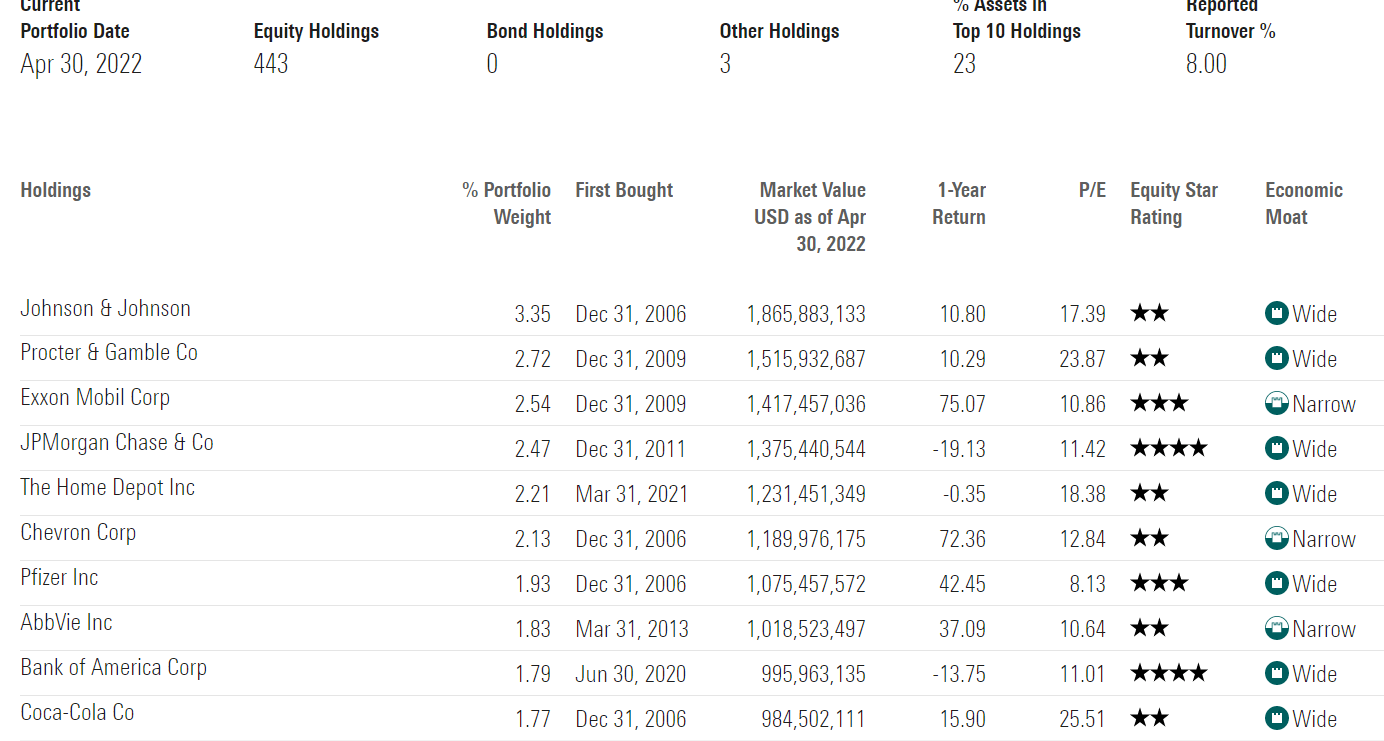
Very strong diversification with 443 holdings and 23% in the top 10, and a very low 8% turnover.
Good exposure to Ultra SWANs like JNJ, PG, KO, and HD.
Vanguard Dividend Appreciation ETF: A Dividend Achiever ETF With An Impeccable Record
Morningstar Summary
A solid, low-cost portfolio of high-quality dividend growers. Vanguard Dividend Appreciation focuses on quality franchises that have reliably increased the amount of cash they give back to shareholders over time. The fund’s new index utilizes a very similar approach that plies a near-identical strategy while offering greater transparency and taking a more measured approach to rebalancing in order to minimize market impact costs. We maintain our Morningstar Analyst Rating of Gold for the U.S. share classes and Silver for the Canadian exchange-traded fund.
The fund will switch from the Nasdaq US Dividend Achievers Select Index to the S&P Dividend Growers Index in the third quarter of 2021. Both indexes sweep in stocks that have increased their dividend for at least 10 consecutive years and weight them by market cap…These stringent selection criteria yield a portfolio that balances income, capital appreciation, and risk. The long look-back period ensures constituents are stable companies with a proven track record, taking out even household names such as Intel INTC or Apple AAPL.” – Morningstar
Portfolio Fundamentals
(Source: Morningstar)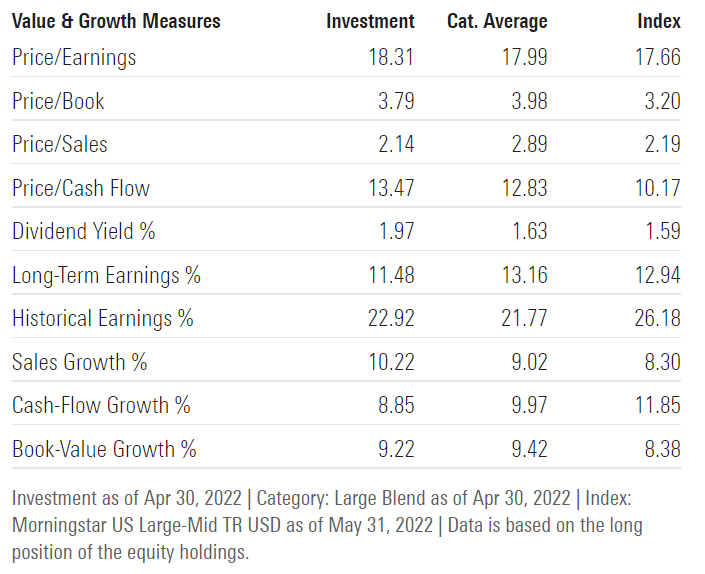
Relatively higher valuations at 18.3, more than the market’s 17X.
Solid double-digit growth profile.
(Source: Morningstar)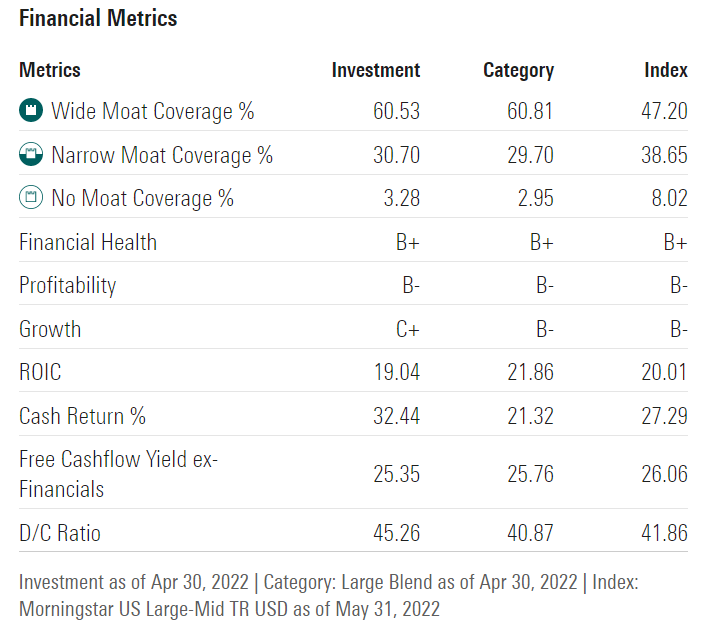
The widest moat ETF so far with 61% wide-moat companies and 97% wide and narrow moat. B+ financial health is tied for the highest we’ve seen.
Attractive 25% free cash flow yields and a very safe 45% payout ratio.
(Source: Morningstar)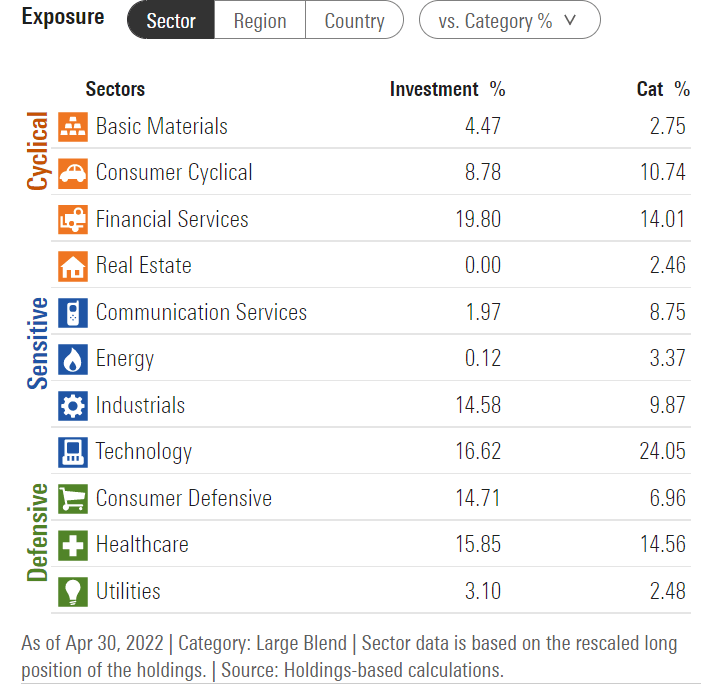
Overweight financials and consumer staples and underweight energy and no REITs. A nice 19% exposure to tech and communications.
(Source: Morningstar)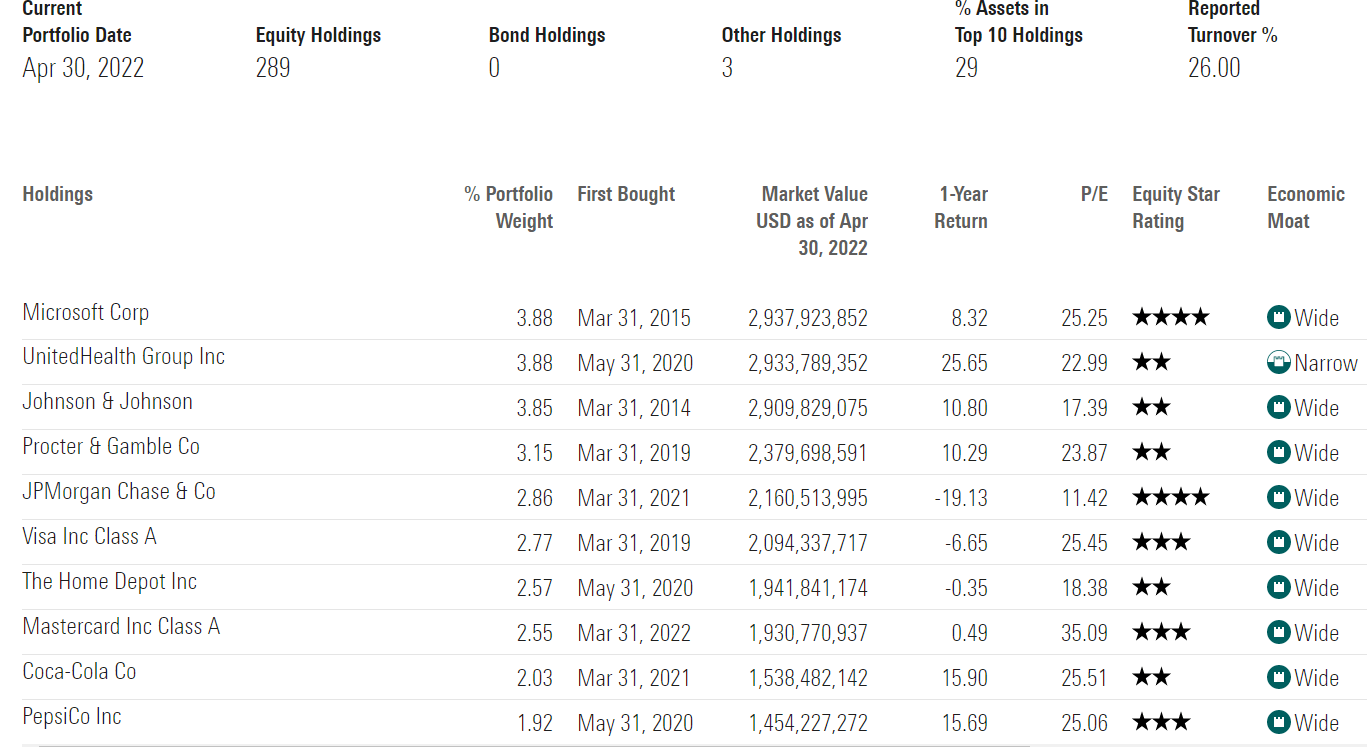
A highly diversified portfolio of almost 300 companies with 29% in the top 10.
- high exposure to Ultra SWANs like MSFT, JNJ, PG, V, HD, MA, KO, and PEP.
- as close to an Ultra SWAN ETF as I’ve found so far
iShares Core Dividend Growth ETF: A Wide Moat Blue-Chip Powerhouse
iShares Description
“The iShares Core Dividend Growth ETF seeks to track the investment results of an index composed of U.S. equities with a history of consistently growing dividends.” – BlackRock
What does a history of consistently growing dividends mean to BlackRock?
(Source: iShares)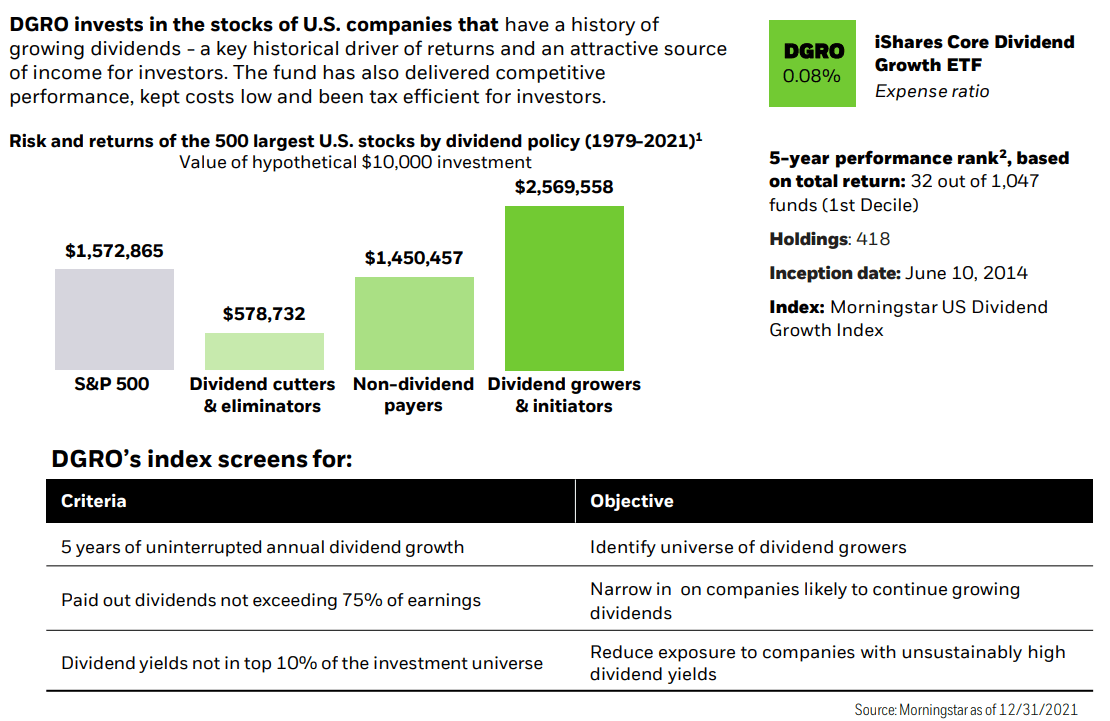
DGO starts with the dividend challengers list and then screens for payout ratios of 75% or less and yields not in the top 10%.
- to reduce the risk of future dividend cuts
Portfolio Fundamentals
(Source: Morningstar)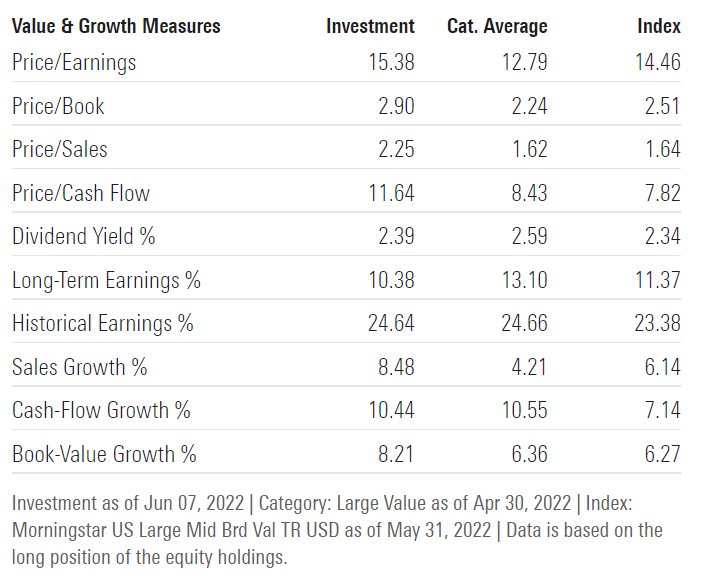
A reasonable valuation of 15.4X compared to the S&P 500’s 17X and attractive double-digit growth profile.
(Source: Morningstar)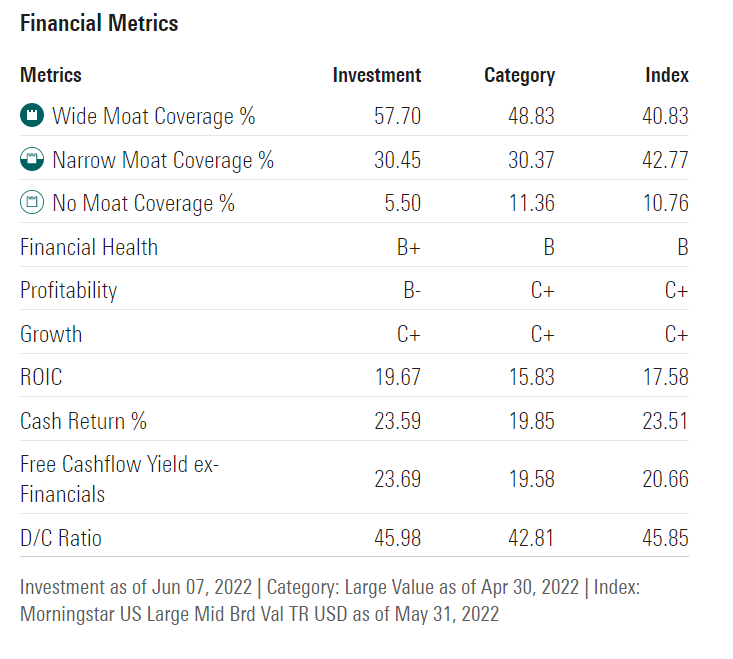
A very wide moat ETF at 58% wide moat and 94% wide and narrow moat.
The financial health of BBB+ is tied for the highest we’ve seen (with SCHD) and a very attractive 24% free cash flow yield.
(Source: Morningstar)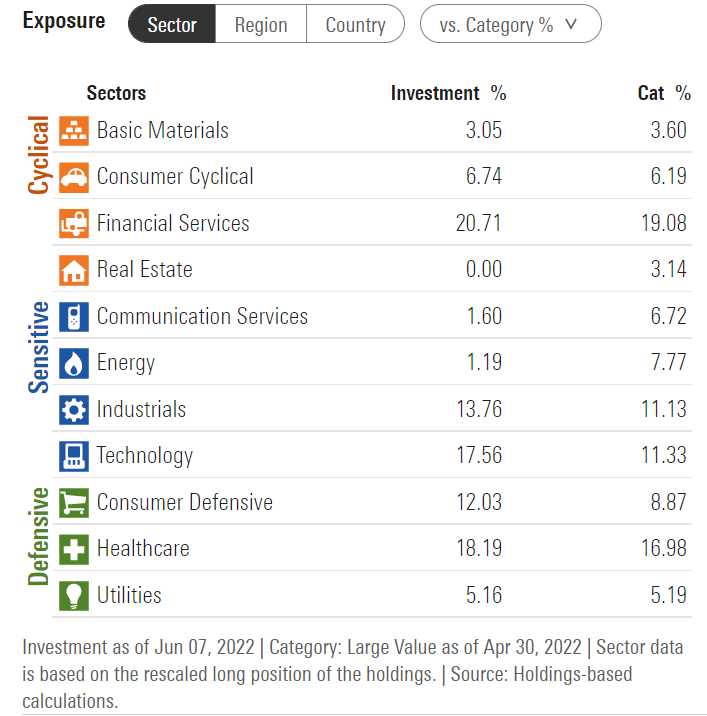
Underweight energy, no REIT exposure, slightly overweight consumer staples, and 20% tech (including communications like GOOG and FB).
(Source: Morningstar)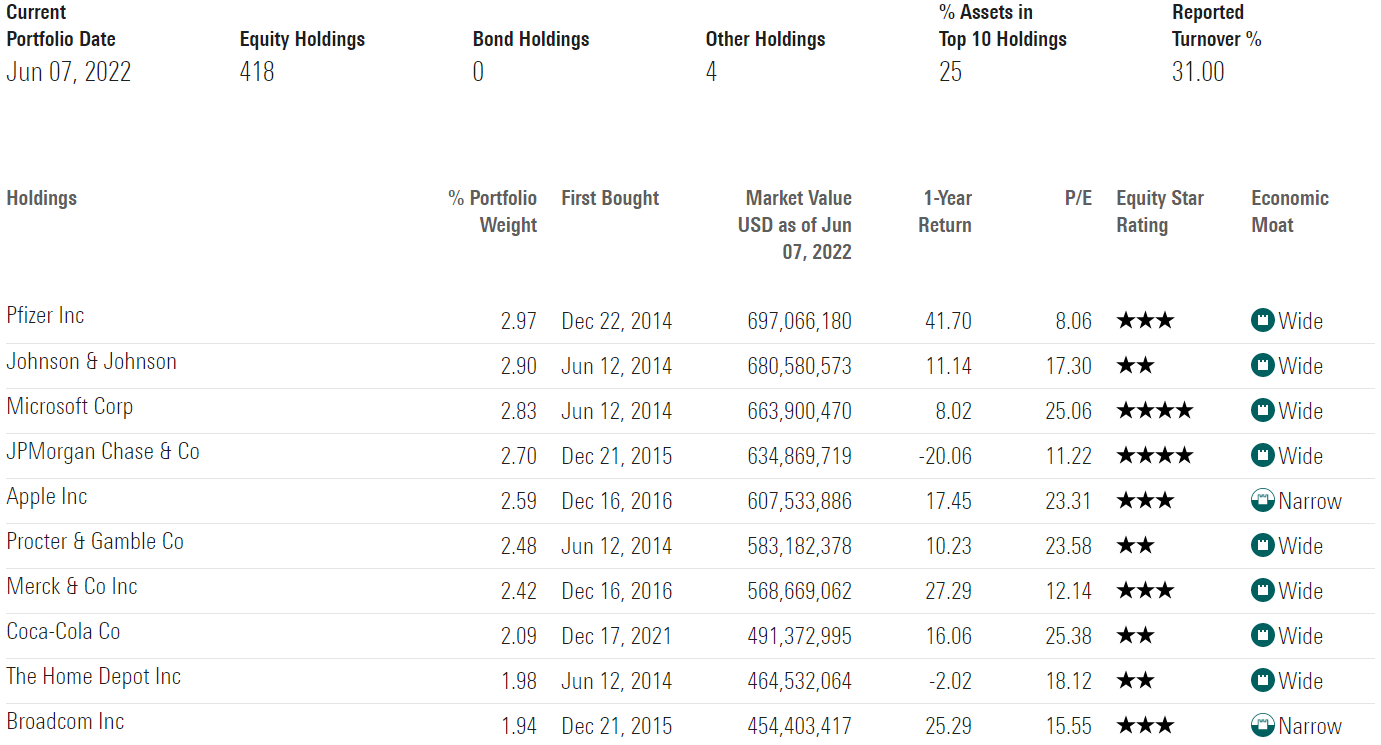
Highly diversified with 418 companies and 25% in the top 10.
Good exposure to Ultra SWANs like JNJ, MSFT, AAPL, PG, MRK, KO, and HD.
Ok, so we can see how each of these dividend growth ETFs offers impeccable safety and quality, reasonable to attractive valuation, and attractive income growth potential.
But the reason I recommend and use them myself is because of their track records of delivering good returns, and reliable dividend growth over time.
Historical Return: Backing Up The Theory With Actual Results
“The future doesn’t repeat, but it often rhymes.” – Mark Twain
Past performance is no guarantee of future results, but studies show that blue-chips with relatively stable fundamentals over time offer predictable returns based on yield, growth, and valuation mean reversion.
Bank of America
So let’s see how these blue-chip dividend growth ETFs have performed since inception.
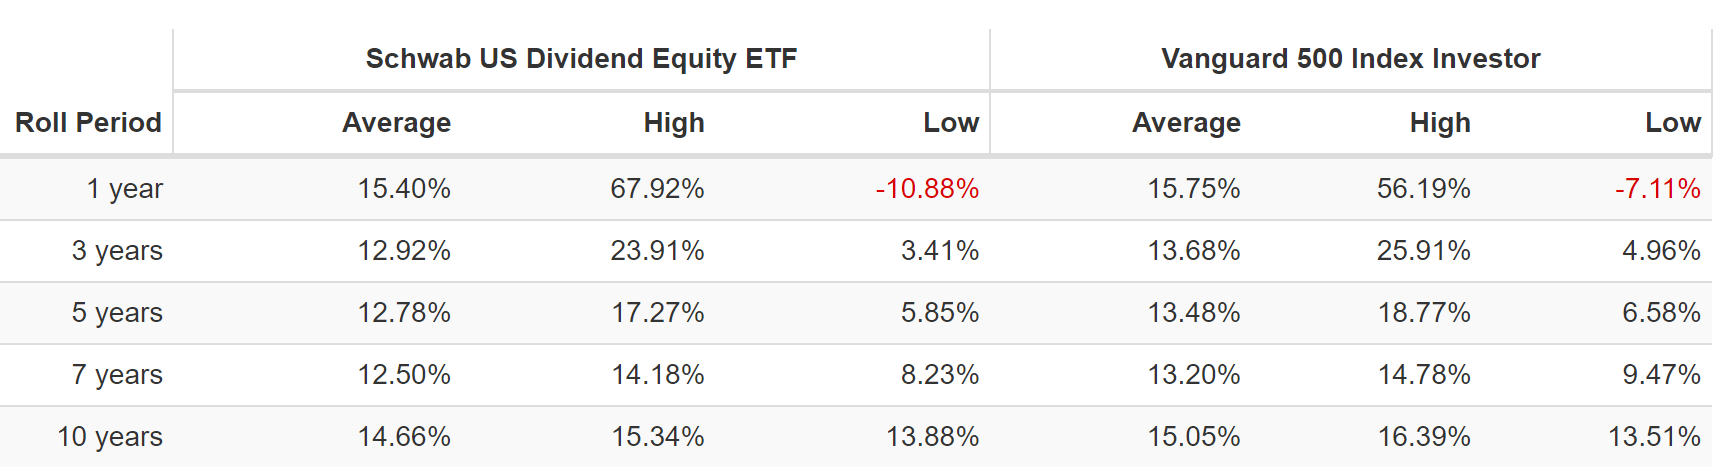
Schwab U.S. Dividend ETF – My Personal Favorite High-Yield ETF, Since November 2011
(Source: Portfolio Visualizer Premium) (Source: Portfolio Visualizer Premium) (Source: Portfolio Visualizer Premium) (Source: Portfolio Visualizer Premium) (Source: Portfolio Visualizer Premium)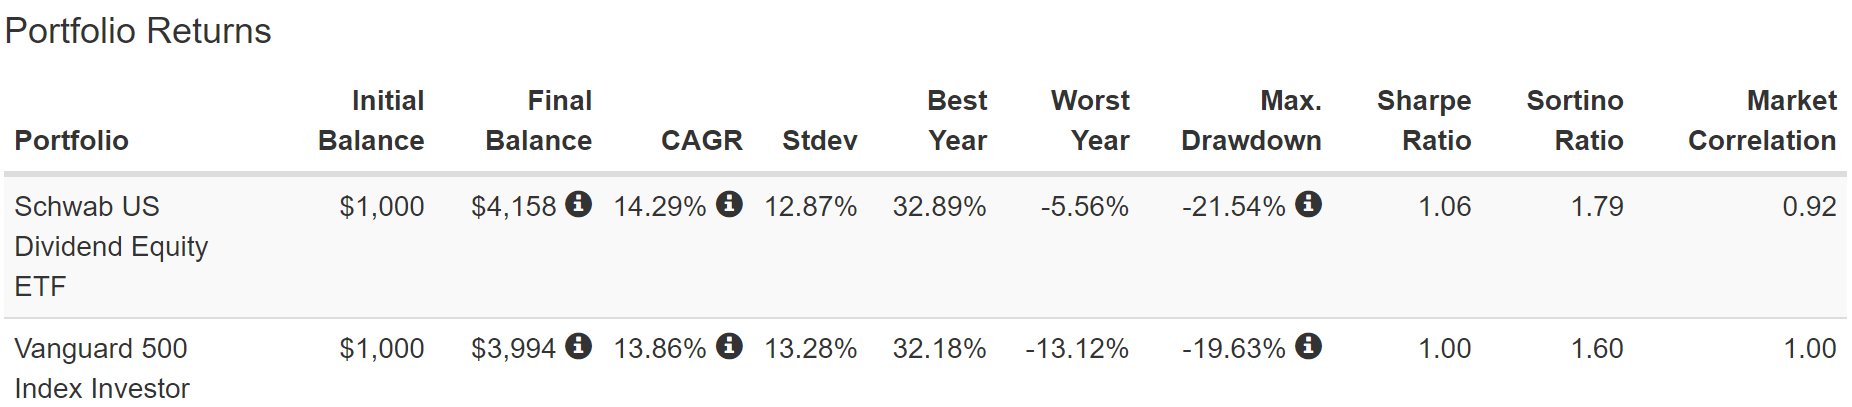
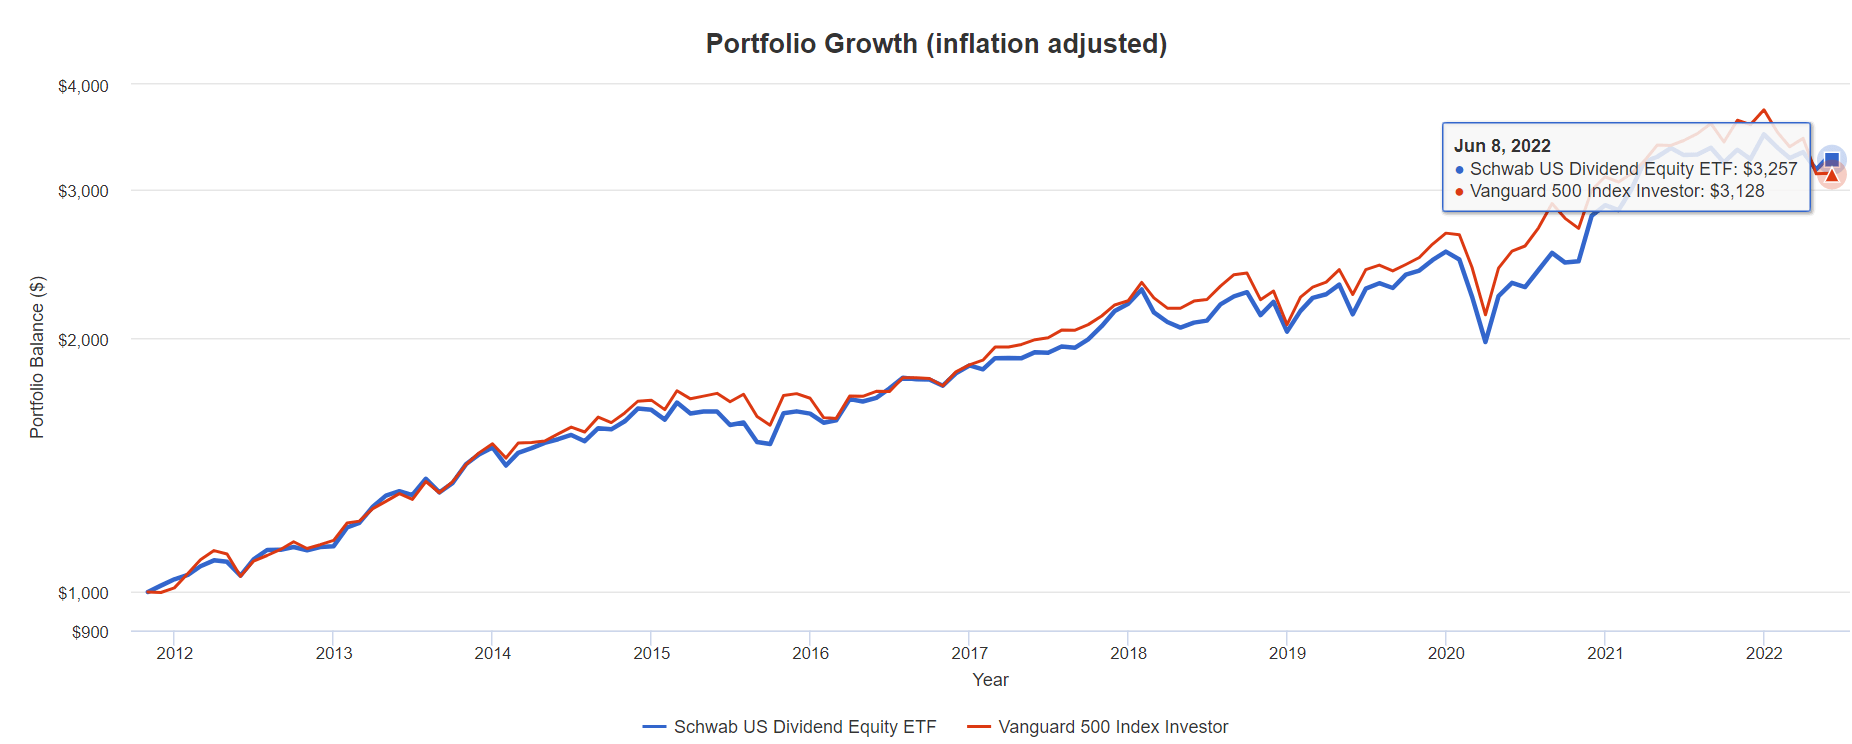
- slightly lower annual volatility to the S&P 500 (most dividend ETFs are more volatile in the last decade)
- kept up with the S&P 500 almost the entire time (unlike almost every other dividend ETF)
- but with 2X the yield
- average 1-year return of 15.4%
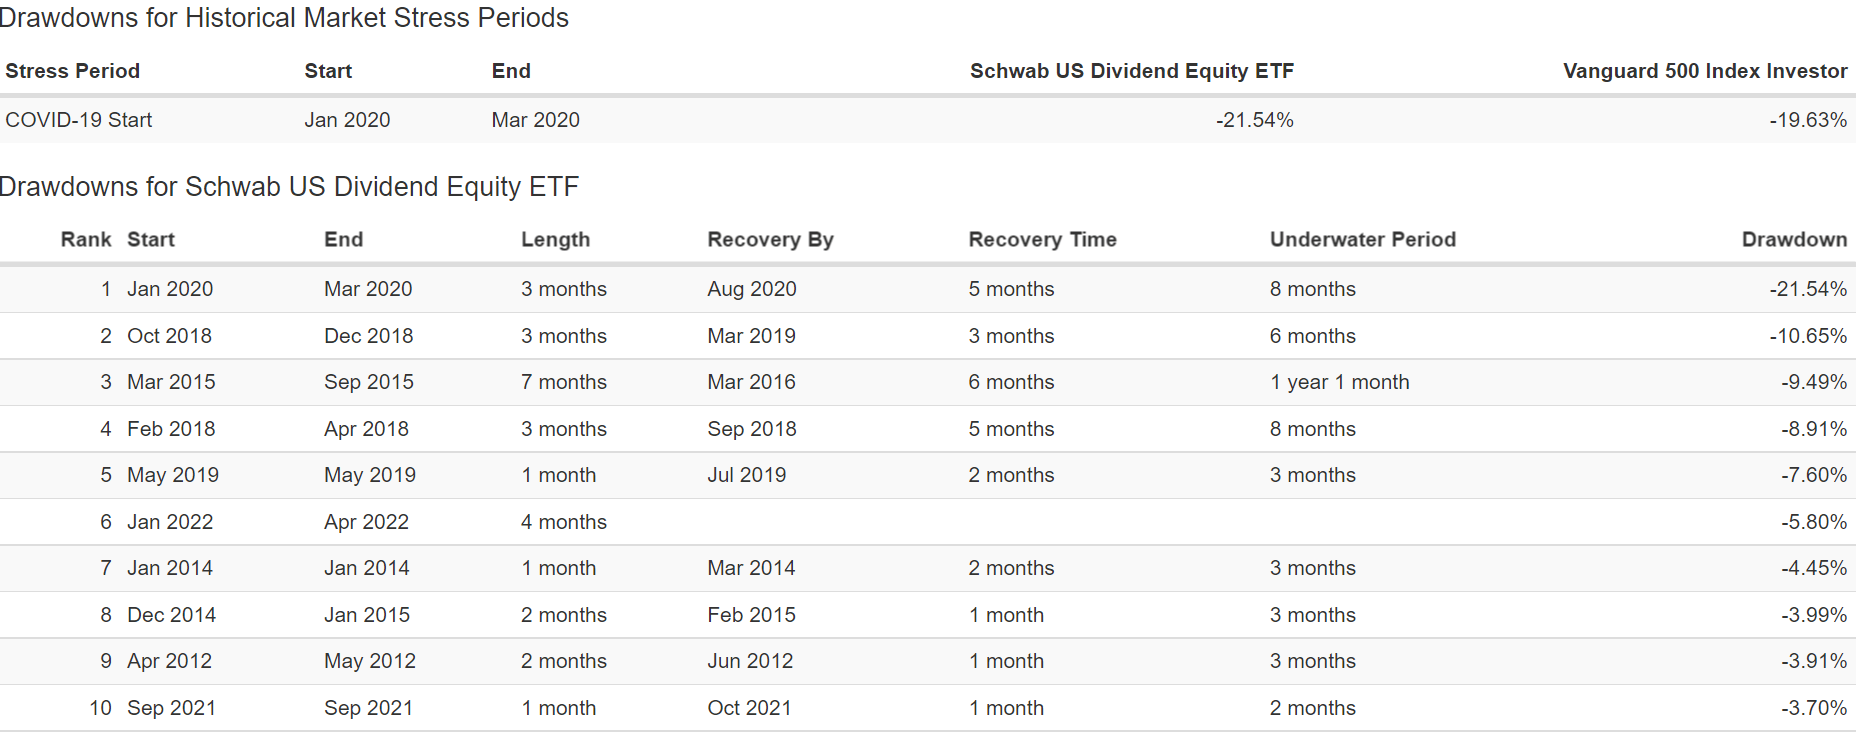
- almost identical peak decline in the Pandemic (21% in March 2020 vs 20% S&P) most dividend ETFs fell far more
- In 2022 bear market down 6% vs S&P 500’s 13% (through April)
- 326% inflation-adjusted returns vs 313% S&P 500
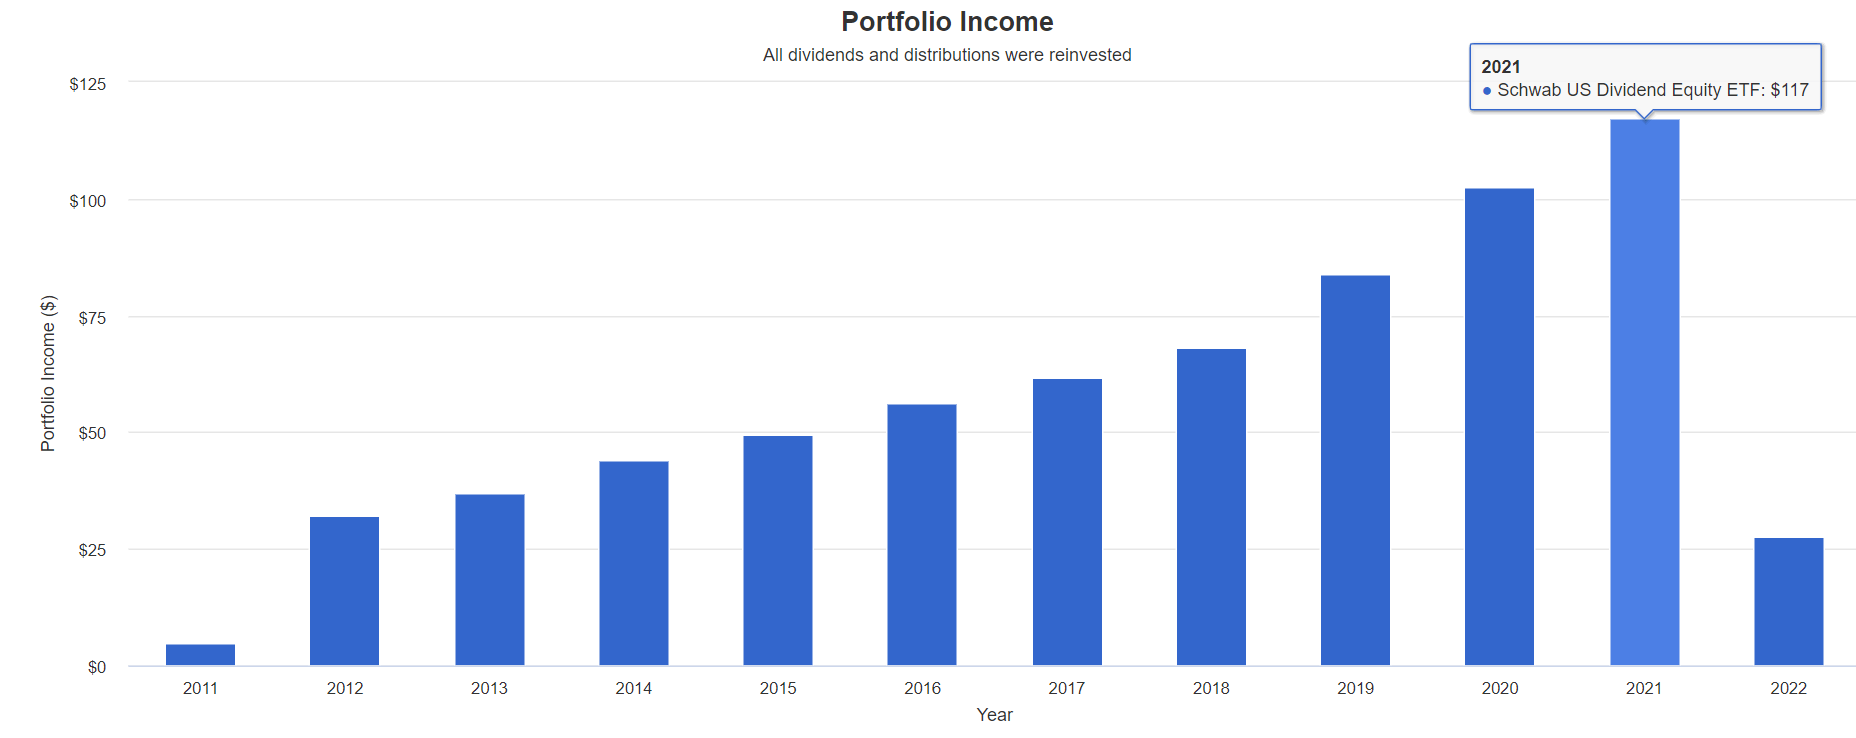
- extremely stable dividend growth since 2012 (first full year) zero years of declining dividends so far
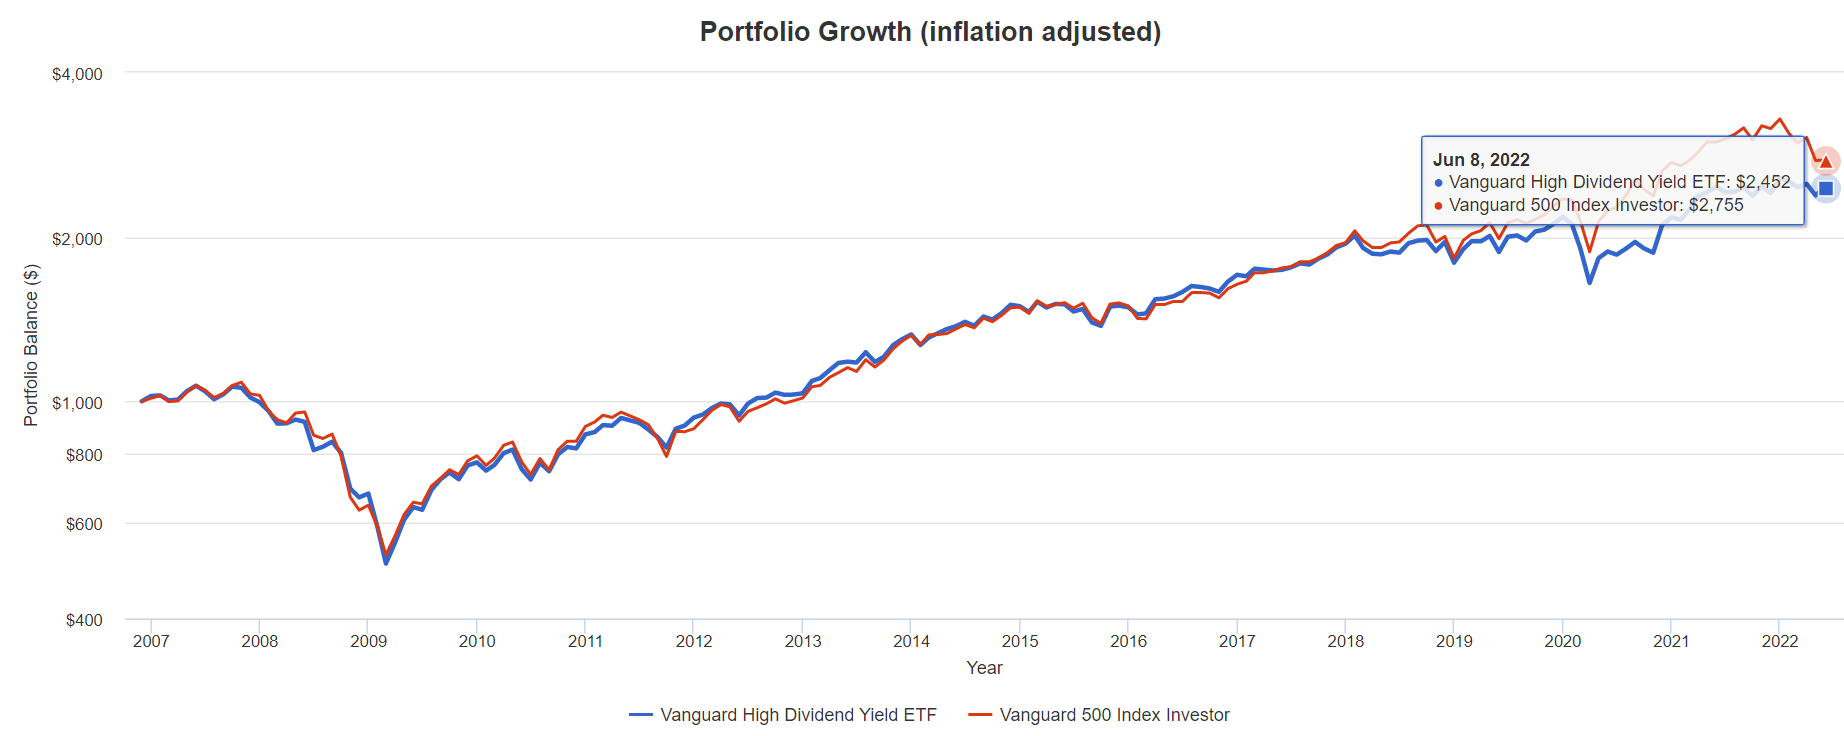
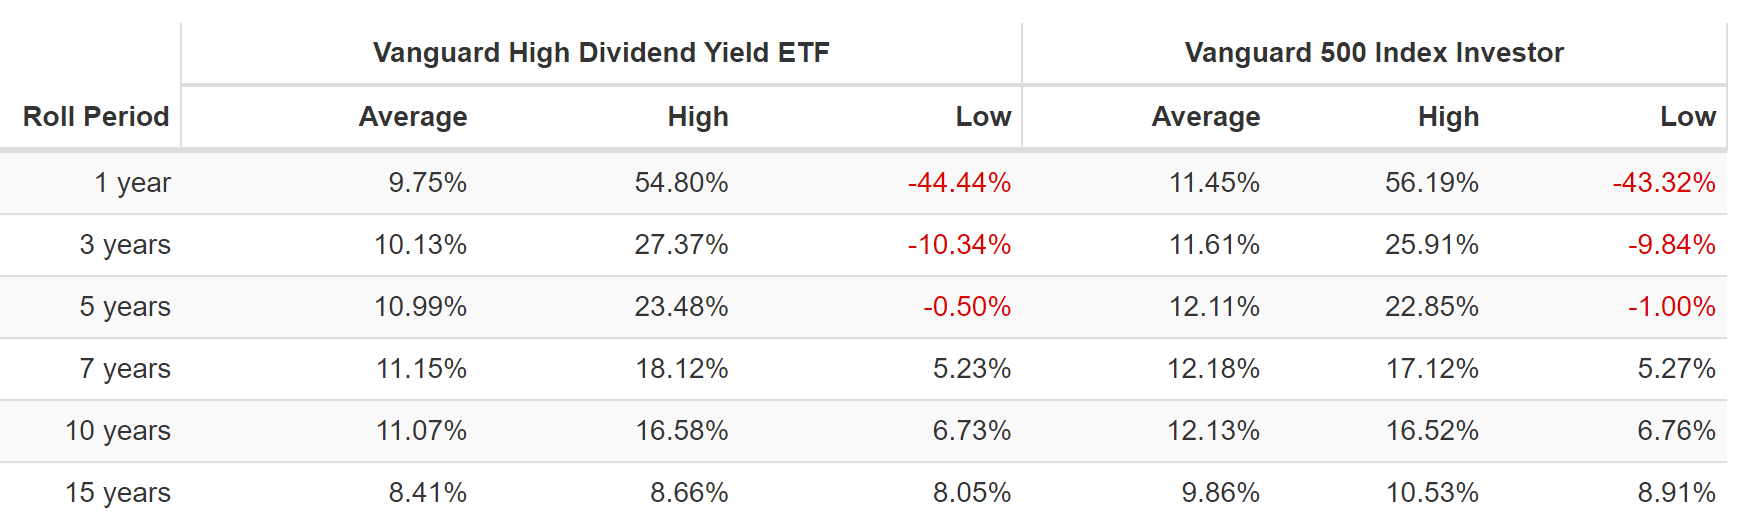
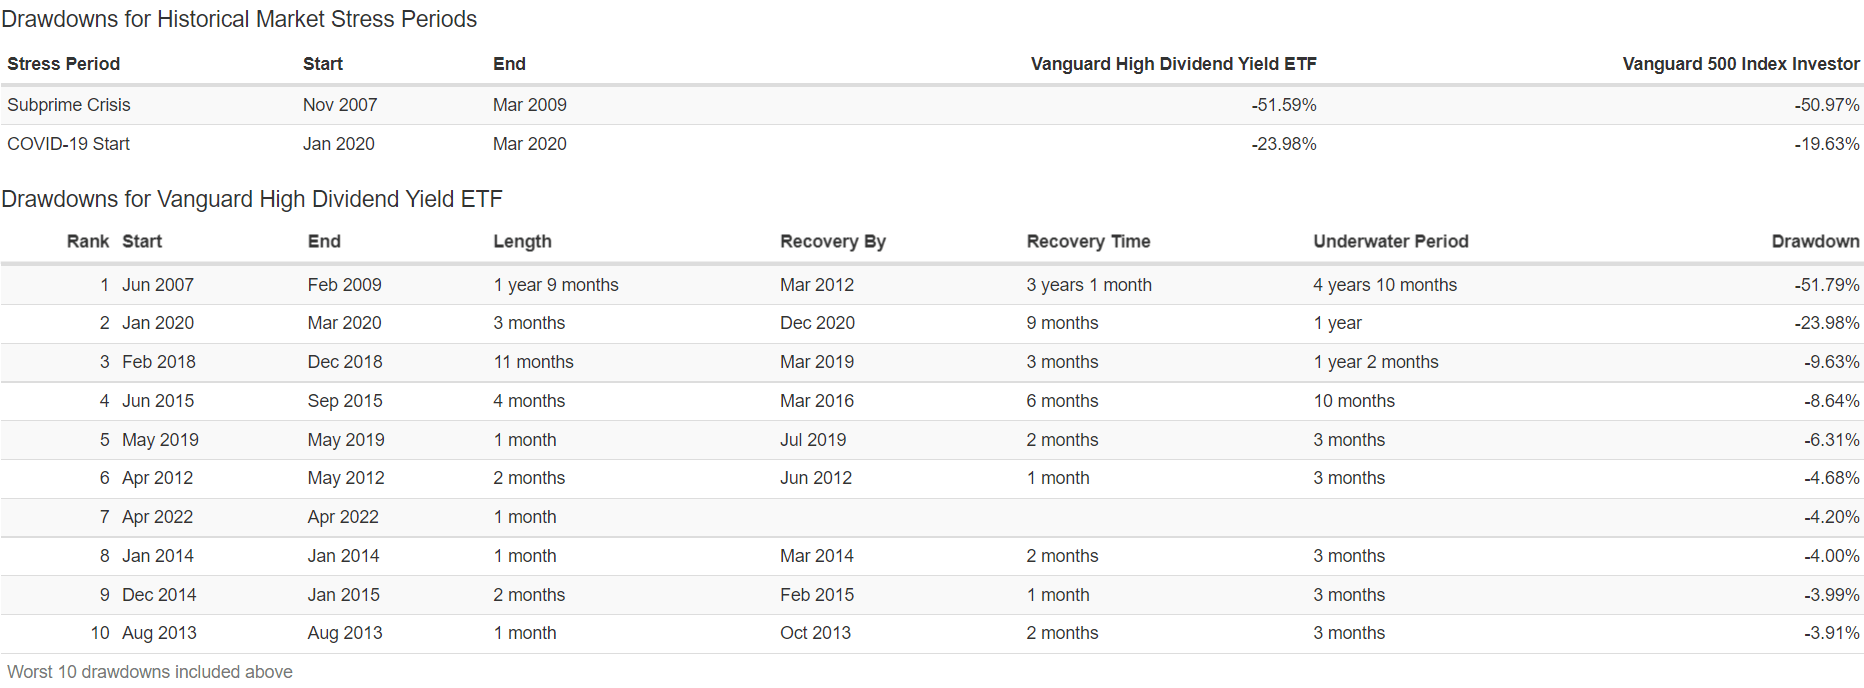
Vanguard High Dividend ETF Since December 2006
(Source: Portfolio Visualizer Premium) (Source: Portfolio Visualizer Premium) (Source: Portfolio Visualizer Premium) (Source: Portfolio Visualizer Premium) (Source: Portfolio Visualizer Premium)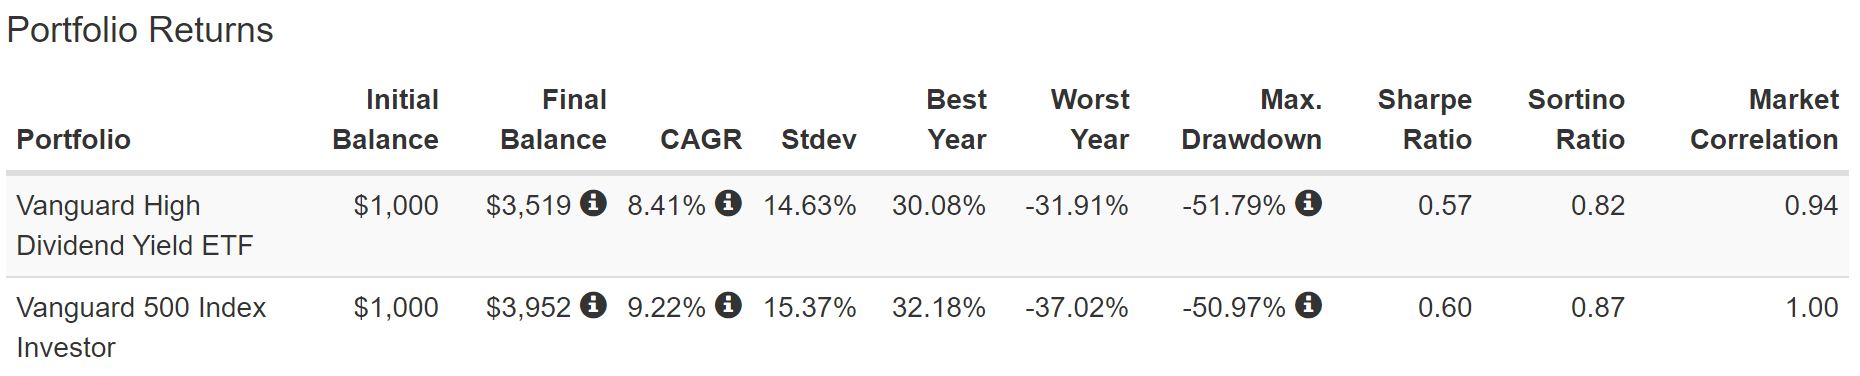
- slightly lower annual volatility to the S&P 500 (most dividend ETFs are more volatile in the last decade)
- kept up with the S&P 500 almost the entire time (until the pandemic fueled tech rally)
- but with a 1% higher yield
- average 10-year return of 11.1% (should bear the S&P 500’s 10.2% over time)
- a relatively good decline in the Pandemic (24% in March 2020 vs 20% S&P) most dividend ETFs fell far more
- fell 4.2% in April 2020 (S&P 500 -8% that month)
- 246% inflation-adjusted returns vs 276% S&P 500
- 20% Great Recession dividend cut vs 25% S&P 500
- other than the Great Recession extremely stable dividend growth over time
- including during the pandemic
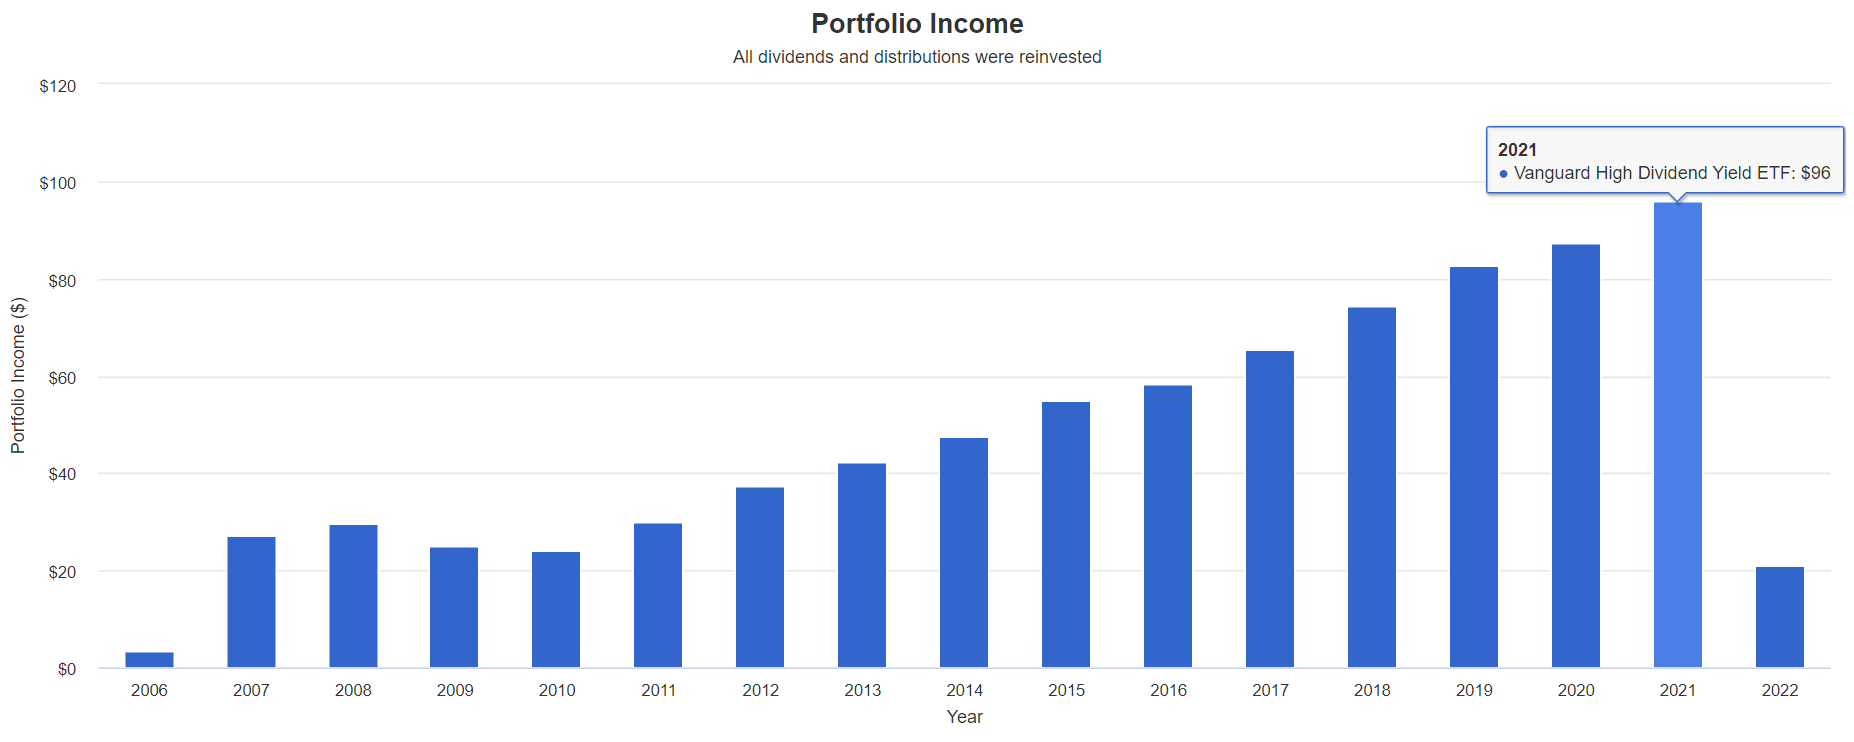
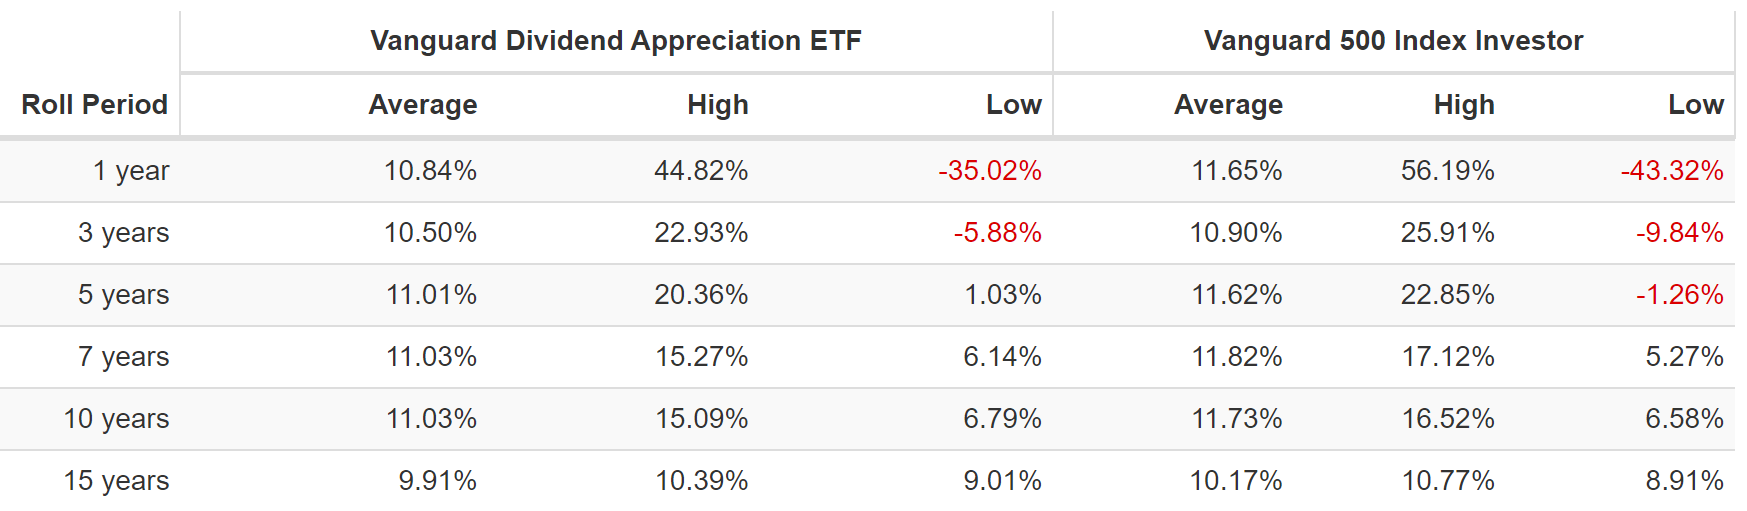
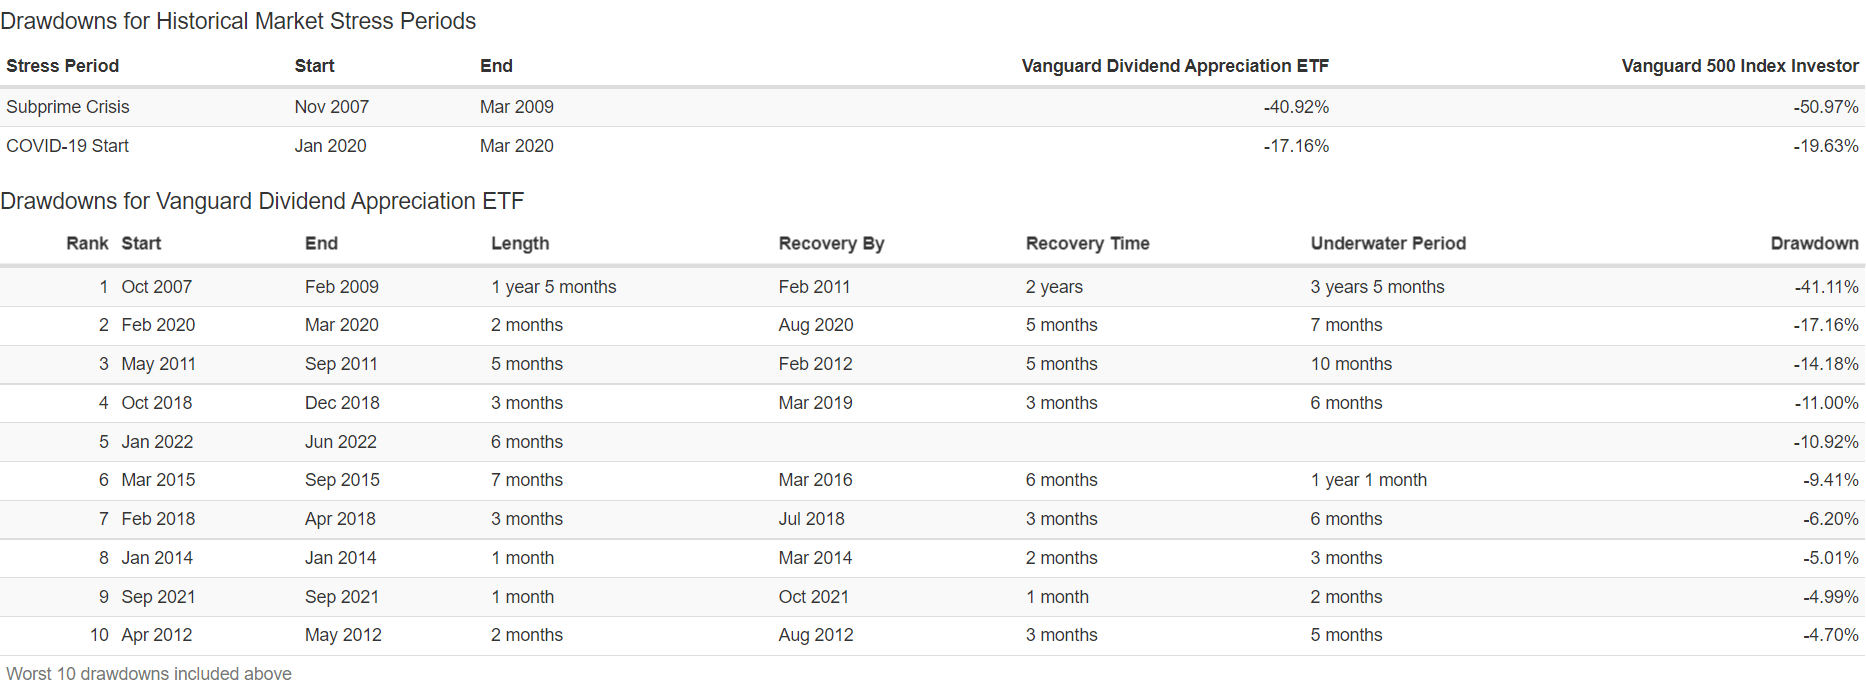
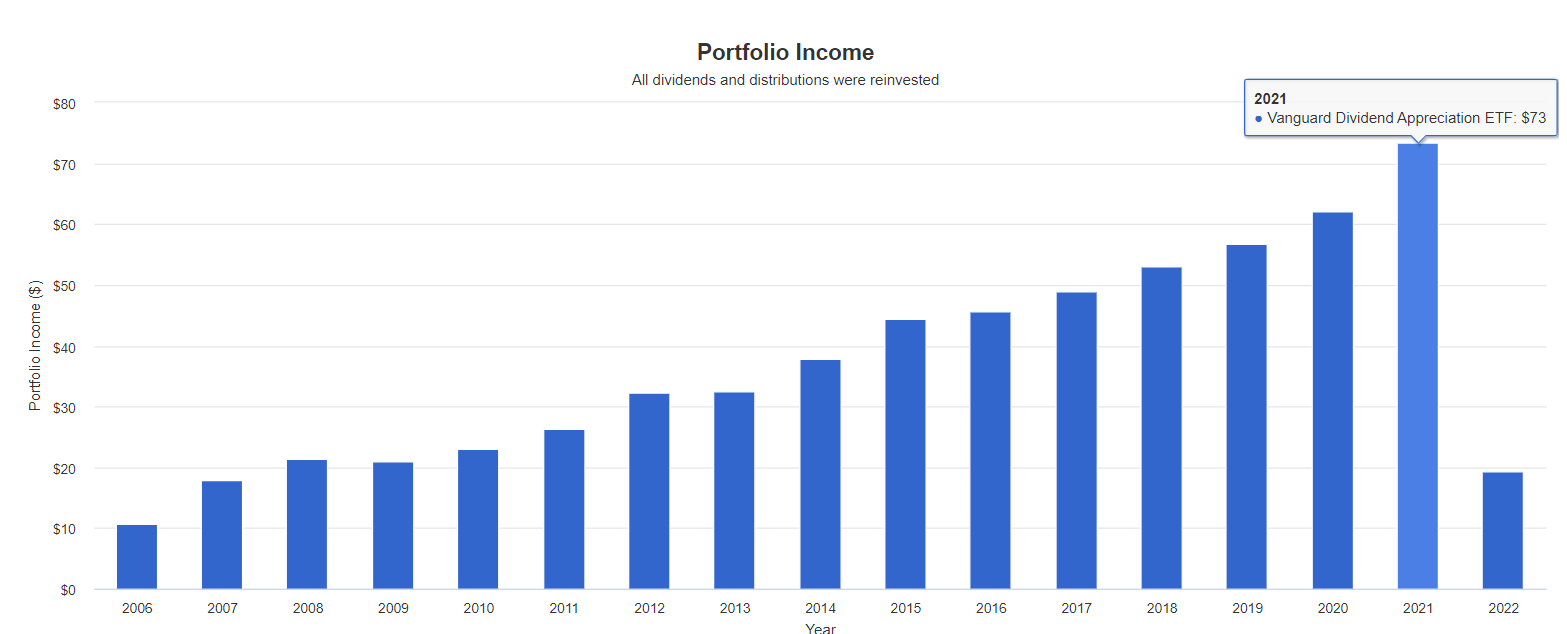
Vanguard Dividend Appreciation ETF Since June 2006
(Source: Portfolio Visualizer Premium) (Source: Portfolio Visualizer Premium) (Source: Portfolio Visualizer Premium) (Source: Portfolio Visualizer Premium) (Source: Portfolio Visualizer Premium)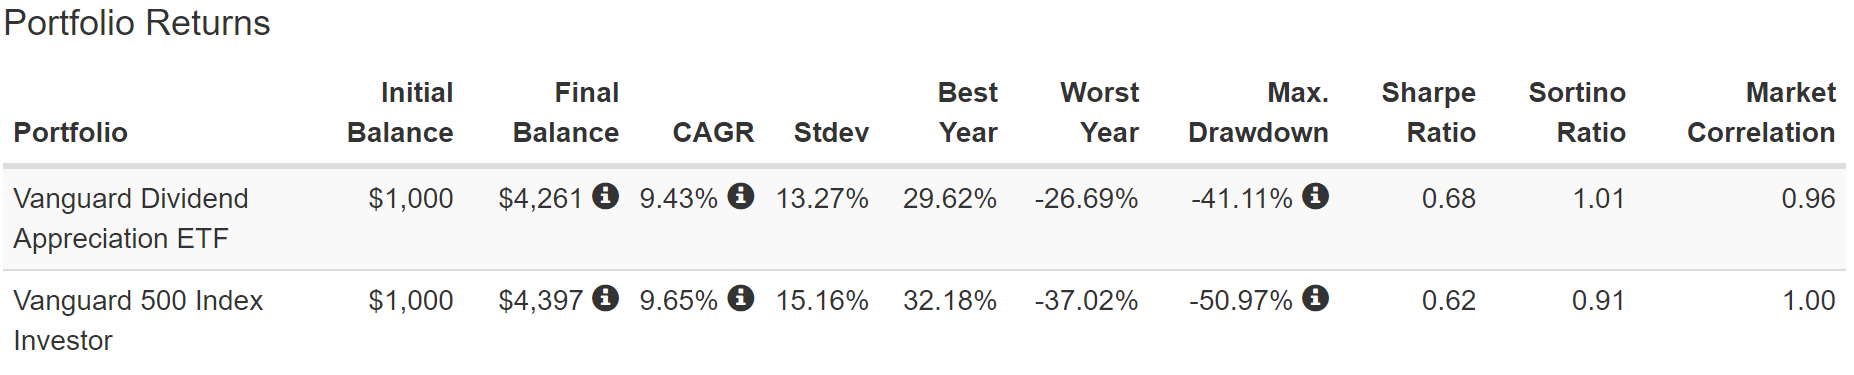
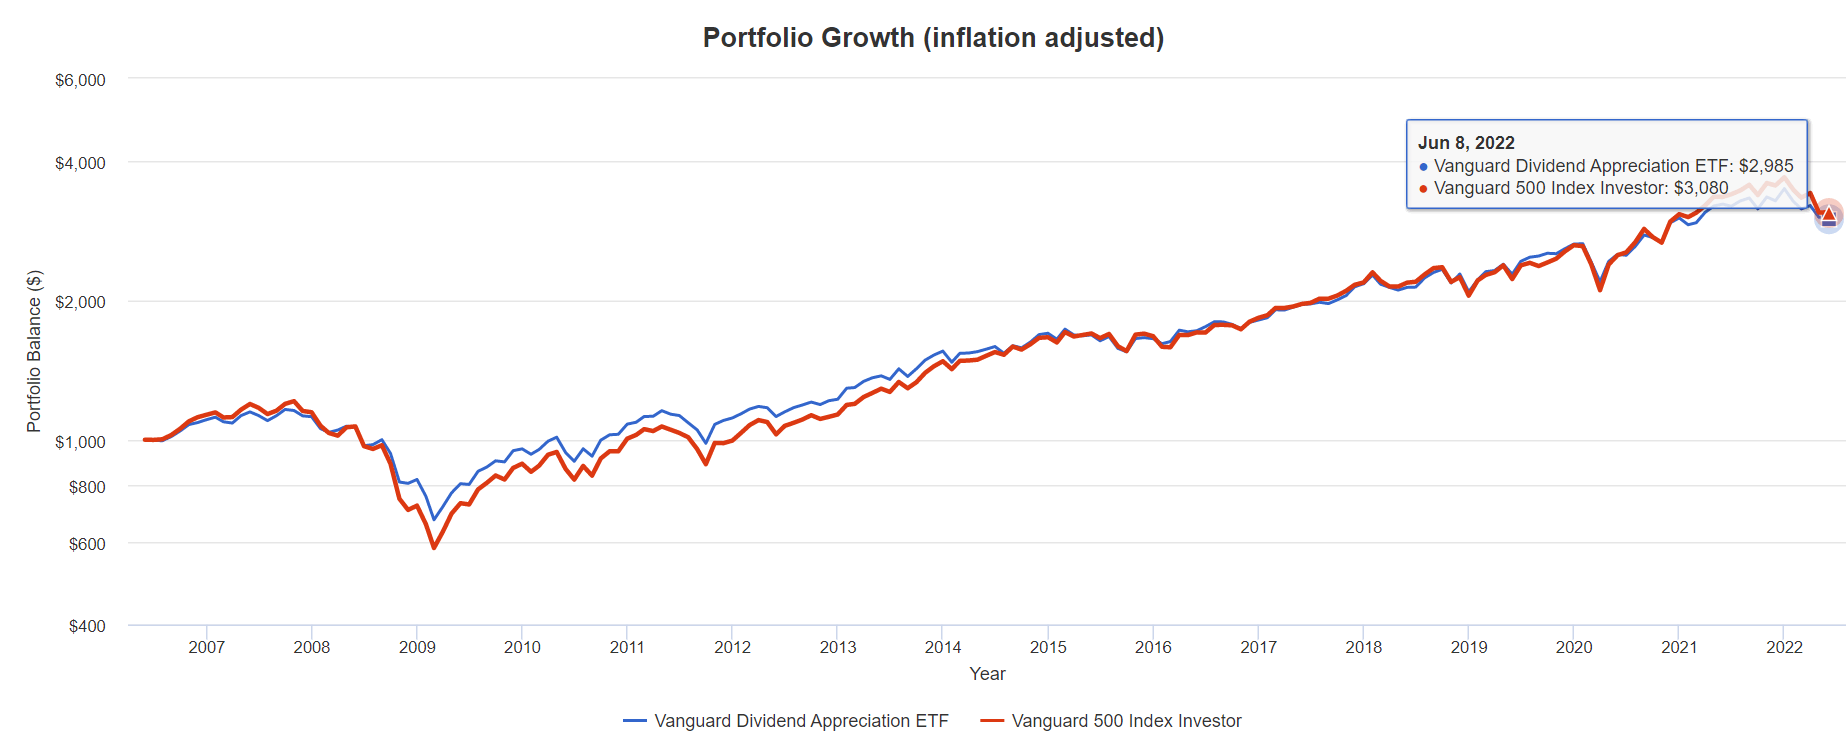
- 2% lower annual volatility to the S&P 500 (most dividend ETFs are more volatile in the last decade)
- kept up with the S&P 500 much of the time (until the pandemic fueled tech rally)
- but with a 0.2% higher yield
- average 10-year return of 11.0% (almost matched the S&P)
- a relatively good decline in the Pandemic (17% in March 2020 vs 20% S&P) most dividend ETFs fell far more
- down 11% in 2022 vs market’s 13% decline
- fell 10% less during the Great Recession
- 297% inflation-adjusted returns vs 308% S&P 500
- the MOST stable income of any dividend ETF I’ve seen
- NEVER cut its dividend (not even in the Great Recession)
- more dependable dividend growth than the aristocrats
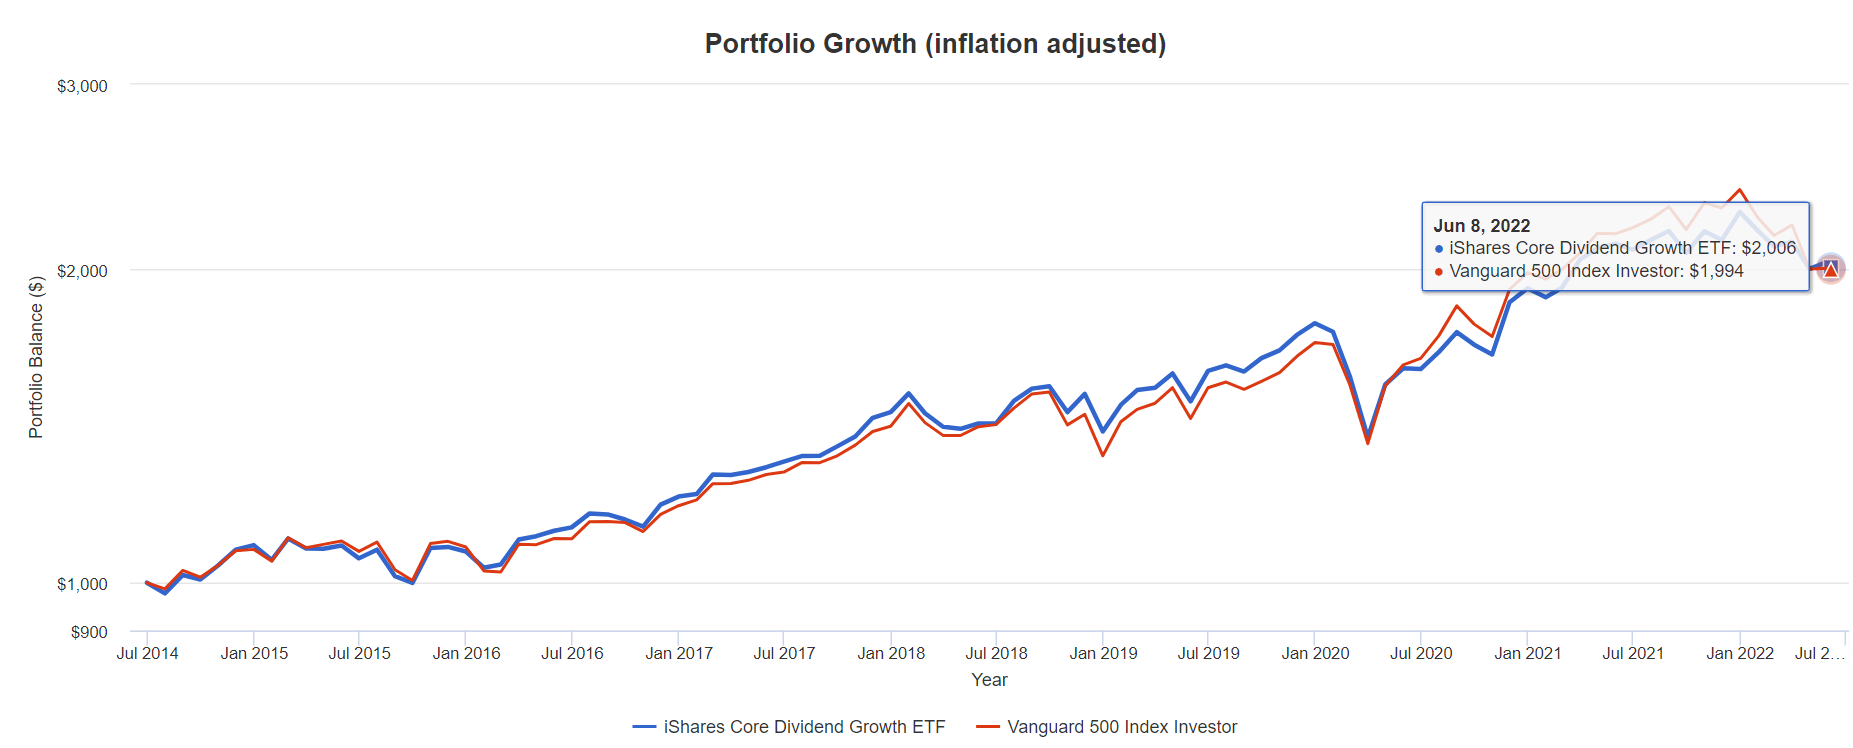
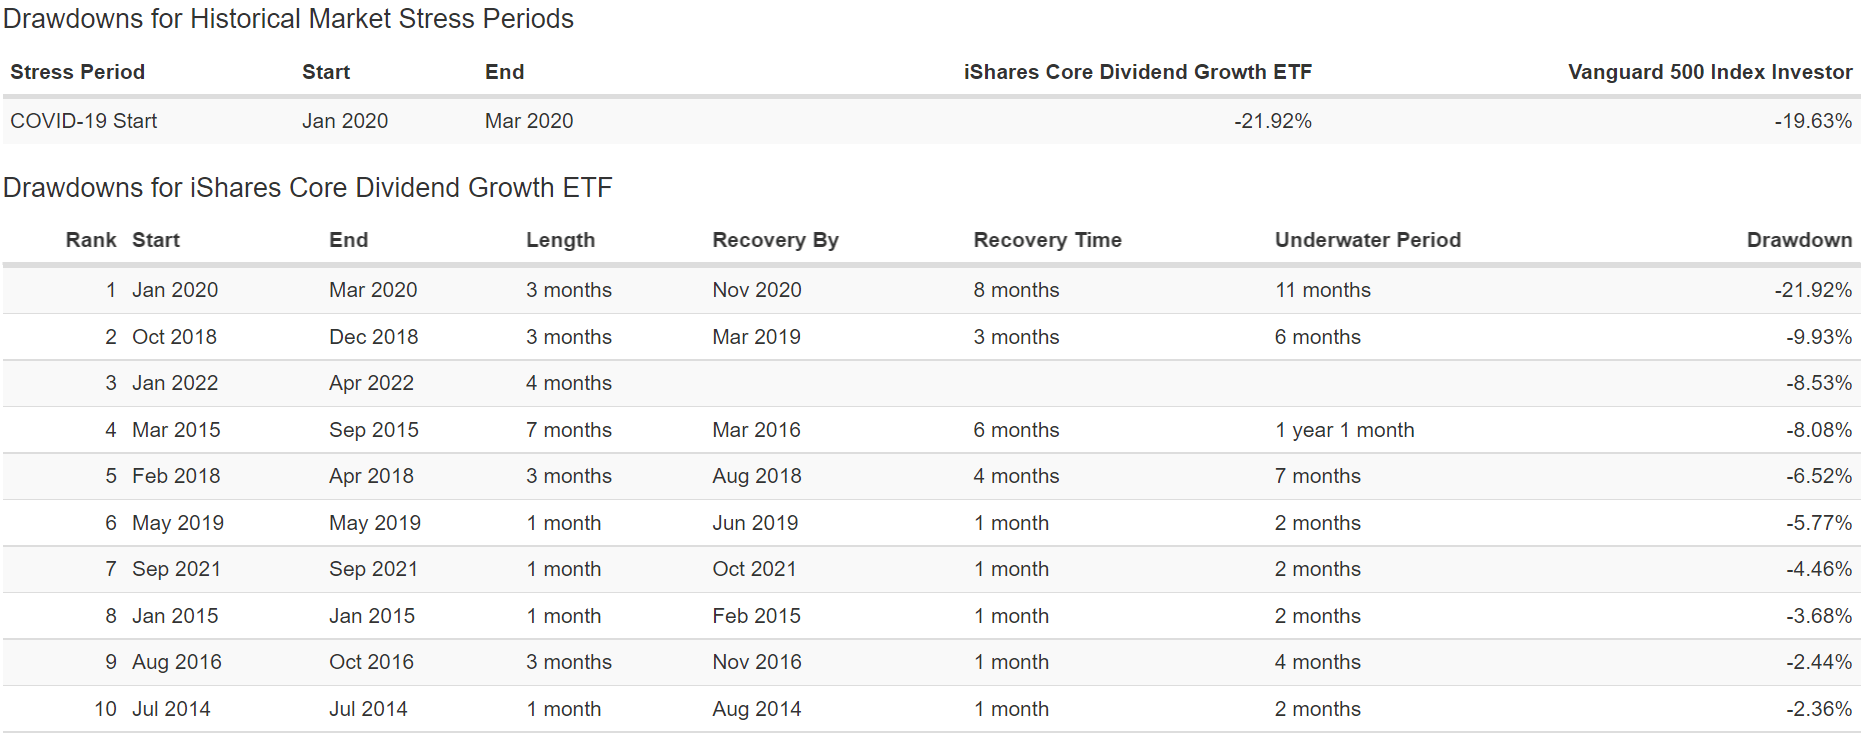
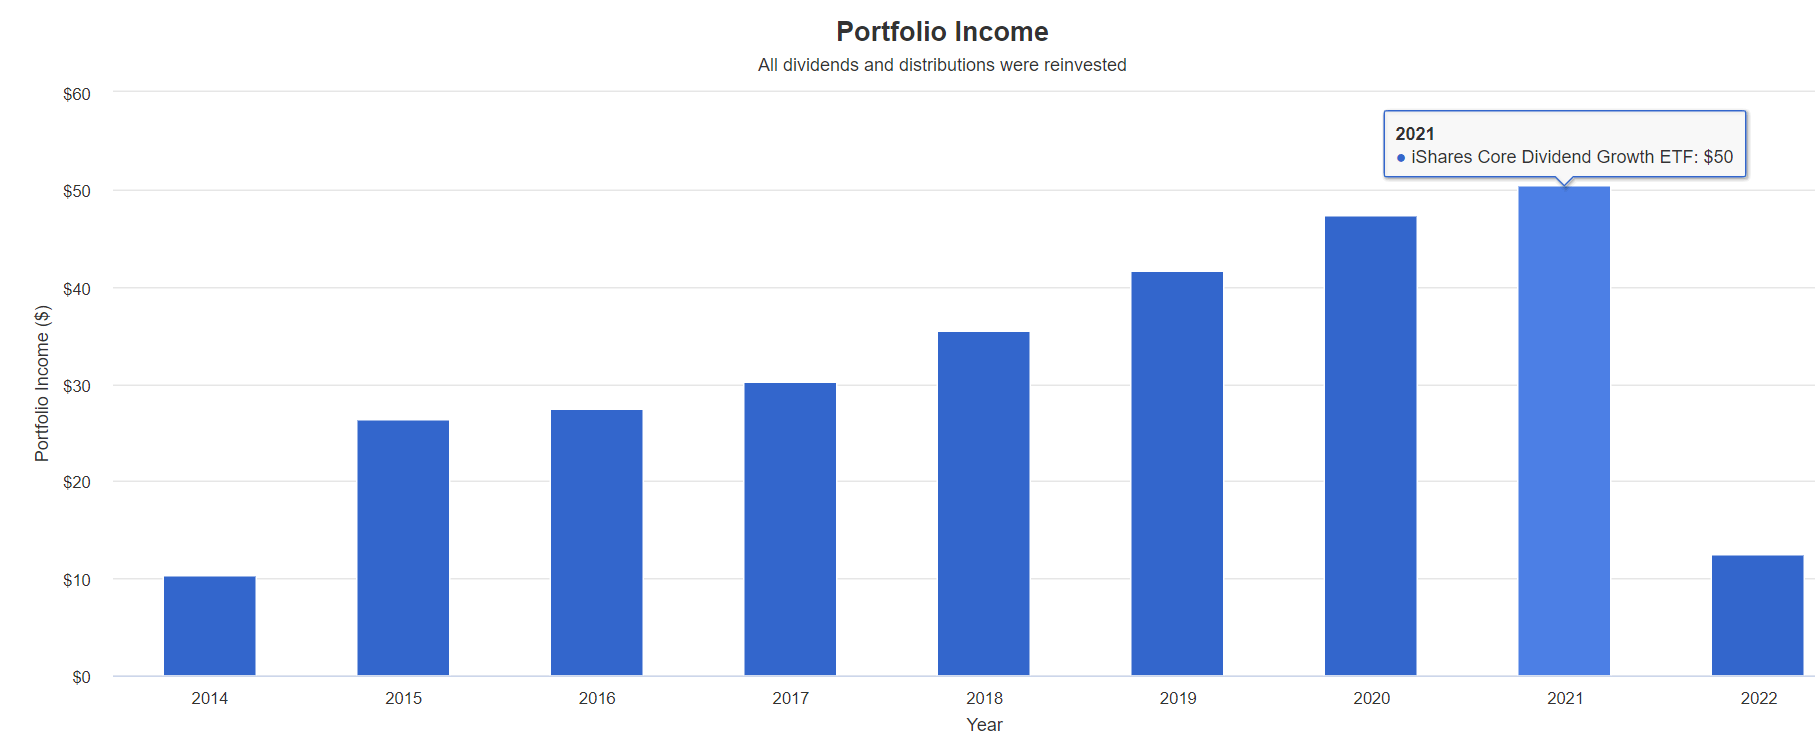
iShares Core Dividend Growth ETF Since July 2014
(Source: Portfolio Visualizer Premium) (Source: Portfolio Visualizer Premium) (Source: Portfolio Visualizer Premium) (Source: Portfolio Visualizer Premium) (Source: Portfolio Visualizer Premium)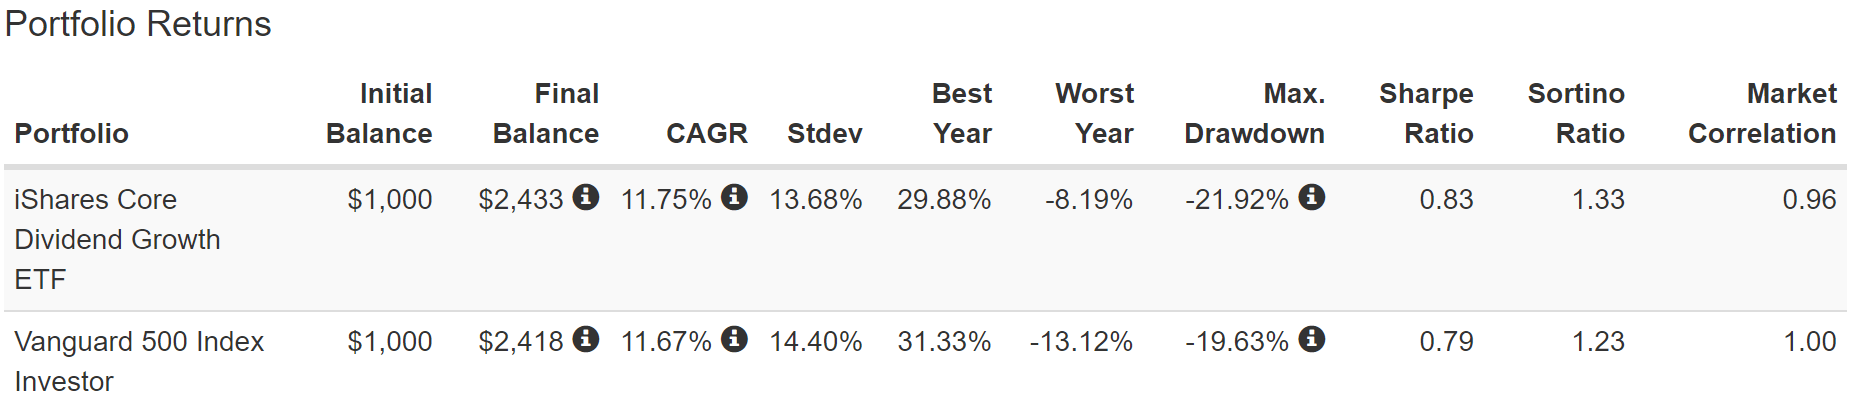
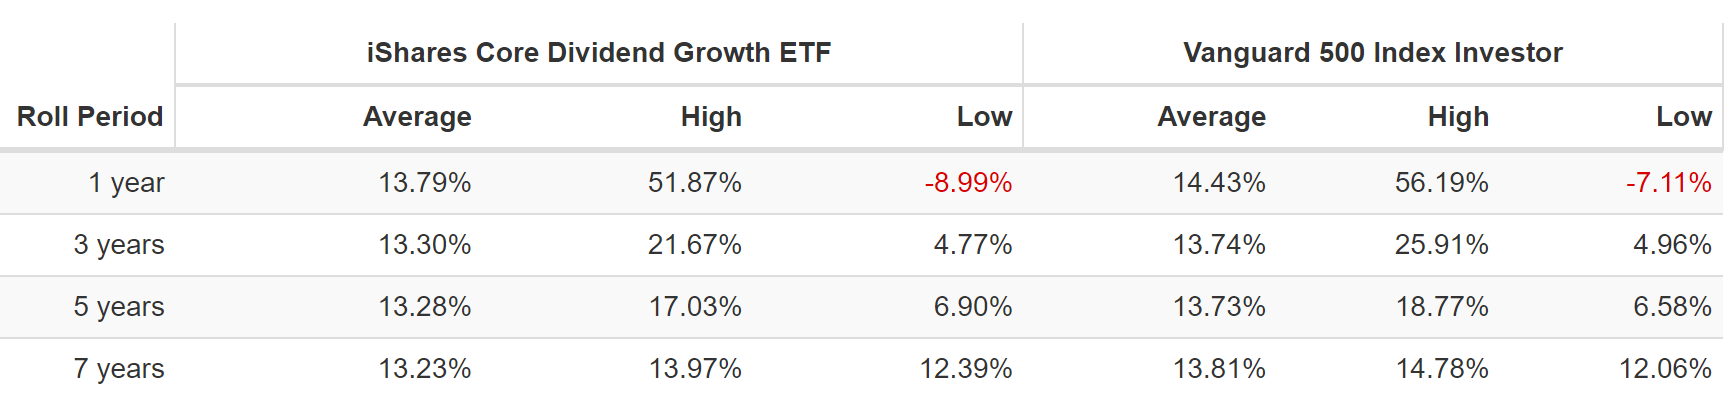
- 1% lower annual volatility to the S&P 500 (most dividend ETFs are more volatile in the last decade)
- slightly outperformed the S&P 500 much of the time (until the pandemic fueled tech rally)
- but with a 0.4% higher yield
- average 1-year return of 13.8% (nearly matched the S&P)
- a relatively good decline in the Pandemic (22% in March 2020 vs 20% S&P) most dividend ETFs fell far more
- down 8.5% in 2022 vs market’s 13% decline
- 101% inflation-adjusted returns vs 99% S&P 500
- extremely stable and growing income over time (growth rates are variable)
Ok, so we have four ETFs with impeccable fundamentals and solid track records of good returns and steady dividend growth over time.
But what about the future?
Stress Testing The Future (Only For ETFs With 10+ Year Histories)
Historical backtesting is great but we need to know what kind of returns and volatility are likely in the future.
- In the last 15 years, we’ve suffered 2 of the worst economic catastrophes since the Great Depression
- 3 major bear markets
- including the 3rd worst market crash in US history
- inflation ranging from -2.5% to 8.5%
- interest rates ranging from 0.3% to 4.0%
In other words, the last 15 years were so extreme, that it creates a good statistical data source for stress testing for the next 75 years.
- barring recessions and bear markets worse than the Great Recession or Pandemic this analysis is likely to be highly accurate
Here I’m stress testing every ETF with a 10+ year track record.
- 90% statistical significance with that time frame
75-Year Monte Carlo Simulation: Stress Testing Your Portfolio So You Can Sleep Well At Night
- 5,000 simulations
- post-tax earnings (highest tax bracket) for conservatism
- 4% withdrawals- (though can test various withdrawal rates)
- you can also stress test what happens if we get a lost decade at the start of the 75 year period
- starting value $510K average retired couples savings
Schwab U.S. Dividend ETF
(Source: Portfolio Visualizer Premium)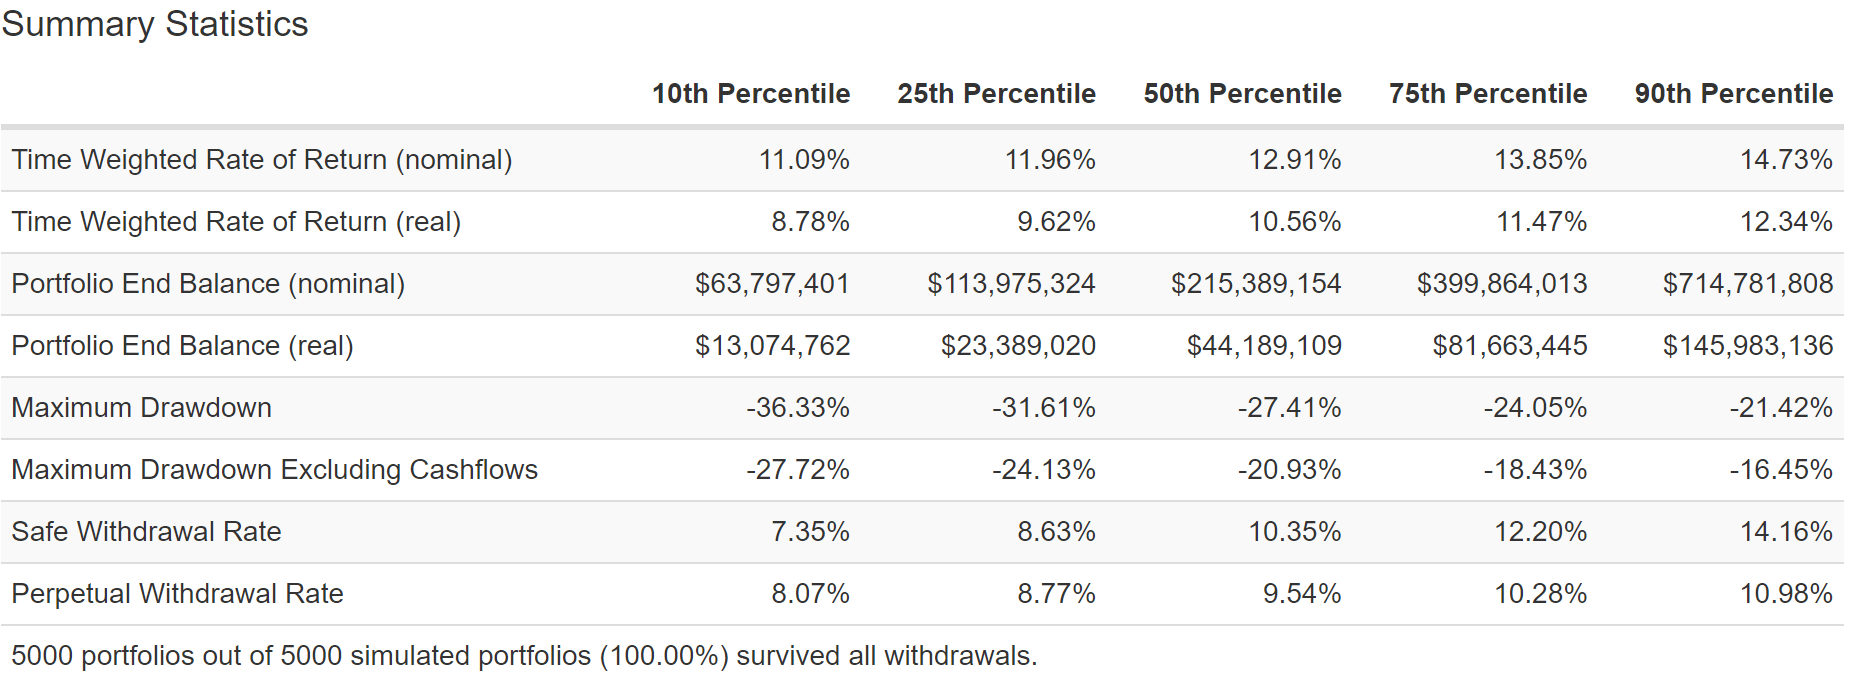
Note the peak declines are likely to be higher in the worst-case scenario (unless we avoid another 50+% market crash over the next 75 years).
SCHD’s strong returns and steadily growing 3% yield makes for potentially the highest safe withdrawal rates over time.
Vanguard High Dividend ETF
(Source: Portfolio Visualizer Premium)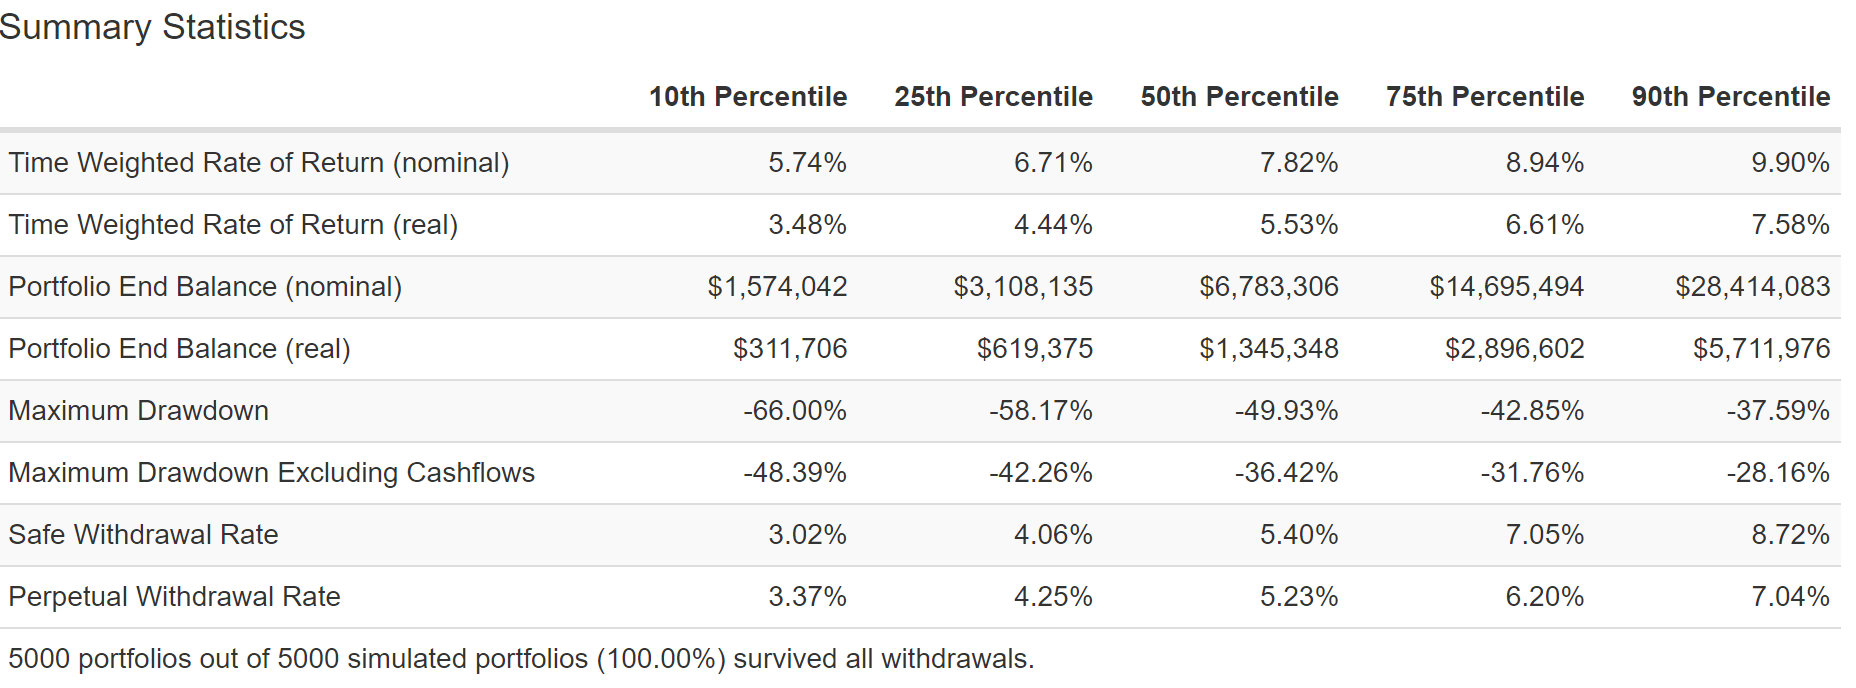
VYM should be able to sustain 4% to 6% annual withdrawal rates compared to 2.5% for a 60/40 (FactSet consensus).
Vanguard Dividend Appreciation ETF
(Source: Portfolio Visualizer Premium)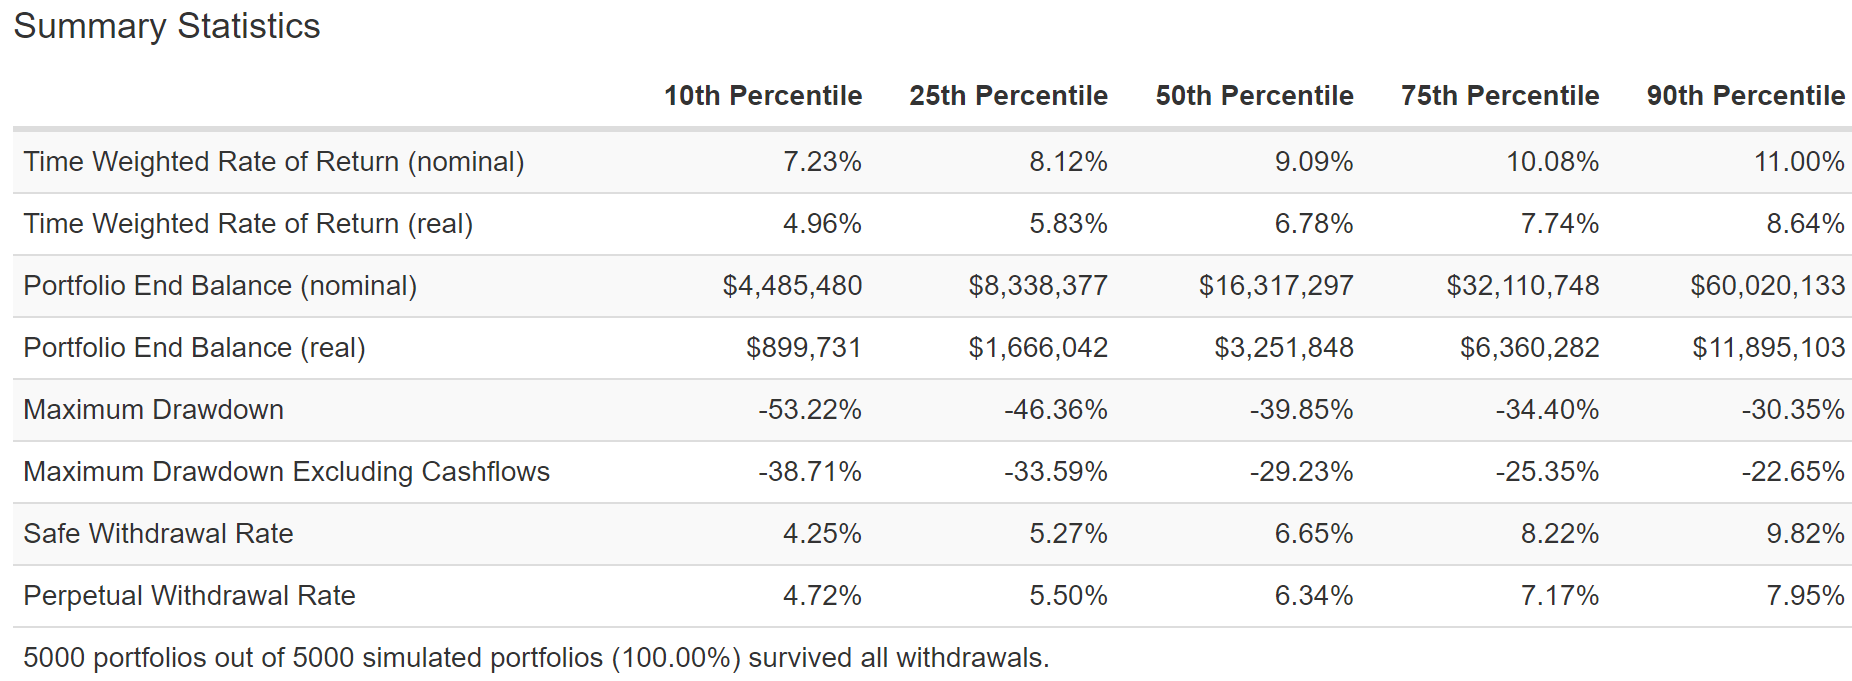
VIG is 90% likely to be able to sustain a 4% to 7% annual withdrawal rate (5% to 6.5% most likely) and is 90% statistically likely to never fall more than 39% in the next 75 years.
But if you really want to be 90% confident that a portfolio is right for you, stress testing the doomsday scenario is a prudent and reasonable strategy.
75-Year Monte Carlo Simulation: Great Depression 2.0 Worst-Case Scenario
This isn’t just a stress test, it’s a doomsday scenario tester for any portfolio.
- not just a lost decade for stocks
- literally the worst years of returns over 75 years…packed together, back to back, in the first 10 years
This is equivalent to another Great Depression.
- Goldman Sachs puts the probability of this scenario (triggered by nuclear war with Russia) at approximately 2.5%
S&P 500 Great Depression 2.0 Worst-Case Scenario
(Source: Portfolio Visualizer Premium)
Nasdaq Great Depression 2.0 Worst-Case Scenario
(Source: Portfolio Visualizer Premium)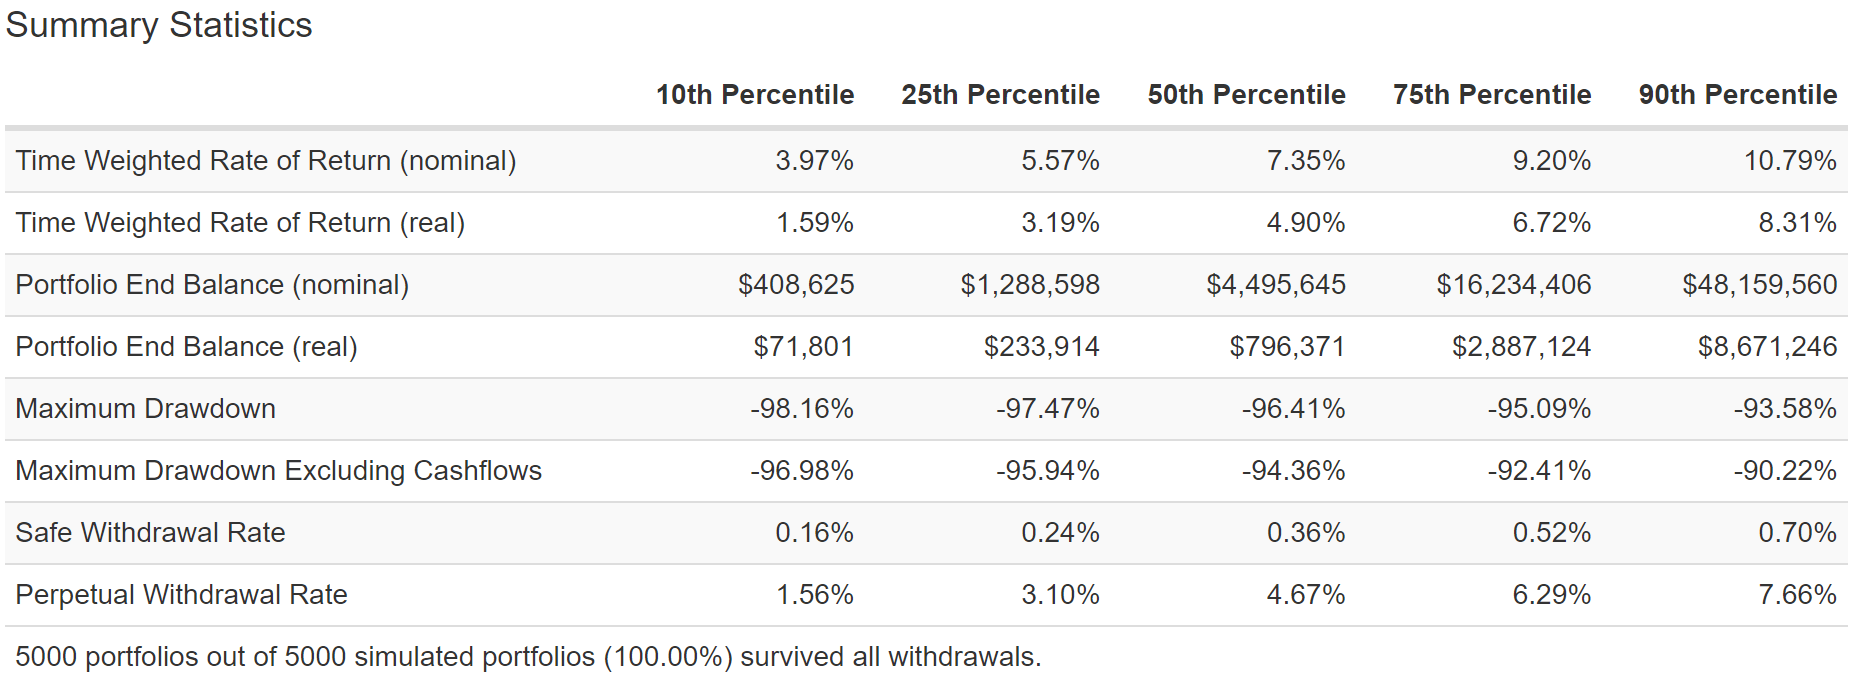
In the worst-case scenario, of another Great Depression, there is a 10% chance that the S&P 500 falls as much as 81%.
The Nasdaq could crash as much as 97%.
60/40 Great Depression 2.0 Worst-Case Scenario
(Source: Portfolio Visualizer Premium)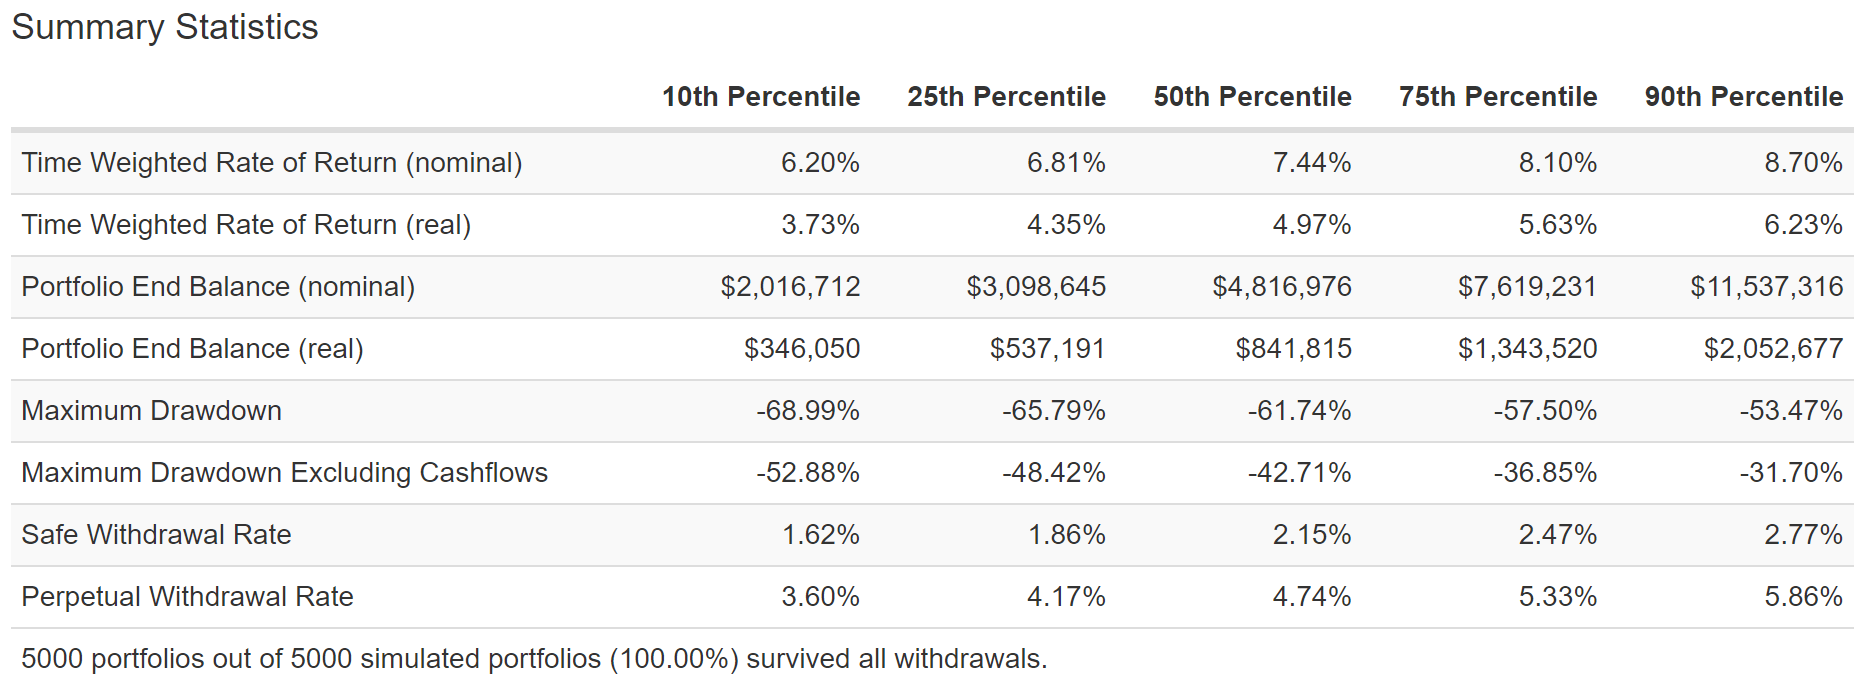
A 60/40, worst-case, during another Great Depression, has a 10% probability of falling 53%.
- compared to an 81% decline in the S&P 500
- and 97% decline in the Nasdaq
How about these dividend ETFs?
Schwab U.S. Dividend ETF
(Source: Portfolio Visualizer Premium)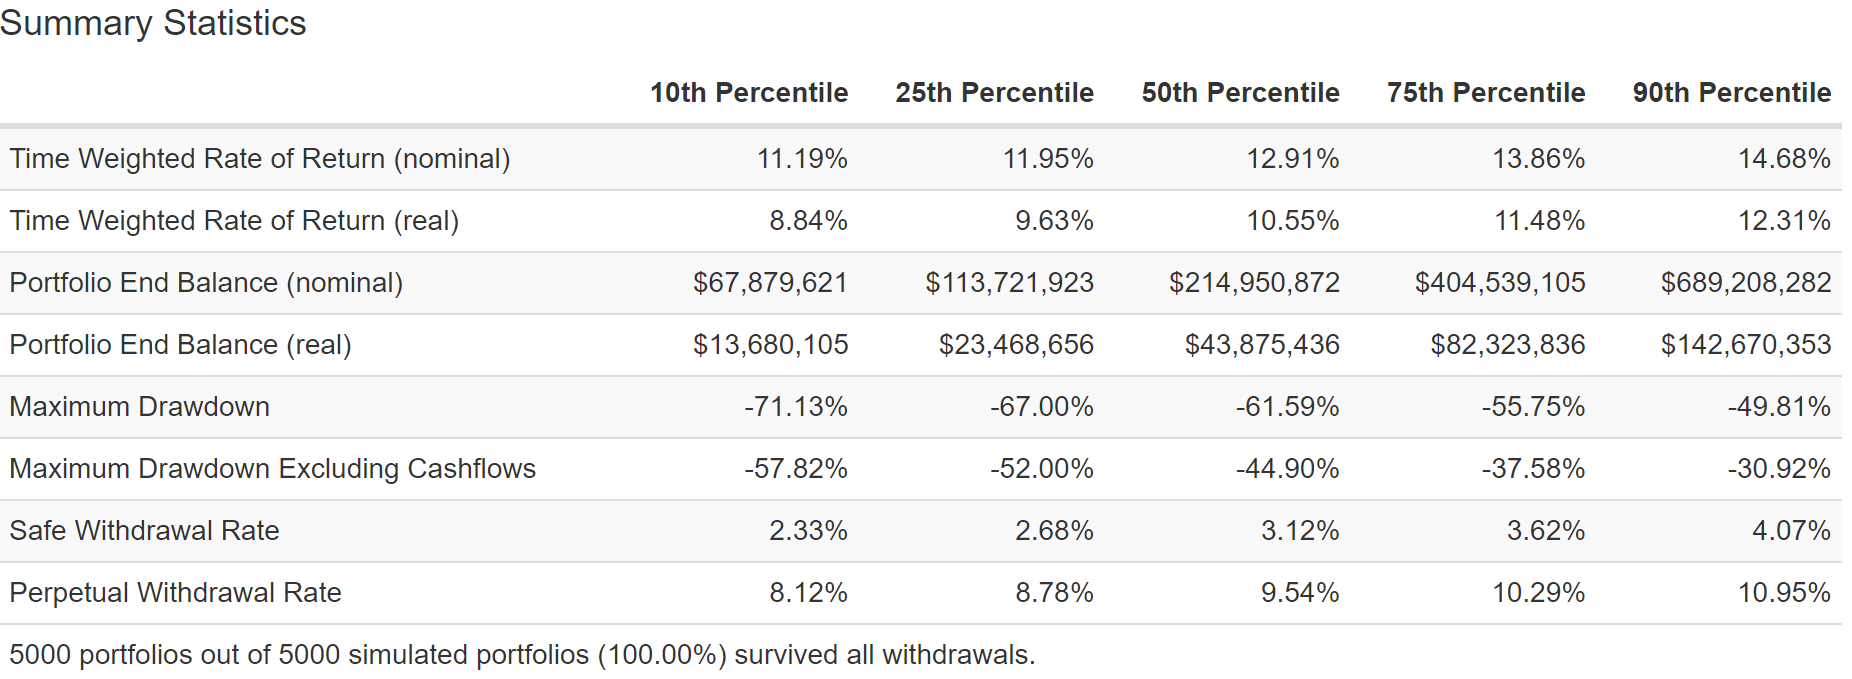
In a worst-case scenario SCHD still falls a lot less than the market and maintains a safe withdrawal rate of 2.3% (vs S&P 500’s 1.0%).
Vanguard High Dividend ETF
(Source: Portfolio Visualizer Premium)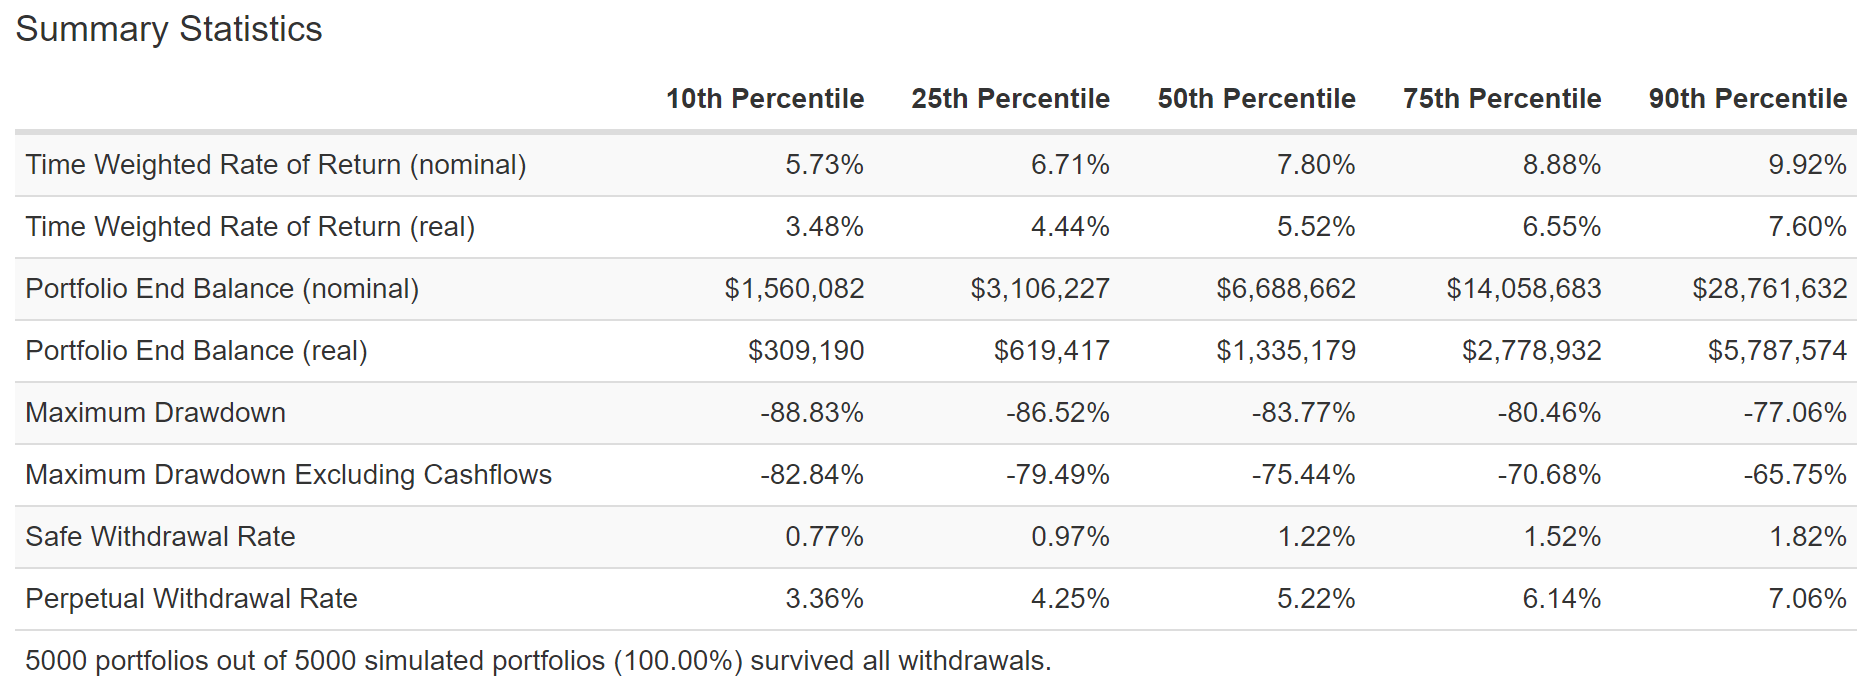
In the worst-case scenario, VYM falls slightly more than the market and its safe withdrawal rate is 0.8% vs the S&P 500’s 1.0%.
Vanguard Dividend Appreciation ETF (VIG)
(Source: Portfolio Visualizer Premium)
In the worst-case scenario, VIG falls about 6% less than the S&P 500 and has a 1.2% safe annual withdrawal rate vs 1.0% for the S&P 500.
Bottom Line: The Right Dividend ETFs Can Help You Retire In Safety And Splendor
Combining the world’s best blue-chips with the world’s best ETFs is the easiest way to achieve a diversified and prudently risk-managed portfolio that’s optimal for your specific goals and time horizon.
But just as you can’t just randomly pick stocks and expect to do well, selecting the right ETFs also requires a careful examination of not just fundamentals and valuations, but also historical returns.
- to make sure that reality matches with the theoretical potential of a portfolio
SCHD, VYM, VIG, and DGRO are my four favorite dividend growth ETFs because of their:
- the sound stock selection process
- focus on the world’s best blue-chips (including numerous wide-moat dividend champions, aristocrats, and Ultra SWANs)
- reasonable valuations
- historically good to excellent returns
- a good to exceptional track record of steady income growth in all economic and market conditions
When combined with a prudent allocation of cash, bonds, and blue-chips, these are four ETFs you can trust to help you retire rich, and stay rich in retirement.
Why am I so confident in these ETFs? Because we’ve stress-tested them against some of the most extreme economic and market conditions in US history.
We’ve also stress-tested them to hell and back, against a literal doomsday worst-case Great Depression 2.0 scenario that Goldman Sachs thinks is a 2.5% probability scenario.
This is why I can say with 90% statistical confidence that:
- if you trust SCHD, VYM, VIG, and DGRO with your hard-earned savings
- as part of a diversified and prudently risk-managed portfolio
- and own them for the long-term
- you are likely to be pleased with the results in 5+ years
In fact, when you boost the fundamentals of these ETFs with the world’s best blue-chips, that’s the easiest way to achieve life-changing investing returns.
All while minimizing the risk of catastrophic and permanent losses of your money.
Or to put it another way, by carefully selecting every asset your portfolio owns, focusing on safety and quality first, and prudent valuation and sound risk-management always, you can stop praying for luck and start making your own.
“Luck is what happens when preparation meets opportunity.” – Roman Philosopher Seneca the Younger
Be the first to comment