

RgStudio/E+ via Getty Images
It’s the worst first half of the year since 1970 for the stock market, and investors are terrified of inflation, recession, and continued price declines.
Daily Shot 
Wall Street runs on probabilities, not certainties. But there are two certainties that underpin almost all of finance.
- diversification and portfolio risk management
- stocks go up over time
Charlie Bilello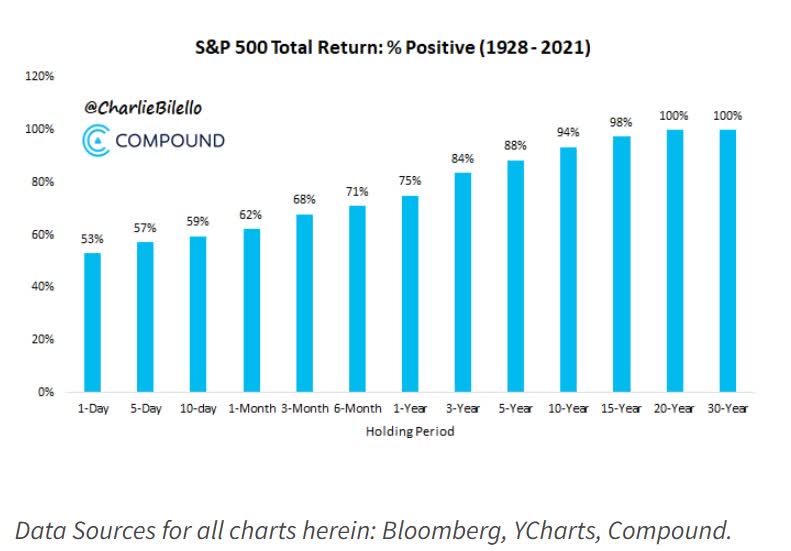
Even periods of high inflation and the worst depressions can’t stop stocks from delivering positive long-term returns.
Charlie Bilello
Naturally, we’d all love to be able to time the market and just sit in cash during periods of market terror, and buy in at the bottom.
Dalbar
For example, over the last 20 years, sitting out the market’s worst 40 days, just 2 days per year, would have more than doubled annual returns to a Buffett-like 23% per year. That’s theoretically 10X better returns, from perfect market timing.
But here’s how market timing actually works.
The Realty Of Market Timing: Great In Theory…And Nowhere Else
Dalbar 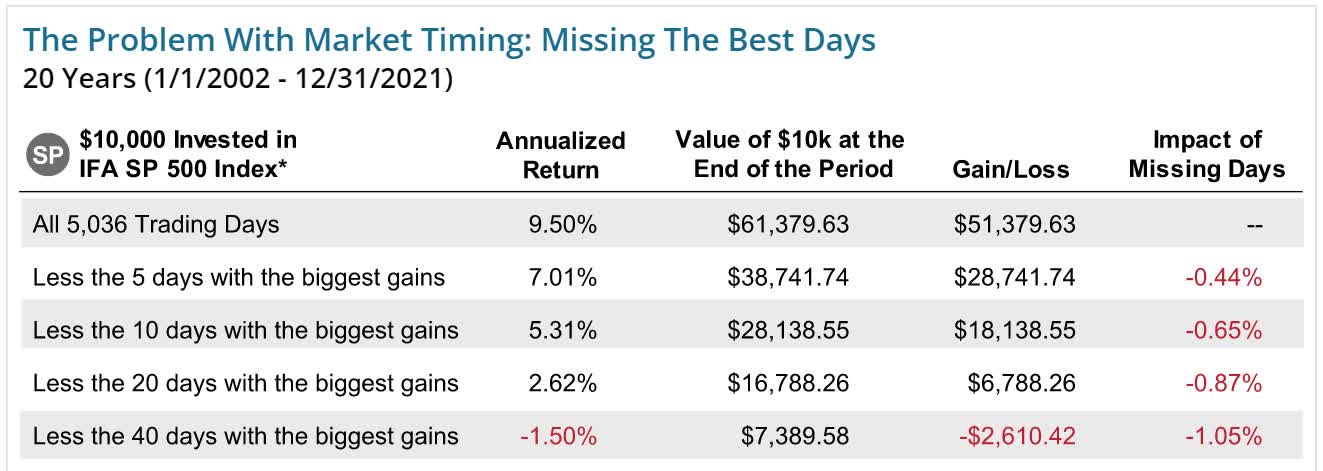
Missing just 2 of the best days of each year for the last two decades turned a 9.5% annual return into a 1.5% annual loss. Instead of making 411% returns, unsuccessful market timers would have lost 26% of their money.
- -56% adjusted for inflation
What about the modern era? According to a new study from Citigroup, over the last 10 years, including the current bear market, the S&P delivered 16% annual returns or a 341% total return.
Guess what missing just 2 of the best single days each year turned that into?
- 10%…not per year, but 10% in total
- a 97% reduction in returns
- -20% adjusted for inflation
- during one of the best bull markets in US history
What about over the long-term?
- According to Bank of America over the last 90 years, the S&P 500’s inflation-adjusted returns are 1,150X
- miss just the best 10 days of each decade (the best day per year on average) and it’s -94%
JPMorgan Asset Management 
And guess what? Reality matches the studies. The average investor achieved 62% lower returns than buying and holding the market. Why? All due to market timing.
- according to Fidelity, 98% of market timers fail to make money
If you think hiding in cash in a bear market is an option, you are sadly mistaken. And if you try it, you are 98% likely to regret it.
In fact, market timing is the most dangerous thing long-term investors can do, the #1 reason (behind insufficient savings) for failing to achieve your long-term financial goals. In other words, time in the market is essential, while market timing is a nearly guaranteed road to financial ruin.
But with the S&P potentially set to fall another 25% (to a -40% peak decline) how can you stay safe and sane in the face of market panic?
| Time Frame | Historically Average Bear Market Bottom |
| Non-Recessionary Bear Markets Since 1965 | -21% (Achieved May 20th) |
| Median Recessionary Bear Market Since WWII | -24% (Citigroup base case with a mild recession) June 16th |
| Non-Recessionary Bear Markets Since 1928 | -26% (Goldman Sachs base case with a mild recession) |
| Average Bear Markets Since WWII | -30% (Morgan Stanley base case) |
| Recessionary Bear Markets Since 1965 | -36% (Bank of America recessionary base case) |
| All 140 Bear Markets Since 1792 | -37% |
| Average Recessionary Bear Market Since 1928 |
-40% (Deutsche Bank, Bridgewater, SocGen Severe Recessionary base case, Morgan Stanley Recessionary Base Case) |
|
(Sources: Ben Carlson, Bank of America, Oxford Economics, Goldman Sachs) |
The answer could be low volatility, high-yield dividend aristocrats, which pay you very safe, generous, and steadily rising dividends, in all economic and market conditions.
All while creating a low volatility portfolio that lets you sleep well at night, and avoid the catastrophic temptation to time the market.
Volatility caused by money managers who speculate irrationality with huge sums will offer the true investor more chance to make intelligent investment moves. He can be hurt by such volatility only if he is forced, by either financial or psychological pressures, to sell at untoward times.” -Warren Buffett
In other words, high-yield, low volatility aristocrats can be the ideal bear market solution to avoiding become a forced seller for emotional or financial reasons.
How do you find such bear market dream stocks?
That’s what this article is all about.
4 High-Yield Dividend Aristocrat Bear Market Dream Stocks
Using the Dividend Kings Zen Research Terminal, here’s how I found these companies in 2 minutes.
- dividend champions list (every company, including foreign, with 25+ year dividend growth streaks)
- good buys or better
- 3+% yield
- 10+% long-term consensus total return potential (matching the S&P 500)
- sorted by 15-year average annual volatility
- selected the four lowest volatility names in each sector
Dividend Kings Zen Research Terminal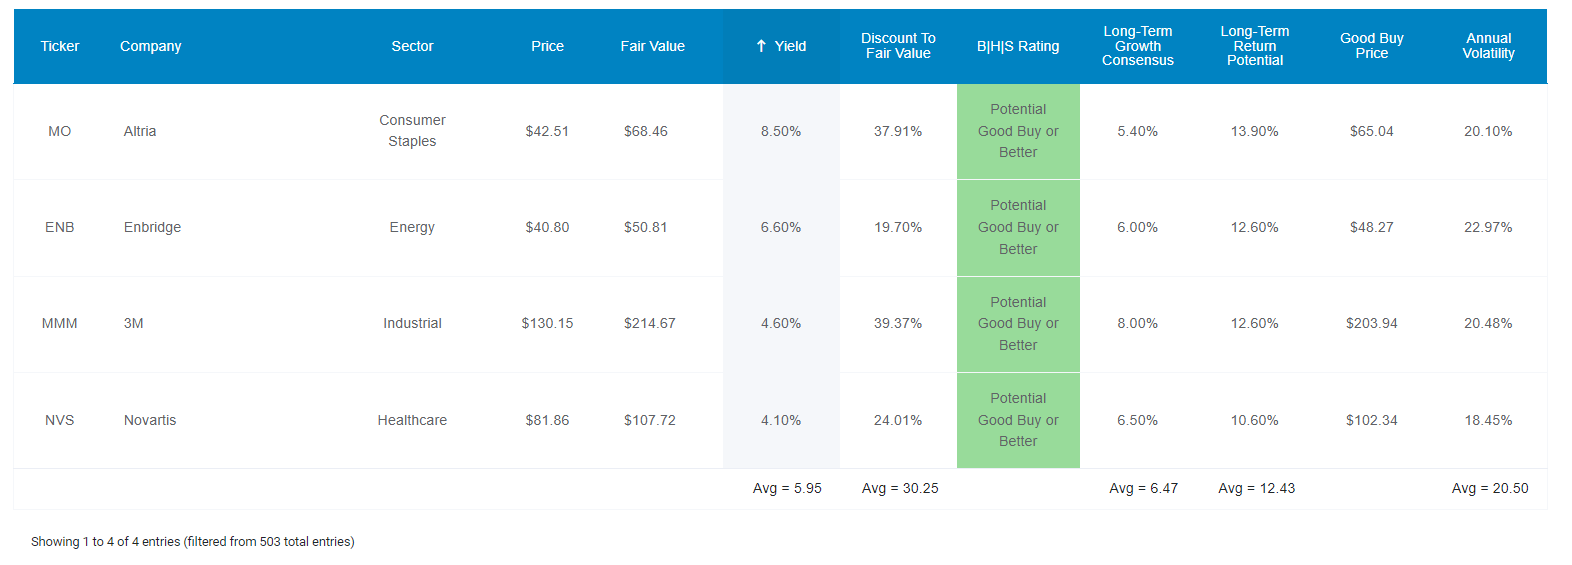
I’ve linked to deep-dive articles that explore each company’s investment thesis, risk profile, growth potential, valuation and return potential in detail.
FAST Graphs Upfront
Altria 2024 Consensus Total Return Potential
(Source: FAST Graphs, FactSet Research)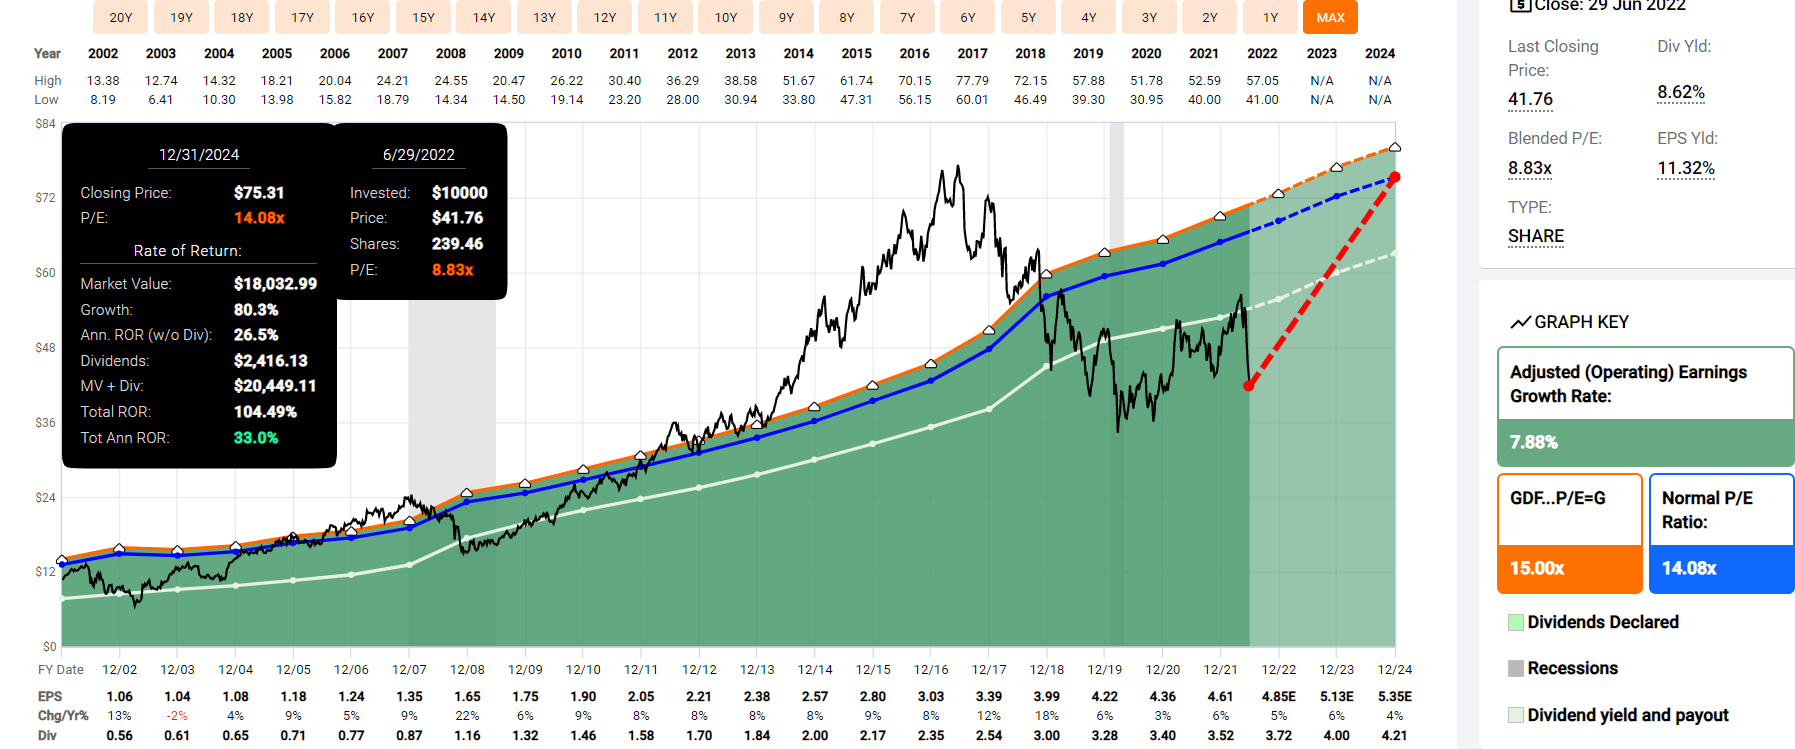
Enbridge 2024 Consensus Total Return Potential
FAST Graphs, FactSet Research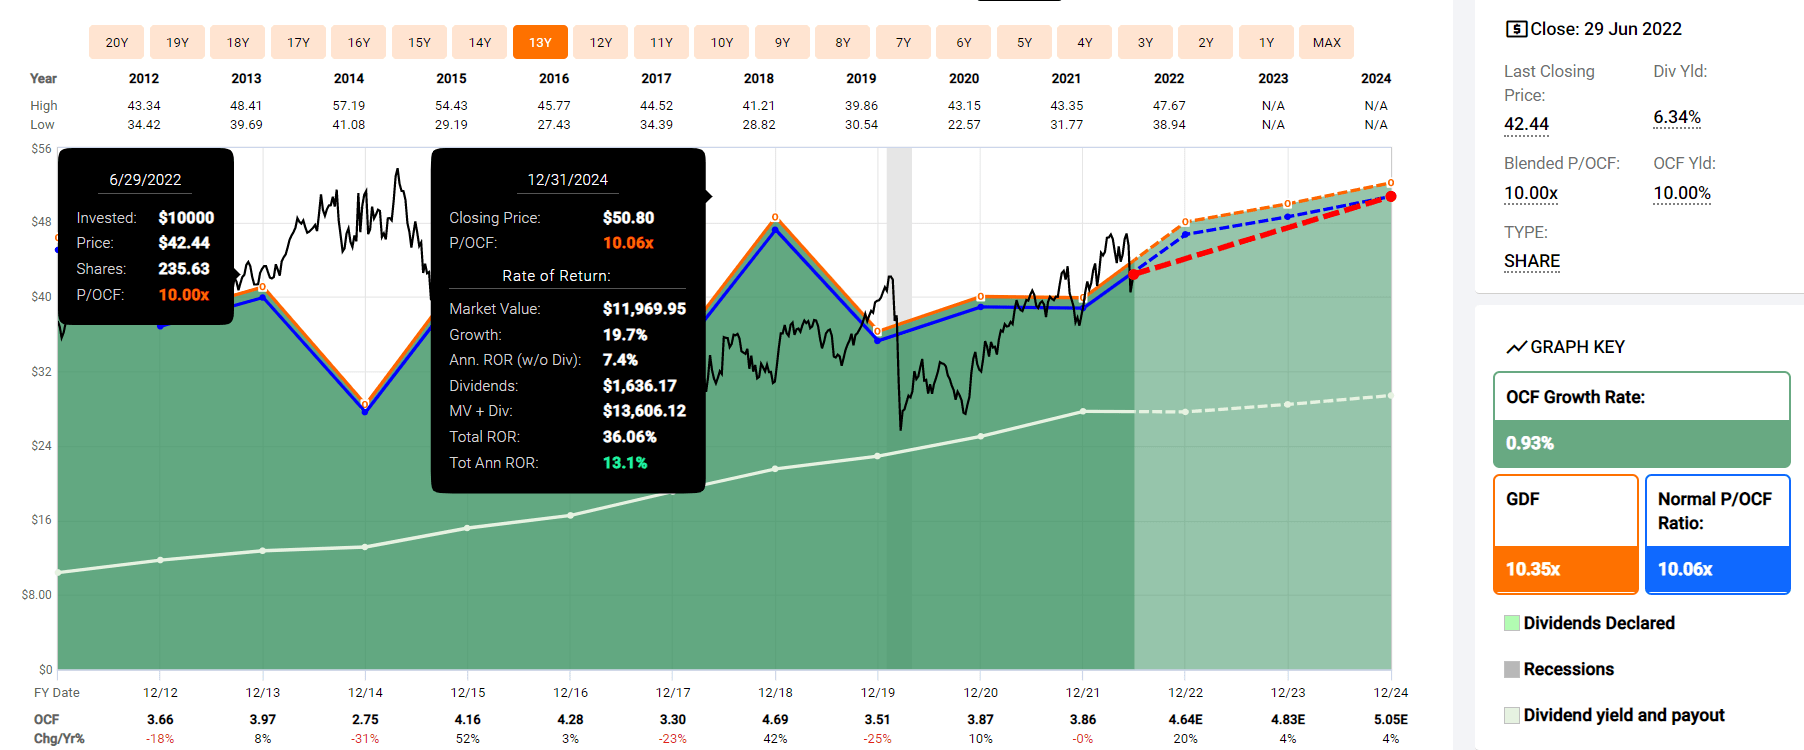
3M 2024 Consensus Total Return Potential
FAST Graphs, FactSet Research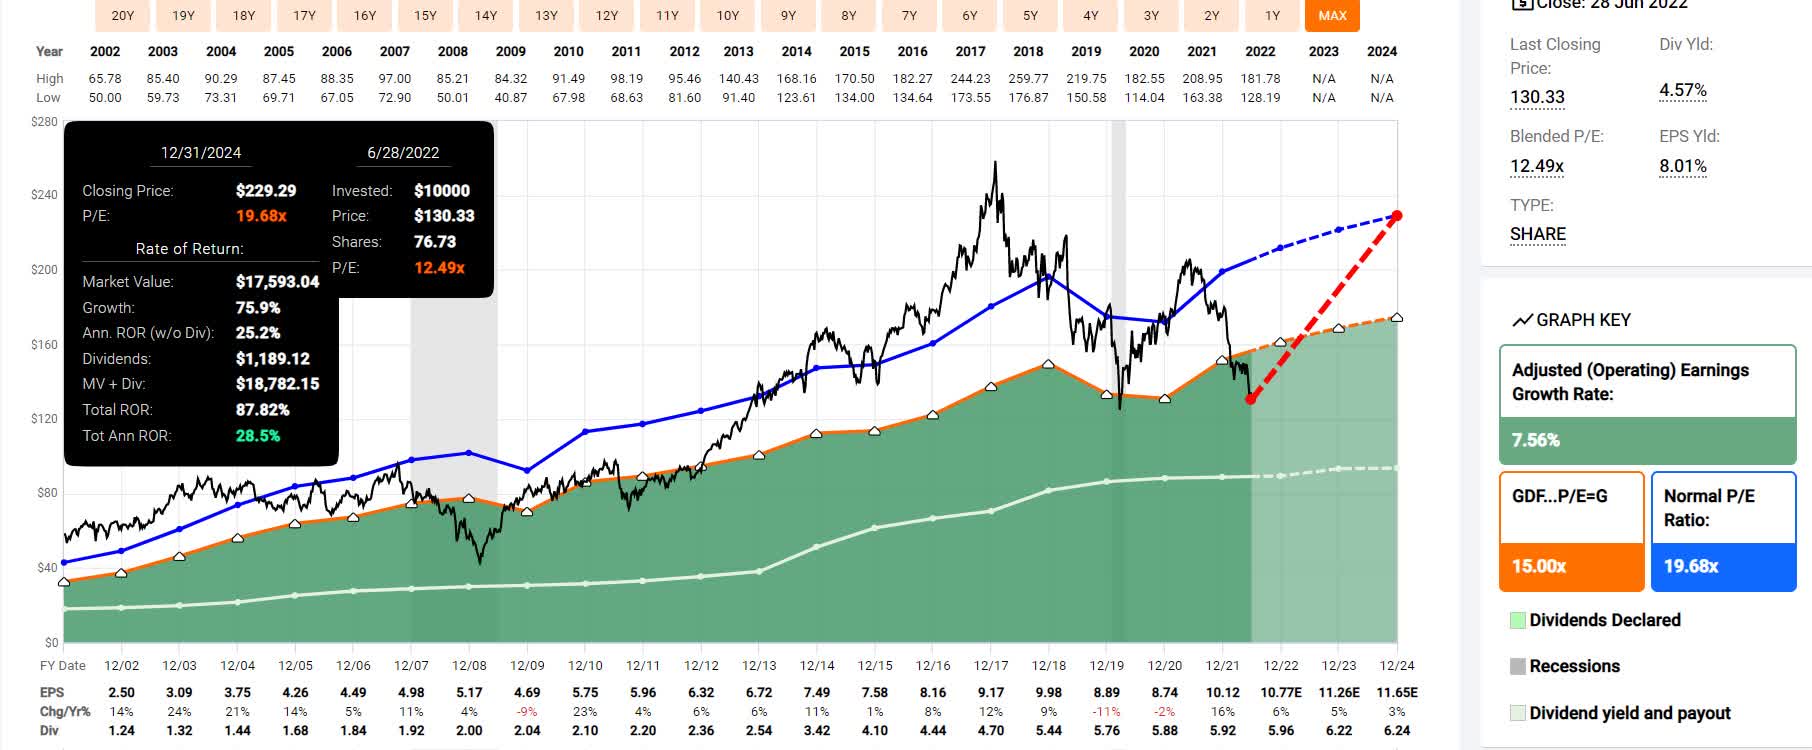
Novartis 2024 Consensus Total Return Potential
FAST Graphs, FactSet Research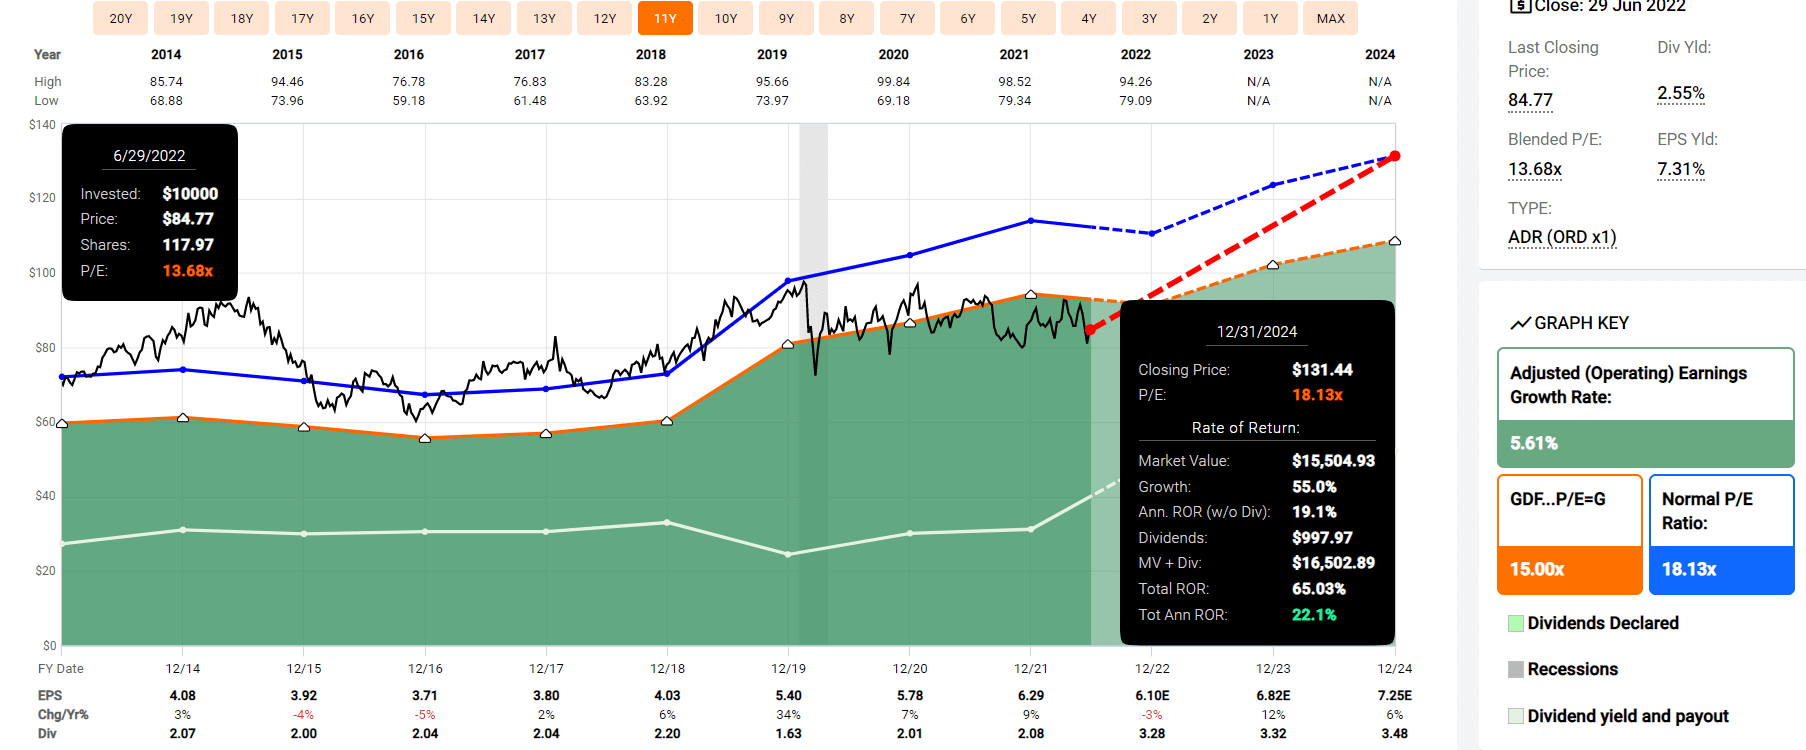
- 24% average consensus total return potential through 2024
- Literally, Buffett-like return potential from Ultra SWAN quality dividend aristocrat bargains hiding in plain sight
Why I Trust These Aristocrats And So Can You
Dividend Kings Zen Research Terminal
These aren’t just dividend aristocrats they are all 13/13 quality Ultra SWAN aristocrats, as close to perfect quality dividend blue-chips as exist on Wall Street.
That means their 6% yield isn’t just safe, it’s one of the safest in the world. How safe?
| Rating | Dividend Kings Safety Score (162 Point Safety Model) | Approximate Dividend Cut Risk (Average Recession) |
Approximate Dividend Cut Risk In Pandemic Level Recession |
| 1 – unsafe | 0% to 20% | over 4% | 16+% |
| 2- below average | 21% to 40% | over 2% | 8% to 16% |
| 3 – average | 41% to 60% | 2% | 4% to 8% |
| 4 – safe | 61% to 80% | 1% | 2% to 4% |
| 5- very safe | 81% to 100% | 0.5% | 1% to 2% |
| 4 High-Yield/Low Volatility Aristocrats | 92% | 0.5% | 1.4% |
| Risk Rating | Low-Risk (79th industry percentile risk-management consensus) | A- stable outlook credit rating 3.4% 30-year bankruptcy risk |
20% OR LESS Max Risk Cap Recommendation (Each) |
(Source: DK Zen Research Terminal)
In an average recession since WWII, the average risk of a dividend cut is about 0.5%. In a severe recession, like the Pandemic or Great Recession, it’s approximately 1.4%.
How can we tell these are some of the world’s safest and highest quality dividend blue-chips? By comparing their quality fundamentals to the dividend aristocrats.
| Metric | Dividend Aristocrats | 4 High-Yield/Low Volatility Aristocrats | Winner Aristocrats |
Winner 4 High-Yield/Low Volatility Aristocrats |
| Quality | 87% | 91% | 1 | |
| Safety | 89% | 92% | 1 | |
| Dependability | 84% | 91% | 1 | |
| Long-Term Risk Management Industry Percentile | 67% Above-Average |
79% Good, Bordering On Very Good |
1 | |
| Average Credit Rating | A- Stable | A- Stable | 1 | 1 |
| Average 30-Year Bankruptcy Risk | 3.01% | 3.40% | 1 | |
| Average Dividend Growth Streak (Years) | 44.3 | 42.0 | 1 | |
| Average Return On Capital | 100% | 445% | 1 | |
| Average ROC Industry Percentile | 83% | 91% | 1 | |
| 13-Year Median ROC | 89% | 181% | 1 | |
| Total | 3 | 8 |
(Source: DK Zen Research Terminal)
Ben Graham considered a 20+ year dividend growth streak an important sign of excellent quality. These aristocrats average a 42-year streak, more than 2X longer.
Joel Greenblatt is one of the greatest investors in history, with 40% annual returns for 21 years, and he considered return on capital to be his gold standard proxy for quality and moatiness.
- S&P 500 average ROC is 14.6%
- the aristocrats average 100%
- these aristocrats 445%
Their ROC has been climbing for 13 years, as we can see from the 13-year median of 181%.
- a wide and stable/improving moat
These aristocrats are in the top 9% of their peers when it comes to return on capital, confirming a wide and stable moat and world-class quality.
S&P estimates their average 30-year default risk at 3.4%, meaning an A- stable credit rating, matching the dividend aristocrats.
And six rating agencies estimate their long-term risk management in the top 21% of their industry peers. What does that mean? Corporate risk management you can trust in any recession.
| Classification | Average Consensus LT Risk-Management Industry Percentile |
Risk-Management Rating |
| S&P Global (SPGI) #1 Risk Management In The Master List | 94 | Exceptional |
| 4 High-Yield/Low Volatility Aristocrats | 79 |
Good – Bordering On Very Good |
| Strong ESG Stocks | 78 |
Good – Bordering On Very Good |
| Foreign Dividend Stocks | 75 | Good |
| Ultra SWANs | 71 | Good |
| Low Volatility Stocks | 68 | Above-Average |
| Dividend Aristocrats | 67 | Above-Average |
| Dividend Kings | 63 | Above-Average |
| Master List average | 62 | Above-Average |
| Hyper-Growth stocks | 61 | Above-Average |
| Monthly Dividend Stocks | 60 | Above-Average |
| Dividend Champions | 57 | Average |
(Source: DK Research Terminal)
OK, so now that you know why these are some of the world’s safest and most dependable companies, here’s why you might want to buy them today.
Wonderful Companies At Wonderful Prices
Dividend Kings Zen Research Terminal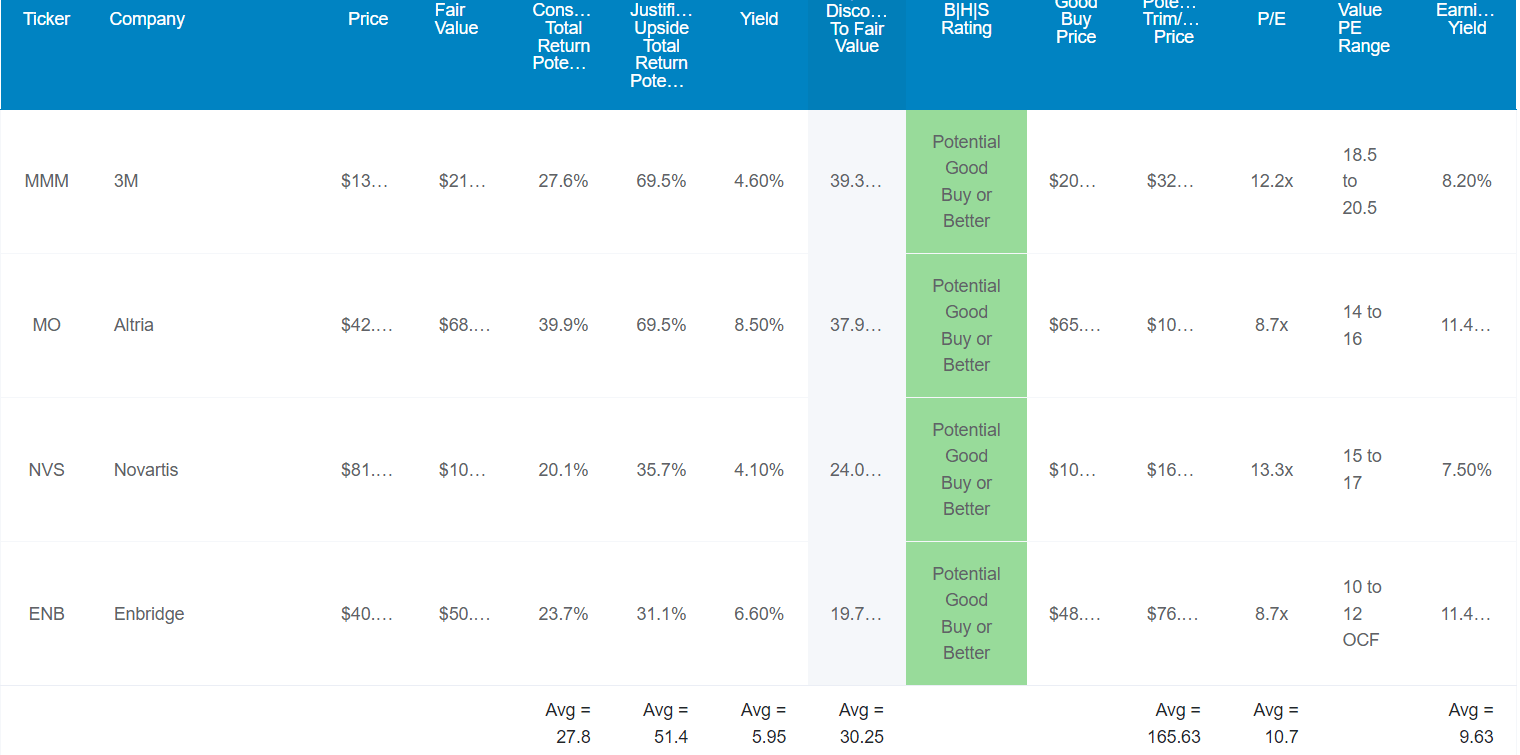
The S&P 500 trades at 16X forward earnings, a 6% historical discount.
These aristocrats trade at 10.7X earnings, a 30% historical discount.
The last time the S&P traded at a 10.7 PE was in the Great Recession.
Analysts expect these aristocrats to deliver 28% total returns in the next 12 months.
Their fundamentals actually justify up to a 51% total return in the next year, if they grow as expected and return to historical fair value.
- and 24% CAGR consensus total return potential through 2024
And let’s not forget that mouth-watering 6% very safe yield.
- safer than the dividend aristocrats as a group
And here’s why these four high-yield, low volatility aristocrats are potentially bear market dream stocks.
Long-Term Return Fundamentals That Can Help You Retire In Safety And Splendor
Dividend Kings Zen Research Terminal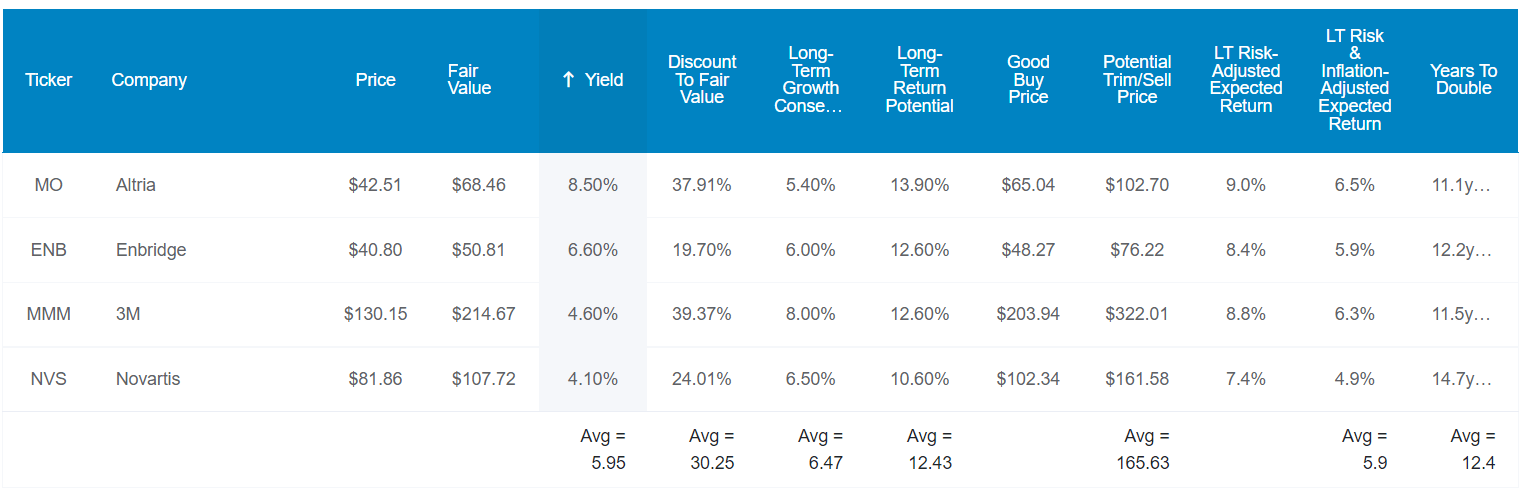
Not only do these Ultra SWAN aristocrats offer one of the safest 6% yields in the world, but analysts expect them to grow at 6.5% over time, potentially delivering 12.4% long-term returns.
| Investment Strategy | Yield | LT Consensus Growth | LT Consensus Total Return Potential | Long-Term Risk-Adjusted Expected Return | Long-Term Inflation And Risk-Adjusted Expected Returns | Years To Double Your Inflation & Risk-Adjusted Wealth |
10-Year Inflation And Risk-Adjusted Expected Return |
| 4 High-Yield/Low Volatility Aristocrats | 6.0% | 6.5% | 12.4% | 8.7% | 6.2% | 11.6 | 1.83 |
| REITs | 3.0% | 7.8% | 10.8% | 7.6% | 5.1% | 14.1 | 1.64 |
| High-Yield | 3.1% | 12.7% | 15.8% | 11.1% | 8.6% | 8.4 | 2.28 |
| Dividend Aristocrats | 2.4% | 8.5% | 10.9% | 7.6% | 5.2% | 14.0 | 1.65 |
| S&P 500 | 1.8% | 8.5% | 10.3% | 7.2% | 4.7% | 15.2 | 1.59 |
(Sources: Morningstar, FactSet, Ycharts)
That’s compared to 11% for the aristocrats and just over 10% for the S&P 500.
What does that potentially mean for you?
Inflation-Adjusted Consensus Return Potential: $1,000 Initial Investment
| Time Frame (Years) | 7.6% CAGR Inflation-Adjusted S&P Consensus | 8.4% Inflation-Adjusted Aristocrats Consensus | 9.9% CAGR Inflation-Adjusted 4 High-Yield/Low Volatility Aristocrat Consensus | Difference Between Inflation-Adjusted 4 High-Yield/Low Volatility Aristocrat Consensus Vs S&P Consensus |
| 5 | $1,445.67 | $1,493.29 | $1,605.39 | $159.72 |
| 10 | $2,089.97 | $2,229.92 | $2,577.28 | $487.31 |
| 15 | $3,021.42 | $3,329.92 | $4,137.55 | $1,116.14 |
| 20 | $4,367.98 | $4,972.54 | $6,642.39 | $2,274.41 |
| 25 | $6,314.67 | $7,425.45 | $10,663.65 | $4,348.97 |
| 30 | $9,128.95 | $11,088.36 | $17,119.33 | $7,990.38 |
(Source: DK Research Terminal, FactSet Research)
Analysts think these aristocrats can potentially deliver 17X inflation-adjusted returns over the next 30 years.
| Time Frame (Years) | Ratio Aristocrats/S&P Consensus | Ratio Inflation-Adjusted 4 High-Yield/Low Volatility Aristocrat Consensus vs S&P consensus |
| 5 | 1.03 | 1.11 |
| 10 | 1.07 | 1.23 |
| 15 | 1.10 | 1.37 |
| 20 | 1.14 | 1.52 |
| 25 | 1.18 | 1.69 |
| 30 | 1.21 | 1.88 |
(Source: DK Research Terminal, FactSet Research)
That’s nearly double the S&P 500 and 60% more than the dividend aristocrats.
- while you enjoy a safer yield that’s almost 4X higher on day one
OK, all this sounds wonderful but what evidence is there that these high-yield aristocrats can actually deliver close to 12% returns over time?
Historical Returns Since December 1996 (Annual Rebalancing)
The future doesn’t repeat, but it often rhymes.” – Mark Twain
Past performance is no guarantee of future results, but studies show that blue-chips with relatively stable fundamentals over time offer predictable returns based on yield, growth, and valuation mean reversion.
Bank of America 
So let’s take a look at how these aristocrats have performed over the last 26 years, a period when over 91% of total returns were a result of fundamentals, not luck.
(Source: Portfolio Visualizer Premium)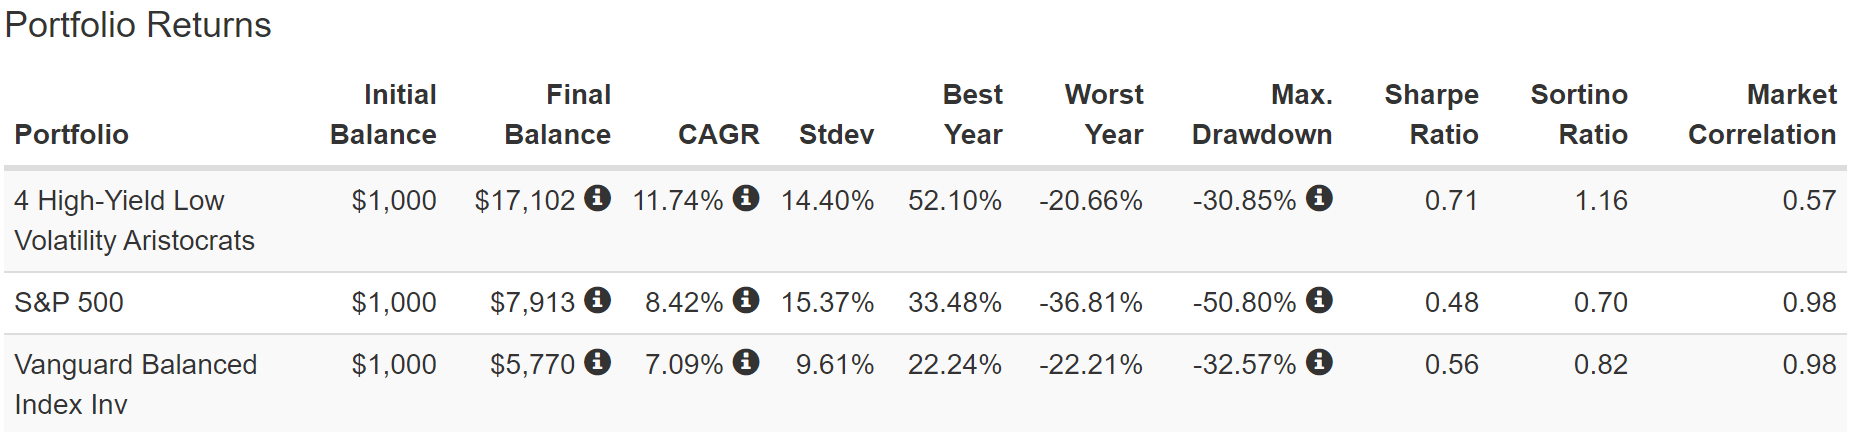
Including the current bear market, these aristocrats delivered almost 12% annual returns over the last quarter-century, with 1% lower annual volatility than the S&P 500.
- despite being just 4 companies rather than 500
- their peak decline during the Great Recession was 31%
- lower than the 60/40’s 33%
- 66% higher negative-volatility adjusted total returns (Sortino ratio) than the S&P 500
- 41% better negative-volatility adjusted returns than a 60/40
9.3X inflation-adjusted returns over the last 26 years vs 10.7X analysts expect over the next 25 years.
(Source: Portfolio Visualizer Premium)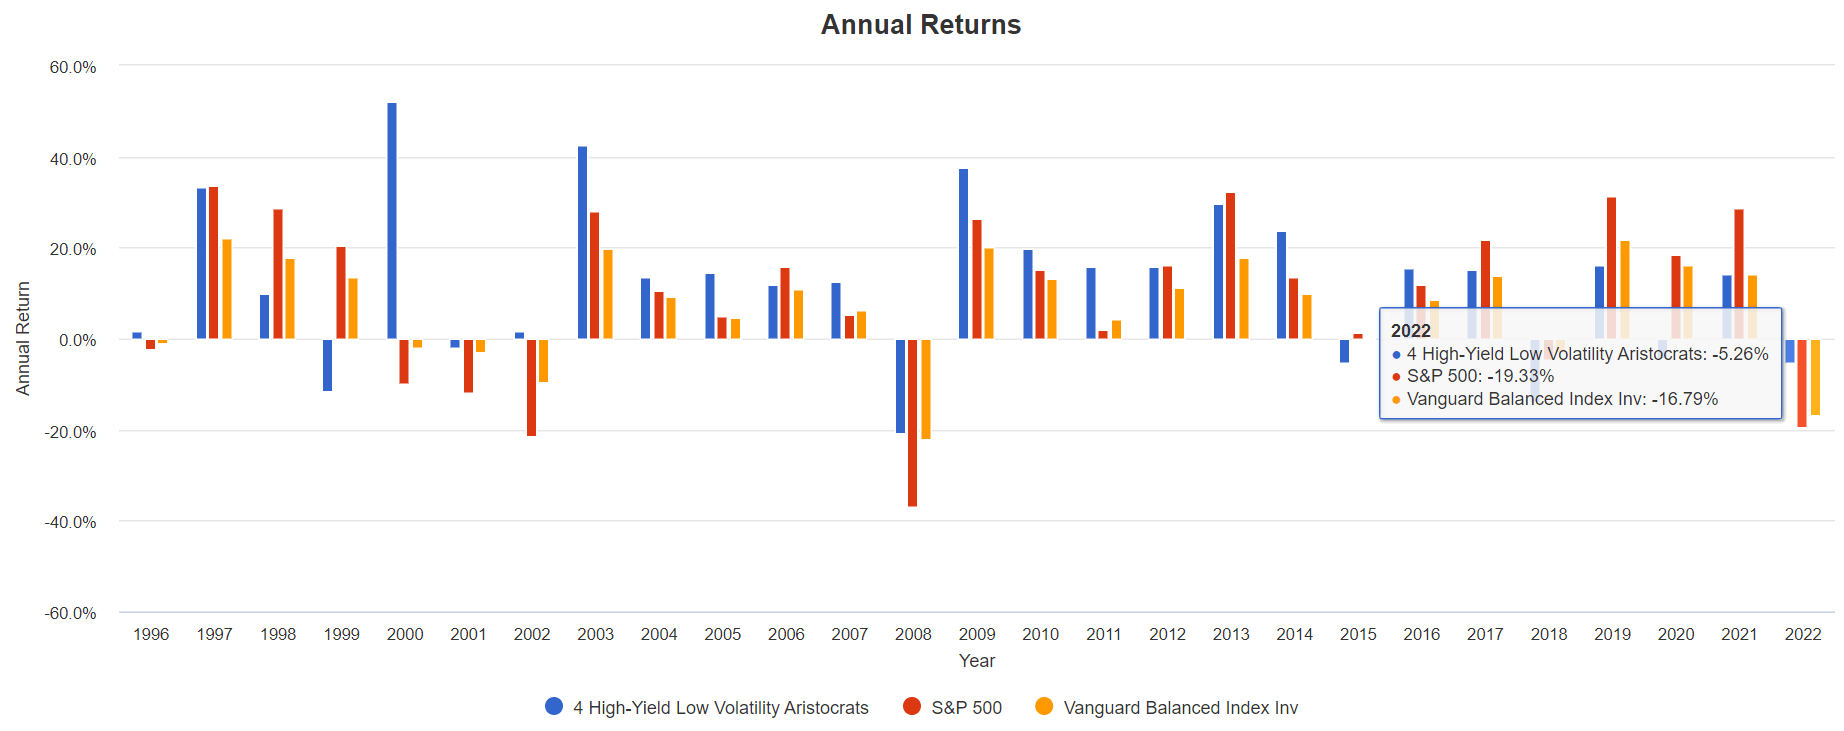
In the tech crash, these aristocrats actually went up. In the Great Recession, they fell 20% less than the market, and in 2022 they are down 5% while the market is down 19%.
(Source: Portfolio Visualizer Premium)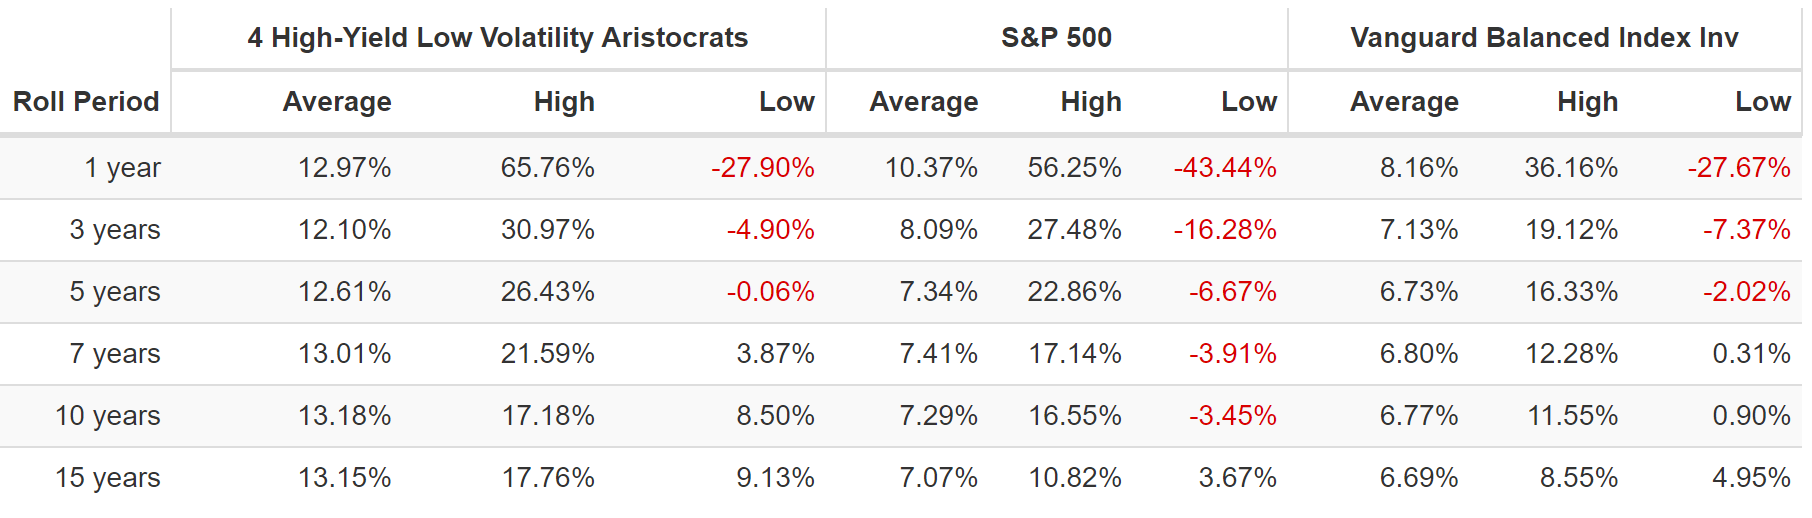
The average rolling return is 12.5% to 13%, almost 2X that of the S&P 500.
(Source: Portfolio Visualizer Premium)
In most major corrections, they fall significantly less than the market.
(Source: Portfolio Visualizer Premium)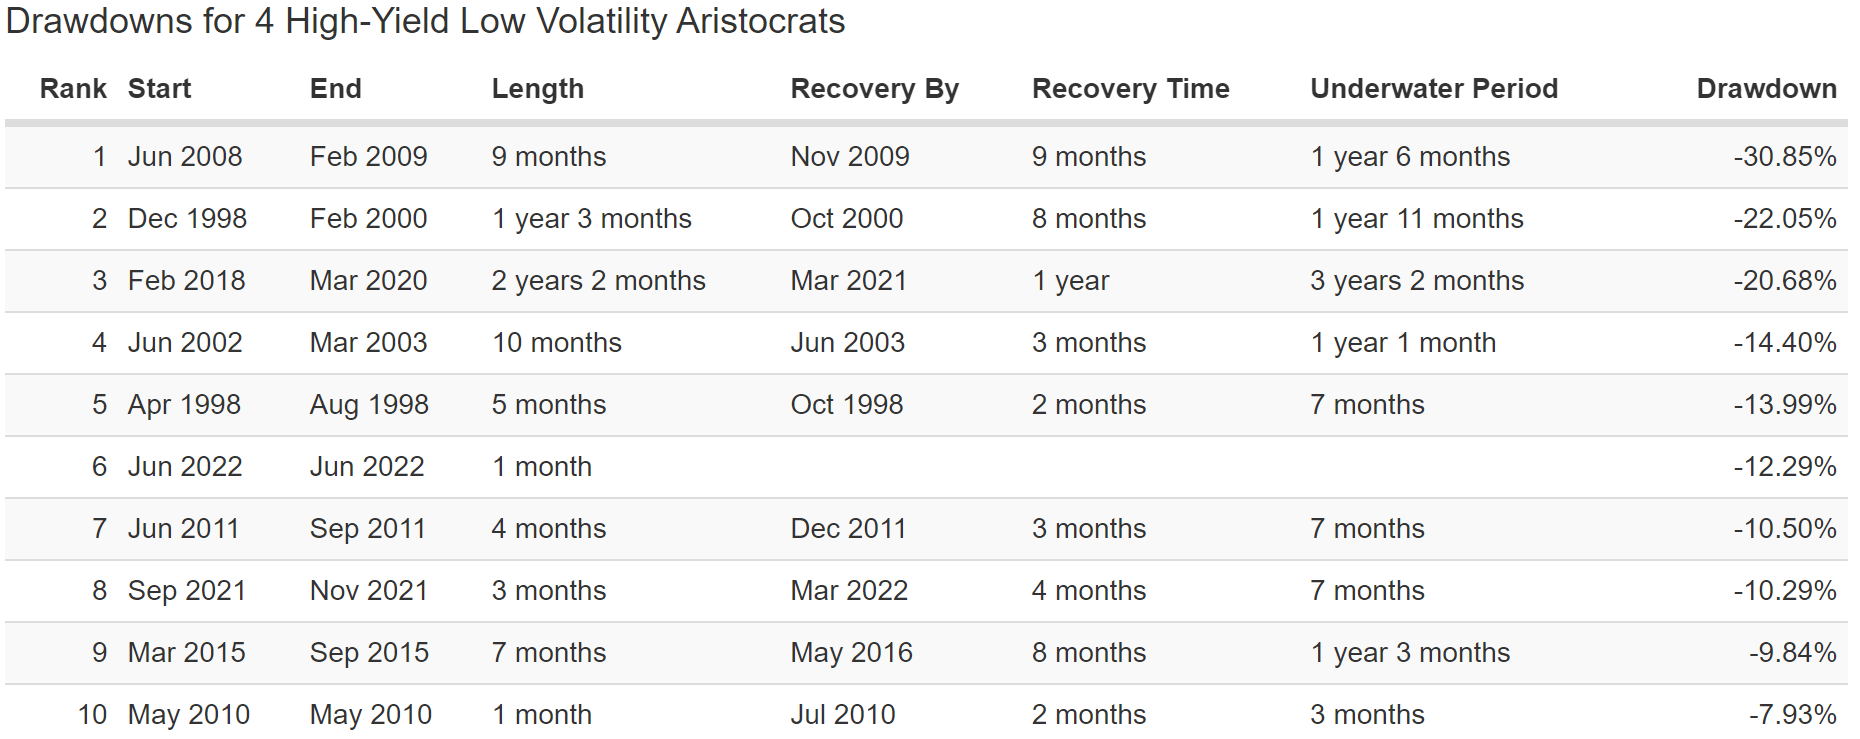
The S&P is down 19% off its highs, the Nasdaq 30%, and a 60/40 is down 17%.
These low-volatility aristocrats are in a 12% bear market.
(Source: Portfolio Visualizer Premium)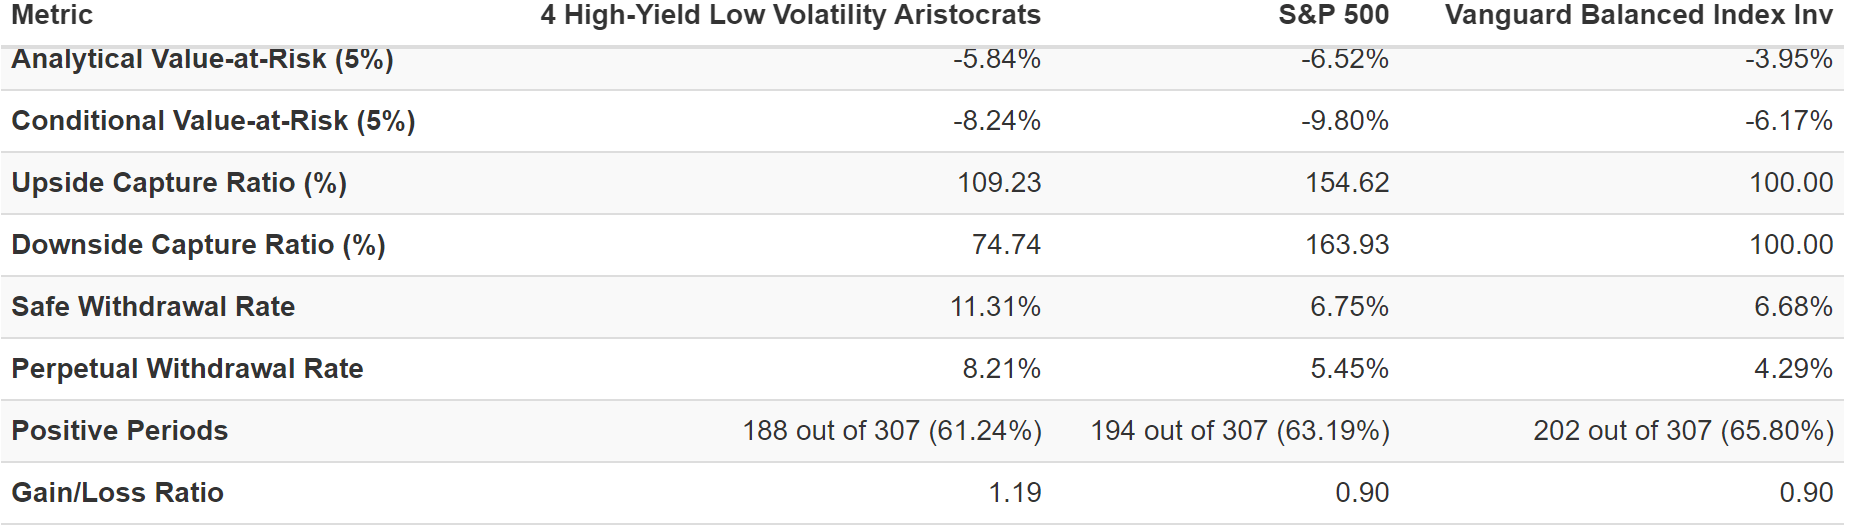
Over the last 26 years these aristocrats offered:
- 75% of the market’s downside
- 109% of its upside
- a safe perpetual withdrawal rate of 8.2%, 2X more than the 60/40
And let’s not forget about income growth over time, the entire reason to own aristocrats.
Dividend Growth Dream Stocks You Can Trust
| Portfolio | 1997 Income Per $1,000 Investment | 2022 Income Per $1,000 Investment | Annual Income Growth | Starting Yield | 2022 Yield On Cost |
| S&P 500 | $18 | $124 | 8.03% | 1.8% | 12.4% |
| 4 High-Yield/Low Volatility Aristocrats | $37 | $1,138 | 23.88% | 3.7% | 113.8% |
(Source: Portfolio Visualizer Premium)
Thanks to so many bear markets over time, these high-yield aristocrats compounded their income at an astonishing 24% annually for a quarter century, turning a 3.7% yield into a 114% yield on cost.
What kind of income do analysts expect in the future?
| Analyst Consensus Income Growth Forecast | Risk-Adjusted Expected Income Growth | Risk And Tax-Adjusted Expected Income Growth |
Risk, Inflation, And Tax Adjusted Income Growth Consensus |
| 25.2% | 17.7% | 15.0% | 12.5% |
(Source: Portfolio Visualizer Premium)
25% annual income growth, thanks to a higher starting yield. Adjusting for the risk of these companies now growing as expected, inflation, and taxes, you can realistically expect about 12.5% real income growth.
Now compare that to what they expect from the S&P 500.
| Time Frame | S&P Inflation-Adjusted Dividend Growth | S&P Inflation-Adjusted Earnings Growth |
| 1871-2021 | 1.6% | 2.1% |
| 1945-2021 | 2.4% | 3.5% |
| 1981-2021 (Modern Falling Rate Era) | 2.8% | 3.8% |
| 2008-2021 (Modern Low Rate Era) | 3.5% | 6.2% |
| FactSet Future Consensus | 2.0% | 5.2% |
(Sources: S&P, FactSet, Multipl.com)
What about a 60/40 retirement portfolio?
- 0.5% consensus inflation, risk, and tax-adjusted income growth.
In other words, these 4 high-yield, low volatility aristocrats offer
- almost 4X the market’s yield (and a much safer yield at that)
- almost 6.5X its long-term inflation-adjusted consensus income growth potential
- 25X better long-term inflation-adjusted income growth than a 60/40 retirement portfolio
This is the power of high yield aristocrat investing in a bear market.
Bottom Line: High-Yield Low Volatility Aristocrats Can Help You Stay Safe And Sane In This Bear Market
Bear markets can be scary, even for market veterans who understand that stocks sometimes will fall 20%, 40%, or even 50%.
Guggenheim Partners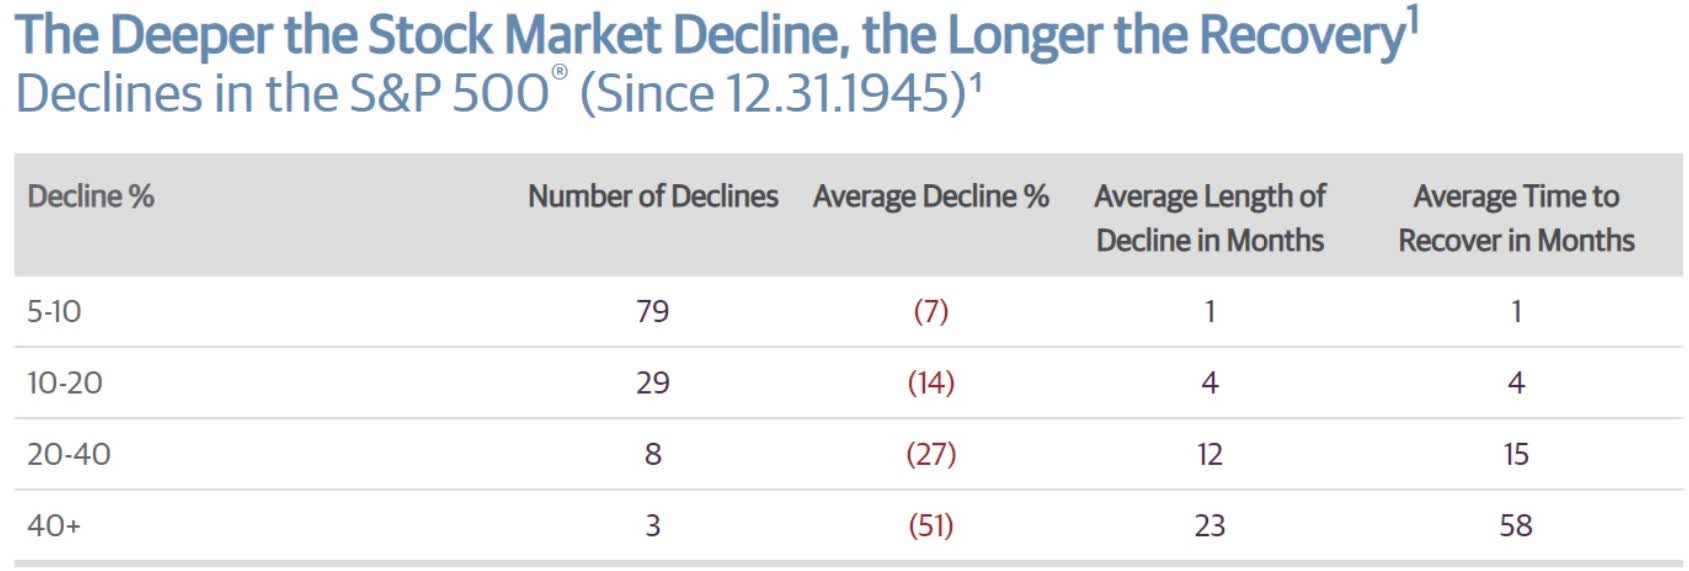
In fact, market crashes of 40+% average once every 25 years. But the nature of historical averages is that big downturns can come a lot more frequently.
If the market falls 40% this time, as many blue-chip economist teams think it might, then that would be three market crashes in 25 years, 3X the historical rate.
This kind of volatility can weigh on investor sentiment, as we’re seeing now.
June 16th, the current market low (Bank of America )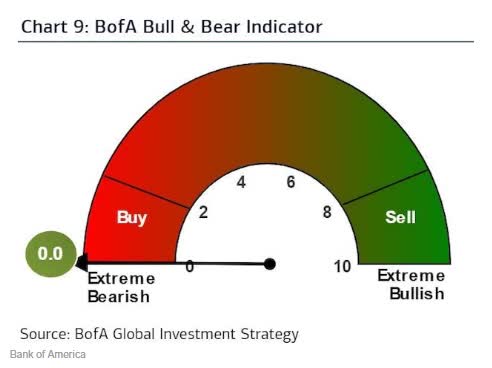
In fact, according to Bank of America’s sentiment indicator, we recently hit 0.0, levels only seen in the Great Recession and Pandemic.
Ben Carlson 
But even if we get a recession in 2023, that doesn’t mean hiding in cash is a prudent choice.
Remember that market timing is 98% likely to lead to far lower returns, possibly even negative inflation-adjusted returns over decades.
And what if we avoid a recession and a 40% market crash?
16% Annual Returns From Stocks Through All This
Charlie Bilello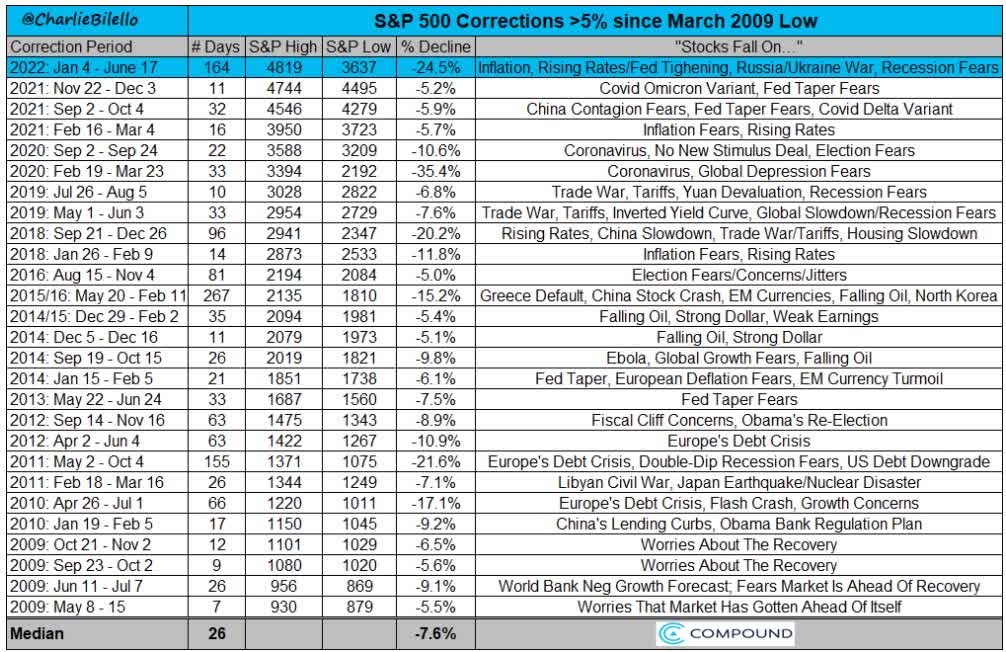
Guess what? The market is going to puke from time to time, even in one of the best bull markets in US history.
Every six months on average, both since WWII and 2009, we experience a 5+% pullback. Every 18 months a 10% to 20% bear market and 20+% bear markets average once every four years.
If you want to participate in the best-performing asset class in history, including 1,150X inflation-adjusted returns over the last 90 years, you have to at least tolerate volatility and preferably embrace it and profit from it.
And most of all you have to stay invested in stocks, no matter how tempting market timing might seem.
And that’s where ENB, MO, NVS, and MMM can help. These high-yield low-volatility Aristocrats are potential bear market dream stocks that offer:
- a very safe 6.0% yield (almost 4X that of the S&P 500 and 3X the aristocrats)
- an average A- stable credit rating
- a 42-year dividend growth streak
- 6.5% long-term growth consensus
- 12.4% long-term return potential vs 12.5% average rolling returns since 1996
- down 5% in 2022 vs 19% S&P 500
- far lower volatility in extreme bear markets (including the tech crash and Great Recession)
This is how you stay safe, sane, and rational in this and all future bear markets.
Not by trying to accomplish the impossible and jump in and out of stocks trying to avoid the drawdowns, but by trusting in the five fundamentals that make long-term financial success a 97% certainty.
- asset allocation appropriate for your risk profile
- diversification
- quality companies
- with solid growth prospects
- strong balance sheets and good long-term risk management track records
- safe and growing dividends
- attractive valuations
If you focus on these fundamentals then retiring in safety and splendor isn’t a function of luck, just time, patience, and discipline.
Luck is what happens when preparation meets opportunity.” – Seneca the Younger
Be the first to comment