

NicoElNino
4 Factor Dividend Growth Portfolio
I came up with the idea for the 4 factor dividend growth portfolio as I studied Schwab’s U.S. Dividend Equity ETF (SCHD). SCHD is one of the most popular dividend ETF’s traded on the US market, and the third largest dividend ETF in terms of AUM. The two more popular dividend ETF options are Vanguard’s Dividend Appreciation ETF (VIG) and the High Dividend Yield ETF (VYM). SCHD tracks the popular Dow Jones US Dividend 100 Index that has a rather unique stock selection process. It starts with a universe of about 3000 unique companies and selects the top 100 following a rules based approach. I personally enjoy a rules based stock selection process as it’s easy to understand and follow. The main set of criteria revolve around 4 factors that are used to rank the final handful of stocks and identify constituent stocks that will be included in the ETF during its annual rebalancing. Those factors are:
- Free Cash Flow to Total Debt Ratio
- Return on Equity
- IAD Yield (or Forward Dividend Yield)
- 5 year dividend growth rate (computed in a different format)
I decided to borrow this rules based stock selection process and apply it to my own universe of dividend growth stocks. I also made one minor adjustment in replacing the return on equity with the return on capital. Return on equity measures profitability on shareholder equity while return on capital provides the same measure of profitability, it also includes debt into the equation.
In late October I created my universe of dividend growth stocks and I applied these 4 factors to that universe to select the 30 best stocks that were included in the 4 factor portfolio that launched on November 1, 2022. Let me explain the process and share the initial results.
Portfolio Construction
The portfolio construction phase began with generating a universe of dividend growth stocks. I screened all dividend paying companies with the following parameters to come up with the initial universe:
- A market cap of at least $10 billion
- A payout ratio below 100%
- A 5 year dividend growth rate above 5%
- A positive 5 year revenue growth rate
- A positive 5 year earnings per share growth rate
- A wide or narrow economic moat from Morningstar
- An exemplary or standard stewardship rating from Morningstar
- The stock must trade either on the NYSE or NASDAQ
These 8 parameters provided a list of 174 unique dividend growth stocks for the initial universe. The next step was to rank all 174 stocks using the following 4 factors and select the top 30 ranked stocks:
- Free Cash Flow to Total Debt Ratio (Cash from operations / Total Debt)
- 5 year dividend growth rate (highest to lowest)
- Return on Capital (highest to lowest)
- Forward Dividend Yield (highest to lowest)
All data came from seeking alpha as of October 30th, 2022.
Here are the top 30 ranked stocks based on a combined score for all 4 factors.
Created by Author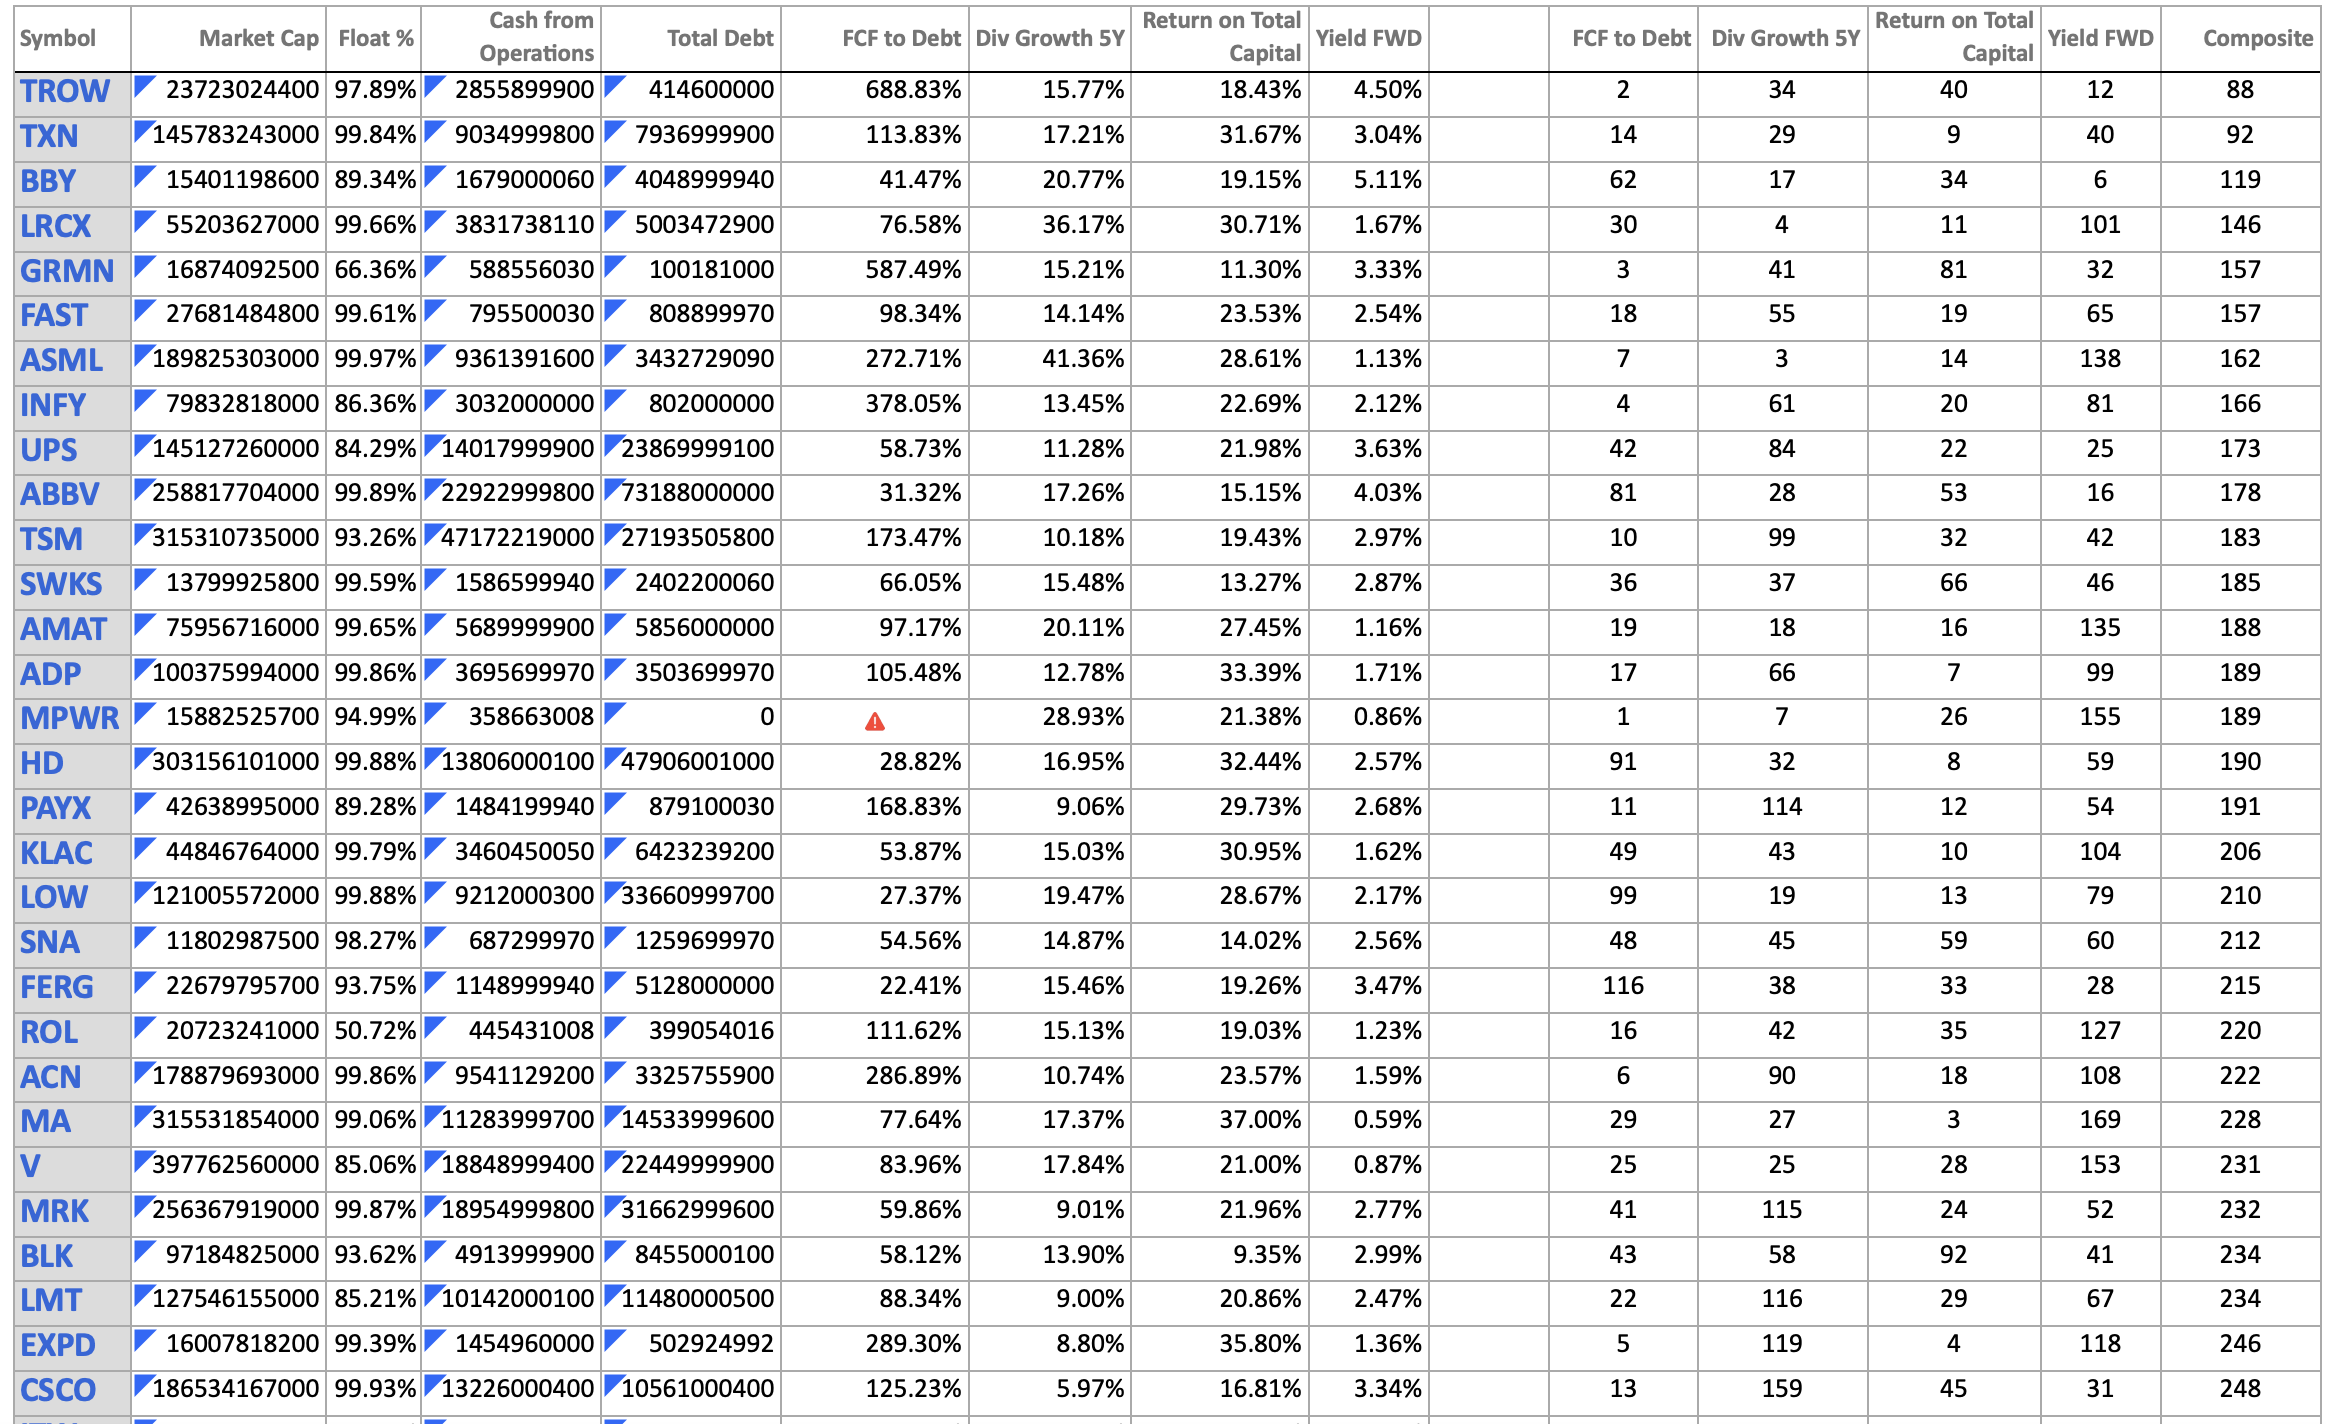
The next step was to assign a weight to each stock in the final portfolio. Here I also borrowed the methodology from the Dow Jones US Dividend 100 Index that uses a float adjusted market cap based allocation with a maximum cap to any individual stock. The Index has a maximum allocation cap of 4% to individual holdings, given that my portfolio has only 30 stocks opposed to 100 stocks in the Dow Jones Index, I decided to set my own allocation cap. The maximum allocation to any individual stock in the 4 factor portfolio is 6.67%, or twice the equal weight allocation (100% / 30 stocks * 2).
Here is the starting allocation for the portfolio:
Created by Author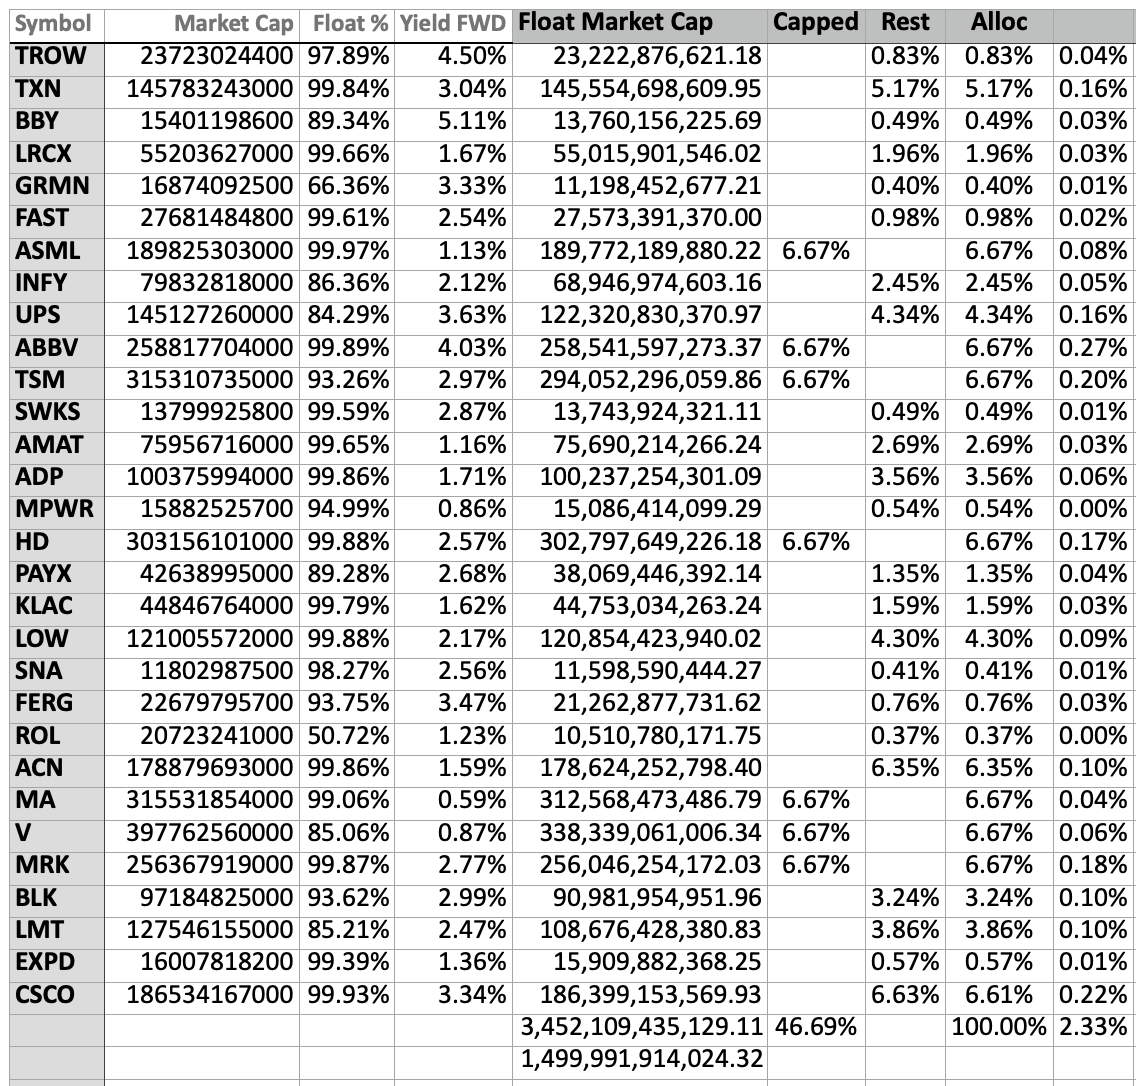
The final allocation can be seen in the “Alloc” column in the image above. 7 stocks, based on their float adjusted market cap, exceeded the maximum allocation cap and were therefore set at a weight of 6.67%. The portfolio is top heavy, similar to SCHD, here is a breakdown of the top holdings.
- Top 7 holdings make up 46.69% of the portfolio
- Top 10 holdings make up 64.84% of the portfolio
- Top 15 holdings make up 84.14% of the portfolio
- Top 20 holdings make up 94.18% of the portfolio
- Bottom 10 holdings make up 5.82% of the portfolio
How does this compare to SCHD? Well the top 10 holdings for SCHD make up 40.84% of the fund, much less than my 4 factor portfolio. But if you consider that the top 10 holdings in my 4 factor portfolio represent 33% of all holdings, the equivalent figure for SCHD would be approximately 33 positions. The top 30 holdings for SCHD make up 80.76% of the fund which is significantly higher than my 4 factor portfolio. Suffice it to say, both my portfolio and SCHD are top heavy, however I believe my portfolio has a slightly better distribution of weight. The top half of SCHD’s holdings make up 92.97% of the fund, whereas in my portfolio the top half accounts for 84.14% of the total portfolio.
One of the reasons I decided to use a pool of 30 stocks opposed to 100 is to place more emphasis on the best ranked stocks. 100 stocks just seems too diversified for me and with a float adjusted market cap weighing approach mid and small cap stocks can be too diluted in the final portfolio.
With the portfolio fully constructed it was now time for implementation. Implementing a portfolio of 30 stocks is also much easier than a portfolio of 100 stocks, if you have to do it manually.
Portfolio Implementation
I decided to use my small Traditional IRA account as an ideal place to test this portfolio. At the time of inception the account had a market value of approximately $1,812. I am not contributing any more capital to this portfolio so tracking this strategy will be easier without any cash flows. This portfolio is held with M1 Finance. The major problem with easily implementing this portfolio is that M1 does not allow asset allocations of less than 1% and you can only set individual stock allocations in 1% increments. In order to shift the portfolio to its target allocation I was going to have to turn off automatic investing and self instruct the broker the exact dollar amounts to buy. Since trades are executed during open market sessions it was virtually impossible to hit the target allocation with exact precision. Being off a few cents here or there wouldn’t really impact the long-term results by much. I initiated all trades on November 1st, 2022 and the plan is to let the portfolio run for a full year. Next year, on November 1st, I will run the stock selection process again and rebalance the portfolio to the 30 best stocks the process identifies. All dividends paid during the year will be used to move the portfolio closer to the target allocation. As of November 18th the portfolio as a whole has drifted 2.98% off target as a result of price movements from the individual holdings.
Portfolio Results
Here is a breakdown of the portfolio as of November 18th.
Created by Author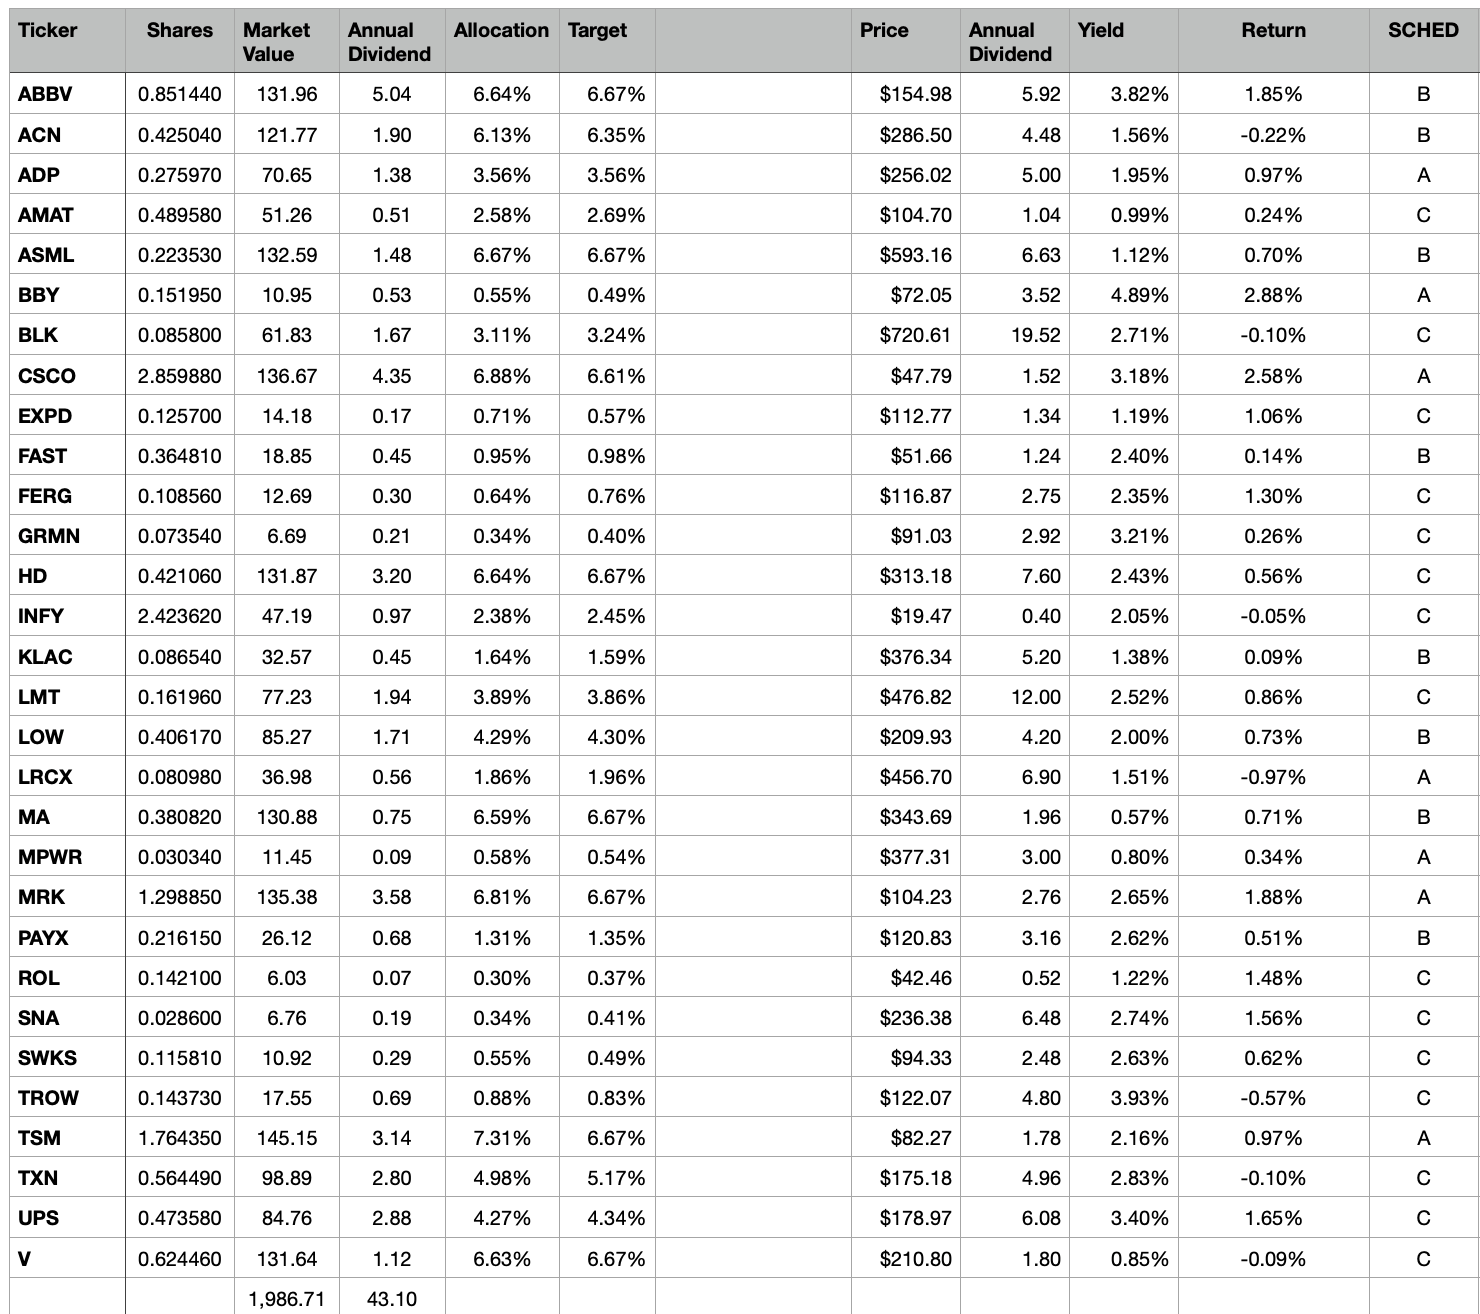
In the image above you can see: the number of shares, the market value of each position (11/18), the projected annual dividend income, current allocation, target allocation, current share price, annual dividend rate, dividend yield, prior days return, dividend schedule.
At launch the portfolio had a dividend yield of 2.33%, currently the yield sits at 2.14% as a result of favorable share price appreciation. The portfolio is projected to produce $43.10 of annual dividend income with a rather equally split monthly dividend payment of $3-4.
The main goal for this portfolio is to achieve a strong total return, I would like for it to outperform the S&P 500 in the long run. It got off to a good start as the portfolio is up 9.6% through November 18th compared to a gain of just 2.56% for the S&P 500. This could very well be a lucky break as some of the individual positions had favorable news recently.
It’ll take a few years to see the true results this strategy can offer. I fully expect this portfolio to be more volatile than the S&P 500, since it only has 30 holdings and a significant gain/decline in one position can move the entire portfolio.
Long-Term Plan
The long-term plan is to see whether my hypothesis that this stock selection strategy has merit proves to be accurate. I will run this portfolio for a few years, track and document the results and measure long-term performance against the S&P 500 total return. I decided to use the S&P 500 instead of SCHD as the benchmark for this portfolio because it’s a much better representation of US equity returns. It’s also a good alternative index to invest in opposed to selecting your own individual stocks, therefore I think it’s a good benchmark to use for comparison.
I’m mainly doing this out of curiosity but I do believe the strategy has merit, otherwise I wouldn’t invest real money into this portfolio. Granted the dollar amount is not significant and represents less than 1% of my invested assets. But I think tracking an actual portfolio will give me more realistic results versus a mock portfolio that would be more precise but impossible to duplicate. It’s virtually impossible to stick to a target asset allocation at all times, perhaps I can run a parallel mock portfolio to see the difference between the two.
Be the first to comment