

Pgiam/iStock via Getty Images
Investment Thesis
The big-$ institutions and the market-making professionals helping them improve their portfolio holdings are constantly probing competitive developments in these kinds of stocks. They can afford attention and evaluative comparisons we individual investors rarely can. They usually are the best-informed market participants.
But we needn’t lose capital to them, only lose relative advantage. When we use what they know or expect of coming prices to guide our buys and sells with other less-informed individual investors, we retain most of that advantage.
So, how do we “get in the know?” Read on.
The institutions’ actions disrupt day-by-day minimal-volume-trade markets because their $-Billion portfolios must act at bigger-scale trades. Doing so requires MMs to take temporary risks getting such trades accomplished. Risks can be hedged against, for a price, at a “cost of market-liquidity” paid for by the institution.
Those costs and the hedging deal structure tell what kind of coming share prices are to be expected. We know how to do that, and have the multi-year history of how well those expectations have worked out in wide arrays of reward-to-risk situations for some 3,000+ stocks, ETFs, REITs, and market indexes.
The present-day particulars for 3M Company (NYSE:MMM) and Honeywell International, Inc. (HON) follow.
Reward~Risk Expectations Trade-offs for Related Stocks
Here in Figure 1 is how the markets currently appraise their Reward ~ Risk trade-offs among stocks regarded as competitors by other investors, based on behavioral analysis (of what investing systems require to be done, not of emotional investor errors) of actions by Market-Makers [MMs] as they protect their at-risk capital from possible damaging future market-price moves..
Figure 1
blockdesk.com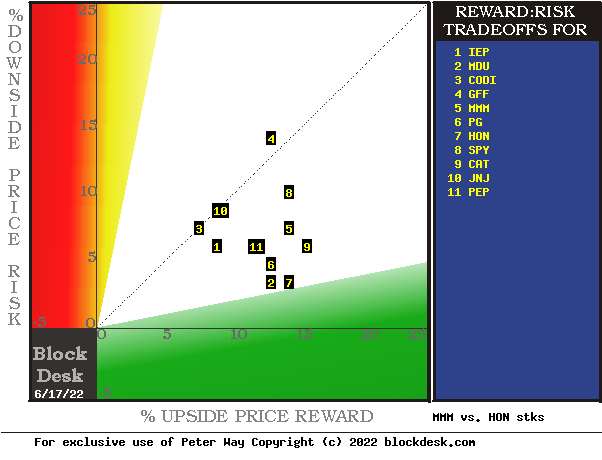
(used with permission).
Expected rewards for these securities are the greatest gains from current closing market price seen worth protecting short positions. Their measure is on the horizontal green scale.
The risk dimension is of actual price drawdowns at their most extreme point while being held in previous pursuit of upside rewards similar to the ones currently being seen. They are measured on the red vertical scale.
Both scales are of percent change from zero to 25%. Any stock or ETF whose present risk exposure exceeds its reward prospect will be above the dotted diagonal line. Capital-gain attractive to-buy issues are in the directions down and to the right.
Our principal interest is in MMM at location [5], midway vertically between locations [8 and 7]. Down at the green area of forecast outcomes where five times as much gain as loss lives is HON at [7]. A “market index” norm of reward~risk tradeoffs is offered by SPY at [12]. Most appealing (to own) by this Figure 1 view is HON.
Comparing features of Alternative Investment Stocks
The Figure 1 map provides a good visual comparison of the two most important aspects of every equity investment in the short term. There are other aspects of comparison which this map sometimes does not communicate well, particularly when general market perspectives like those of SPY are involved. Where questions of “how likely’ are present other comparative tables, like Figure 2, may be useful. But before getting into those details, here are brief descriptions of our two principal alternatives, along with Wall Street estimates of corporate growths over various time periods.
Description of Companies of Particular Interest
“3M Company operates as a diversified technology company worldwide. It operates through four segments: Safety and Industrial; Transportation and Electronics; Health Care; and Consumer. A wide variety of products, materials, and services are made available. It offers its products through e-commerce and traditional wholesalers, retailers, jobbers, distributors, and dealers. The company was founded in 1902 and is based in St. Paul, Minnesota..”
Source: Yahoo Finance
Yahoo Finance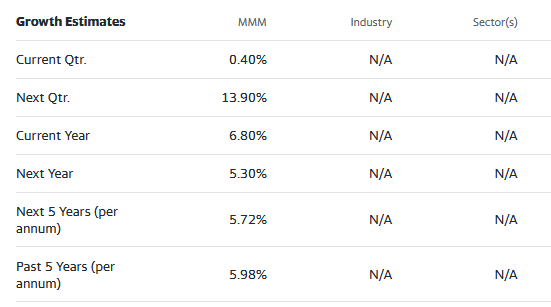
“Honeywell International Inc. operates as a diversified technology and manufacturing company worldwide. Its Aerospace, Building Technologies, Performance Materials and Technologies, and Safety and Productivity Solutions segments provide diverse technological products and services. The company was founded in 1906 and is headquartered in Charlotte, North Carolina..”
Source: Yahoo Finance
Yahoo Finance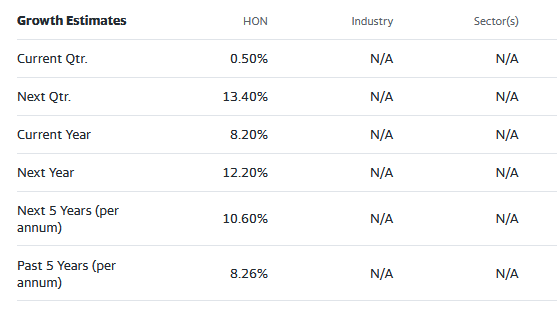
These growth estimates have been made by and are collected by Yahoo Finance from Wall Street analysts to suggest what conventional methodology currently produces. The typical variations across forecast horizons of different time periods illustrate the difficulty of making value comparisons when the forecast horizon is not clearly defined.
The strength of hedging-related forecasts is their recognition of forecast horizon limits – typically in the coming 3-5 months.
The Figure 1 map provides a good visual comparison of the two most important aspects of every equity investment in the short term. There are other aspects of comparison which this map sometimes does not communicate well, particularly when general market perspectives like those of SPY are involved. Where questions of “how likely’ are present other comparative tables, like Figure 2, may be useful.
Yellow highlighting of the table’s cells emphasize factors important to securities valuations and the security HON of most promising of near capital gain as ranked in column [R]. The pink cell-highlighting is to aid visual comparisons with HON.
Figure 2
blockdesk.com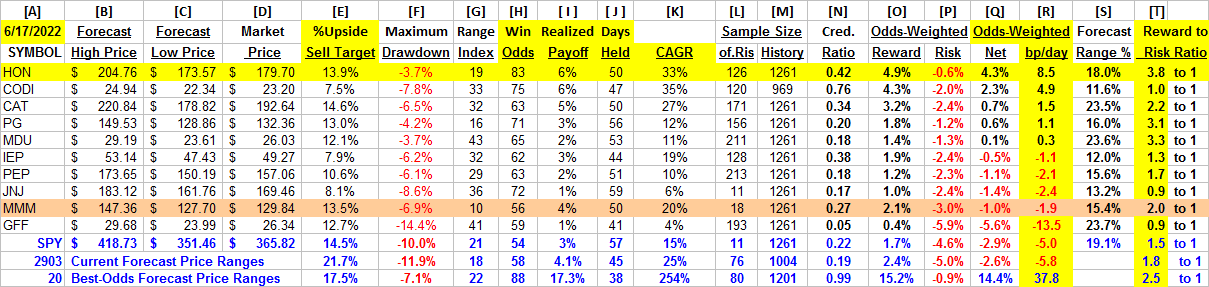
(used with permission)
Why do all this math?
Figure 2’s purpose is to attempt universally comparable answers, stock by stock, of a) How BIG the prospective price gain payoff may be, b) how LIKELY the payoff will be a profitable experience, c) how SOON it may happen, and d) what price drawdown RISK may be encountered during its holding period.
Readers familiar with our analysis methods after quick examination of Figure 2 may wish to skip to the next section viewing price range forecast trends for MMM and HON.
Column headers for Figure 2 define investment-choice preference elements for each row stock whose symbol appears at the left in column [A]. The elements are derived or calculated separately for each stock, based on the specifics of its situation and current-day MM price-range forecasts. Data in red numerals are negative, usually undesirable to “long” holding positions. Table cells with yellow fills are of data for the stocks of principal interest and of all issues at the ranking column, [R].
The price-range forecast limits of columns [B] and [C] get defined by MM hedging actions to protect firm capital required to be put at risk of price changes from volume trade orders placed by big-$ “institutional” clients.
[E] measures potential upside risks for MM short positions created to fill such orders, and reward potentials for the buy-side positions so created. Prior forecasts like the present provide a history of relevant price draw-down risks for buyers. The most severe ones actually encountered are in [F], during holding periods in effort to reach [E] gains. Those are where buyers are emotionally most likely to accept losses.
The Range Index [G] tells where today’s price lies relative to the MM community’s forecast of upper and lower limits of coming prices. Its numeric is the percentage proportion of the full low to high forecast seen below the current market price.
[H] tells what proportion of the [L] sample of prior like-balance forecasts have earned gains by either having price reach its [B] target or be above its [D] entry cost at the end of a 3-month max-patience holding period limit. [ I ] gives the net gains-losses of those [L] experiences.
What makes HON most attractive in the group at this point in time is its basic strength of reward to risk ratio of 3.8 to 1 in [T]. For MMM it is only 2.0 to 1.
Further Reward~Risk tradeoffs involve using the [H] odds for gains with the 100 – H loss odds as weights for N-conditioned [E] and for [F], for a combined-return score [Q]. The typical position holding period [J] on [Q] provides a figure of merit [fom] ranking measure [R] useful in portfolio position preferencing. Figure 2 is row-ranked on [R] among alternative candidate securities, with HON in top rank.
Along with the candidate-specific stocks these selection considerations are provided for the averages of some 2900 stocks for which MM price-range forecasts are available today, and 20 of the best-ranked (by fom) of those forecasts, as well as the forecast for S&P500 Index ETF (SPY) as an equity-market proxy.
Current-market index SPY is not competitive as an investment alternative with its Range Index of 24 indicates 3/4ths of its forecast range is to the upside, but little more than half of previous SPY forecasts at this range index produced profitable outcomes, with enough losers to put its average in negative result.
As shown in column [T] of figure 2, those levels vary significantly between stocks. What matters is the net gain between investment gains and losses actually achieved following the forecasts, shown in column [I]. The Win Odds of [H] tells what proportion of the Sample RIs of each stock were profitable. Odds below 80% often have proven to lack reliability.
Recent Forecast Trends of Primary Subjects
Figure 3
blockdesk.com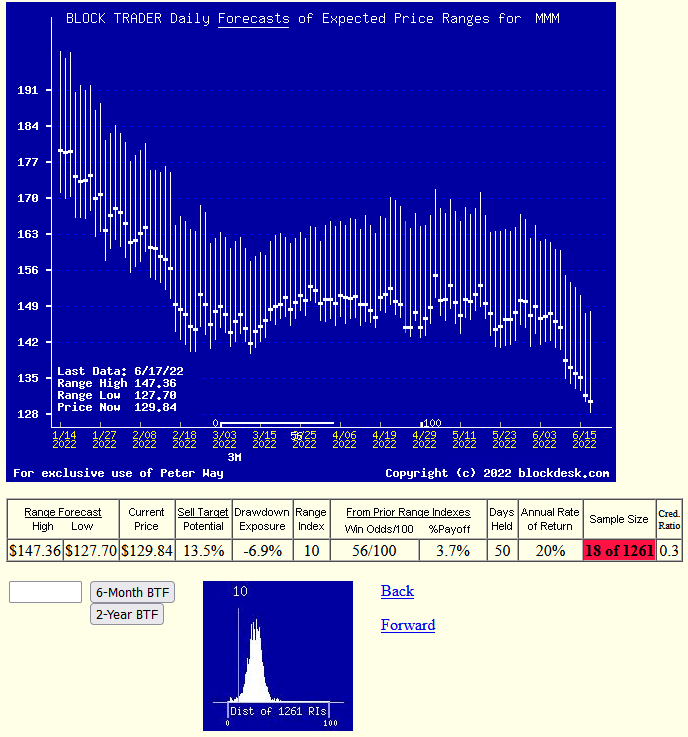
(used with permission)
Figure 4
blockdesk.com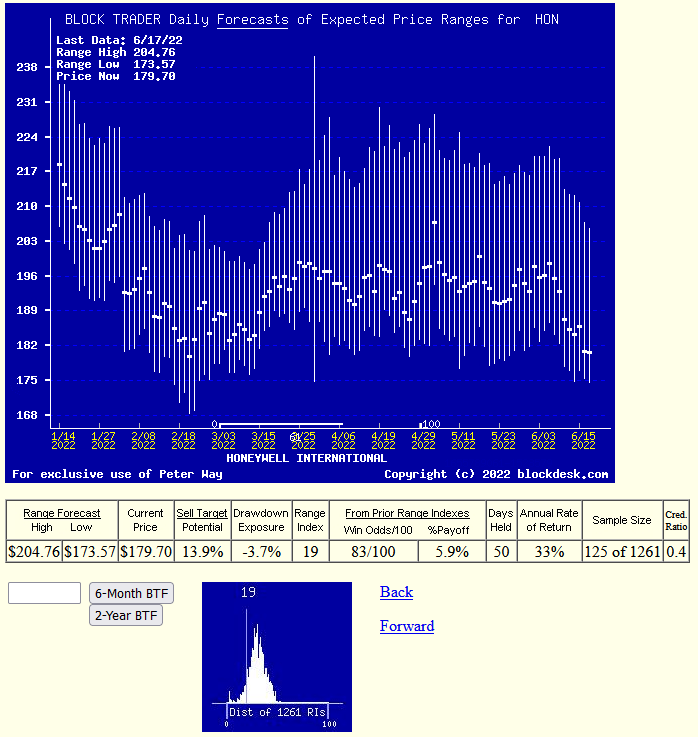
(used with permission)
Many investors confuse any time-repeating picture of stock prices with typical “technical analysis charts” of past stock price history. These are quite different in their content. Instead, here Figures 3 and 4’s vertical lines are a daily-updated visual record of price range forecast limits expected in the coming few weeks and months. The heavy dot in each vertical is the stock’s closing price on the day the forecast was made.
That market price point makes an explicit definition of the price reward and risk exposure expectations which were held by market participants at the time, with a visual display of their vertical balance between risk and reward.
The measure of that balance is the Range Index (RI). Here in HON, the current market price of $179 is above the lowest forecast price (of $174) making up 19% of the whole forecast range from $174 to $205.
With today’s RI there is 14% upside price change in prospect and less than -4% downside. Of the prior 126 forecasts like today’s RI, 83% have been profitable. The market’s actions of prior forecasts became accomplishments of +6% gains in 50 market days.. So history’s advantage could be repeated five times a 252 market-day year, which compounds into a CAGR of +33%, 1 2/3rds of the CAGR of MMM.
Conclusion
Based on direct comparisons with MMM and other alternatives often considered by individual investors, there are several clear reasons to prefer a capital-gain seeking buy in Honeywell International, Inc.
An active investment response would be to swap capital out of MMM into HON, anywhere the principal is sheltered from taxation by its portfolio circumstances.
Be the first to comment