

The stock market really is inefficient! AntonioGuillem/iStock via Getty Images
Get ready for charts, images, and tables because they are better than words. The ratings and outlooks we highlight here come after Scott Kennedy’s weekly updates in the REIT Forum. Your continued feedback is greatly appreciated, so please leave a comment with suggestions.
This weekend I want to help investors with an understanding how to pick between similar shares. However, first I know investors are going to want a handful of picks for shares that are currently looking pretty cheap.
Preferred Shares
It had been a long time since we owned shares of NLY-G (NLY.PG). Specifically, we had dumped our prior position on 10/5/2020 at $21.19. We earned a respectable return (about 6%) on the brief investment (less than 4 months) in NLY-G. At the time, we felt there were several other preferred shares offering a more attractive risk/reward profile. However, today shares of NLY-G are quite attractive again. We bought shares between $19.71 and $19.75 on 6/28/2022. The increased appeal today is due to a few factors, including the higher short-term rates making the floating feature more attractive. We’ve also seen the ratio between the share price for NLY-G and the other preferred shares from AGNC and NLY take a dive.
In my view, it was surprising that NLY-G often traded at a price very similar to NLY-I (NLY.PI) and NLY-F (NLY.PF). If the shares were the same price, I would absolutely take NLY-I or NLY-F over NLY-G. However, currently the difference is $1.46 for NLY-I and $2.16 for NLY-F. That’s a big enough discount to get interested in NLY-G.
We’ve written about swapping between the shares quite a few times over the years. For instance, we wrote this article about swapping in February 2021:
The REIT Forum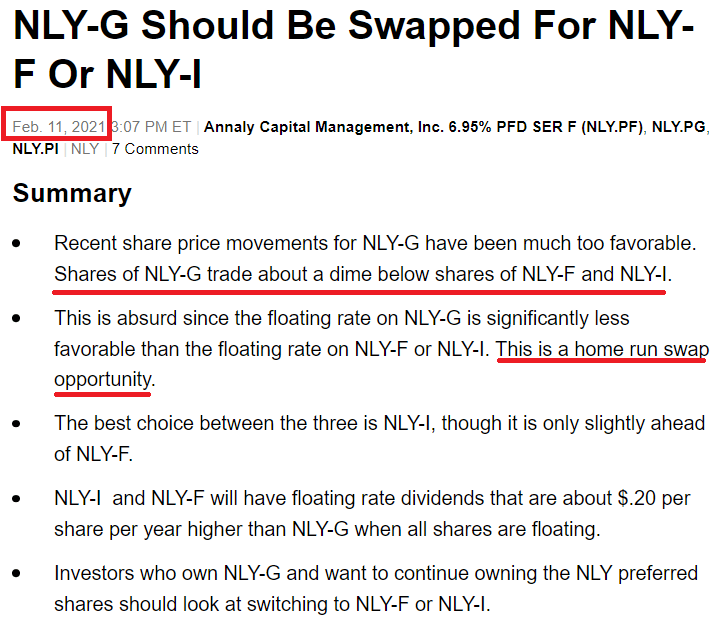
Since the difference in share prices was about $.10, investors in NLY-G could get a very cheap upgrade into NLY-F or NLY-I. That was a great deal and any investor who refused to take it (assuming no massive capital gains tax) was simply refusing an easy opportunity to enhance their risk/reward profile. The importance of this has been hammered home as shares of NLY-F dropped by $2.49, NLY-I dropped by $3.08, and NLY-G dropped by $4.53. Some investors will want to argue that “it’s not a real loss because I didn’t sell”. I hear that all the time and I understand that there is a bit of price volatility. However, an investor who paid the extra $.10 to upgrade their shares is in a much better position. If they still want NLY-G, they can swap back to NLY-G and each share is significantly cheaper. That’s simply better.
We didn’t want NLY-G when it was expensive compared to peers. However, we do like it now. That’s the impact of a lower price. We were never concerned about NLY failing, but we did want to make intelligent decisions about how to optimize our risk/reward position.
With shares of NLY-G being so much cheaper today, we recently picked up 1,608 shares:
Charles Schwab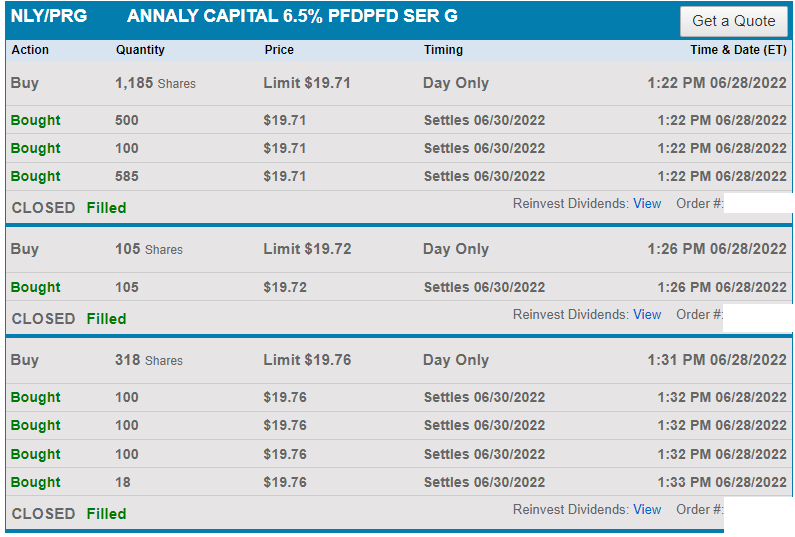
These are my open positions in the preferred shares as of 07/01/2022:
The REIT Forum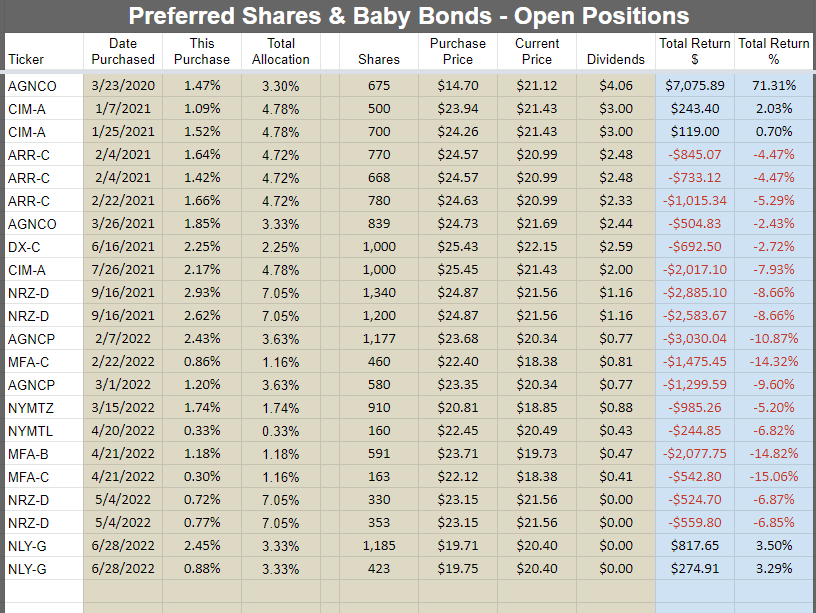
We’re up on some positions and down on others, but the major preferred share ETF we track for comparison was down 14.7% year-to-date. In that context, it’s not surprising that many of our positions are currently down. I expect each of these shares will recover.
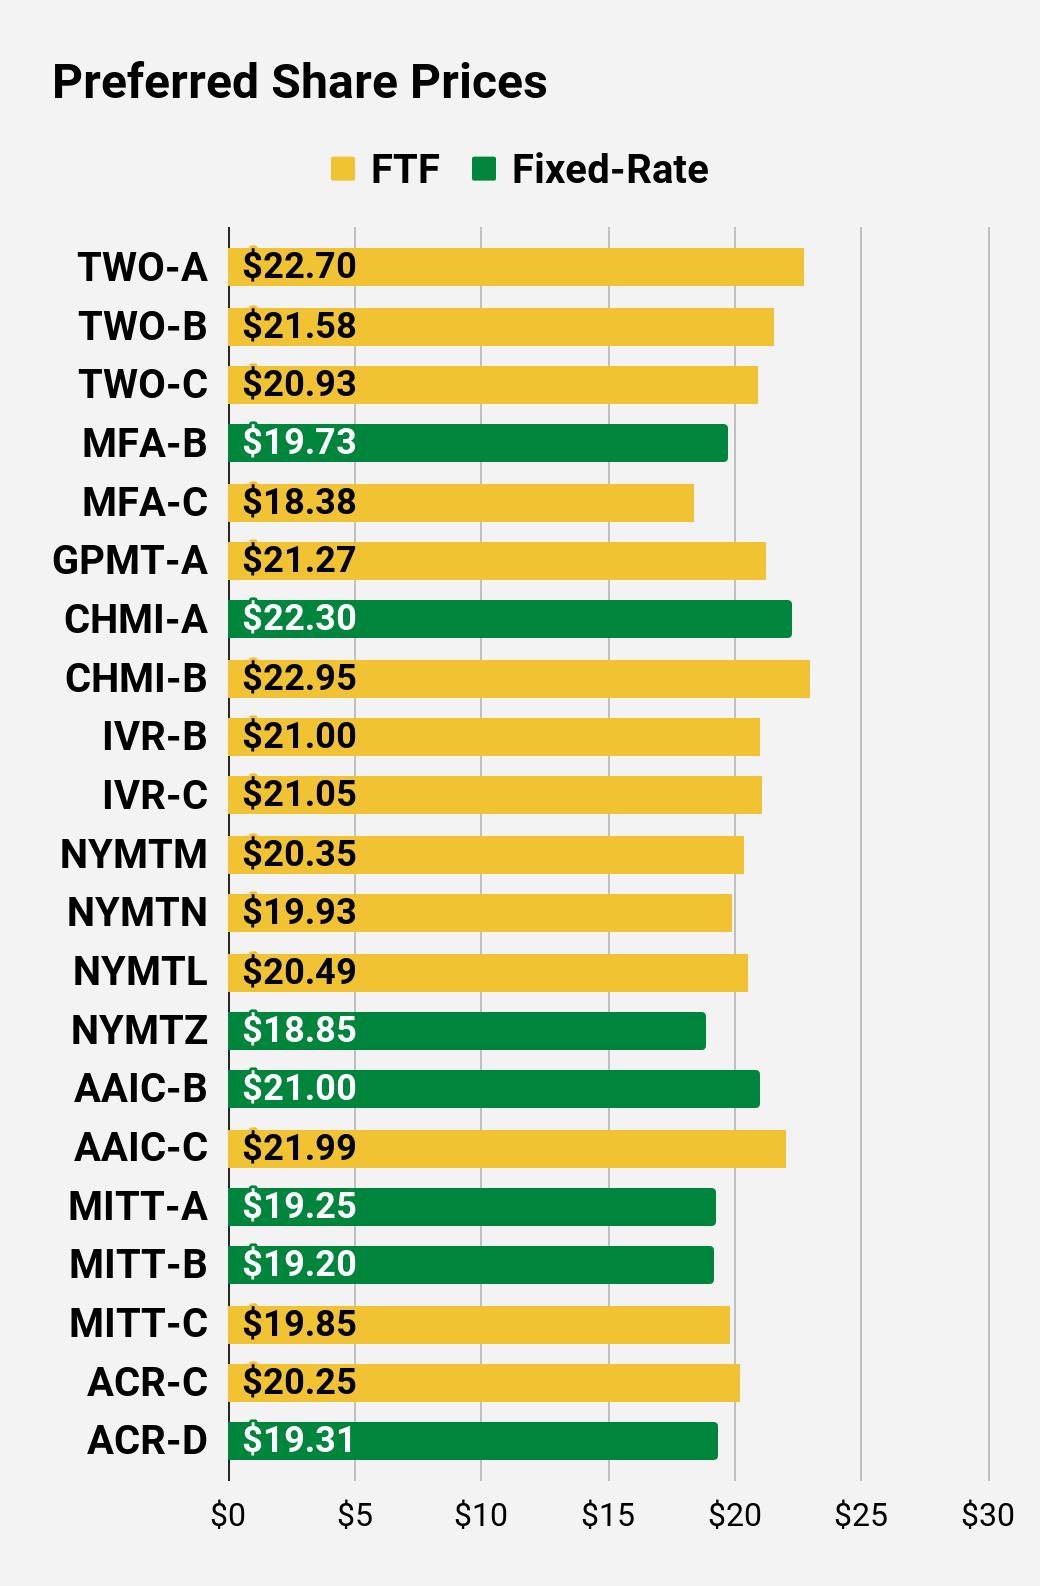
You may notice my largest dip comes from positions in MFA-B (MFA.PB) and MFA-C (MFA.PC). I think both of these shares are significantly undervalued right now. MFA-B has a fixed-rate dividend. Some investors see interest rates rising and believe MFA-B must trade at a lower price to carry a higher yield. However, I believe the current weakness in the share price is primarily about economic fears.
Let’s examine the facts. In late 2018, the 10-year Treasury rate was higher than it is today. On November 5th, 2018, the 10-year Treasury yield was 3.2%. Recently the 10-year Treasury closed at 2.89%. As we recall from elementary school, 3.2 is bigger than 2.89. Therefore, if investors were dumping MFA-B because they don’t want a fixed-rate share with Treasury yields around 3%, they are a few years late:
Seeking alpha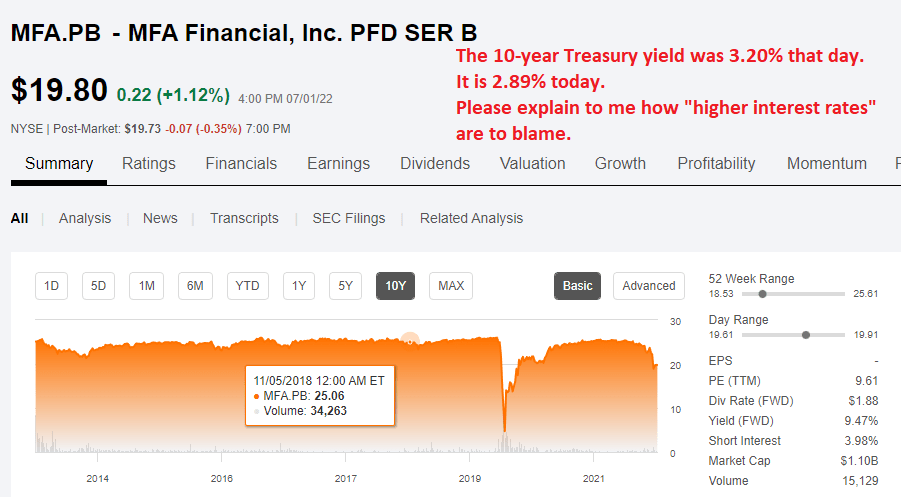
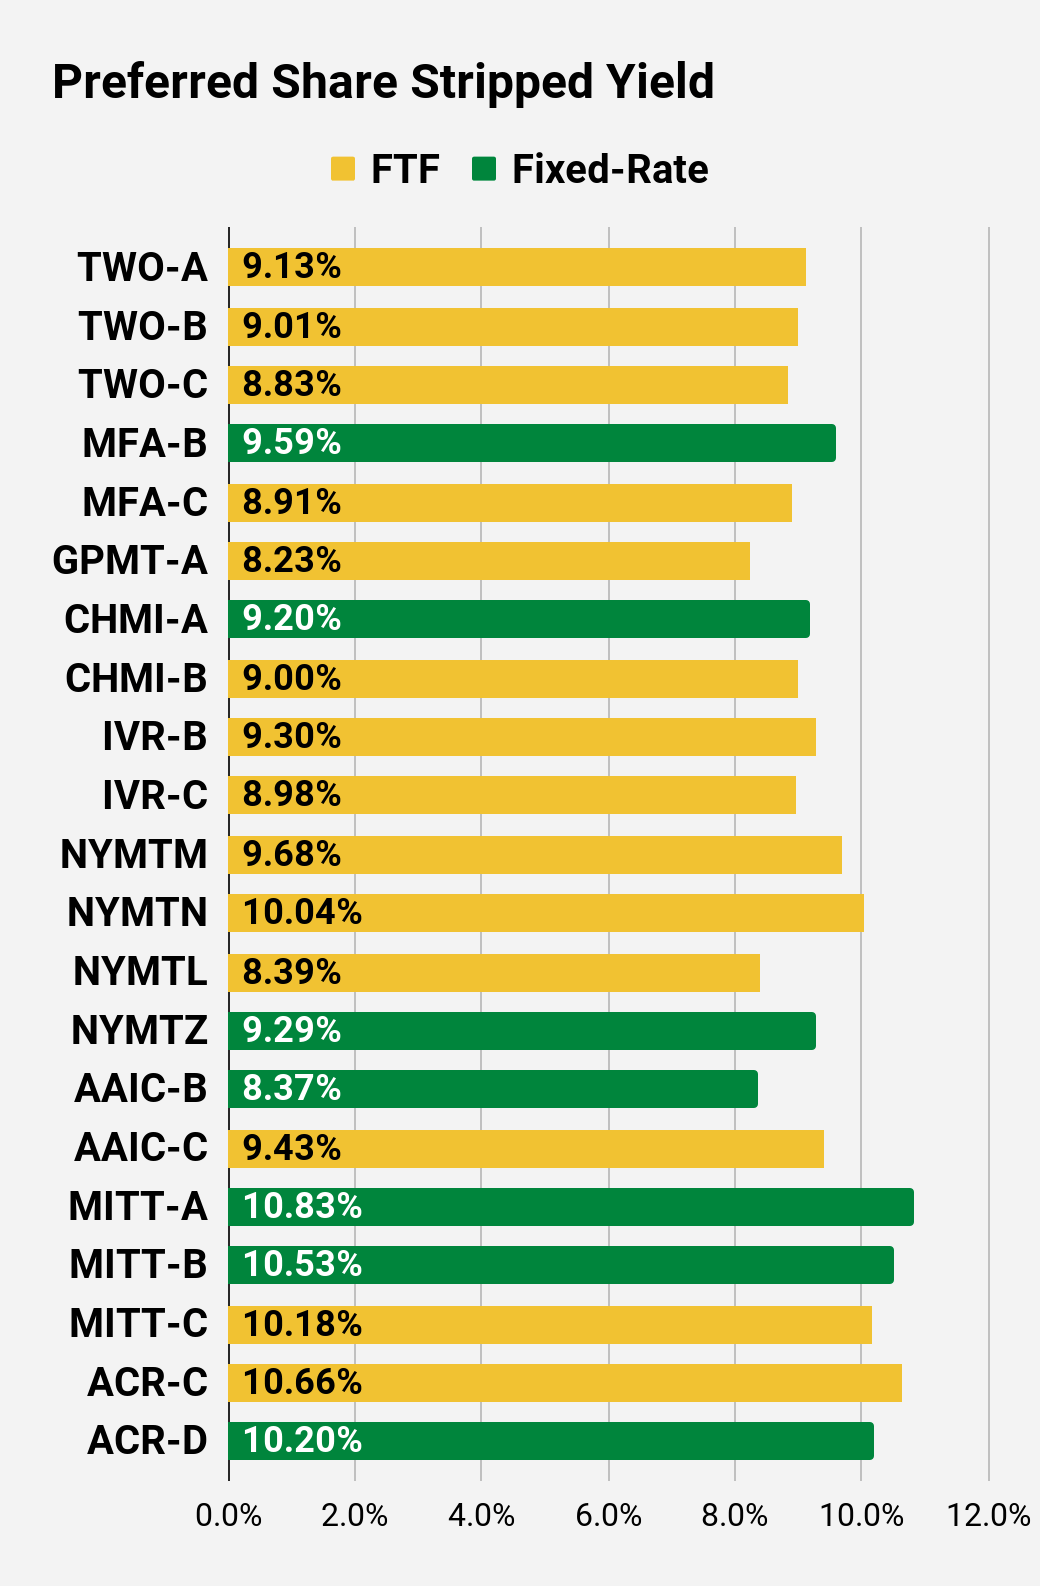
MFA-B traded above $25.00 when the 10-year Treasury was at 3.2%. So, arguing that MFA-B “should” have a stripped yield around 9.6% based on interest rates is absurd. The end. No room for argument on that point.
The reasonable argument must be based on fears about a recession and a widening of credit spreads. While a recession is a little bit scary, it’s a recession brought on by the Federal Reserve raising interest rates to create a recession. This isn’t a global financial crisis. This isn’t the pandemic. The recession is probably here already, but MFA isn’t falling apart. Lower book value? Sure. Lower share price? Clearly. But they are far from failing.
For a floating rate, investors can use MFA-C instead. They get a lower fixed-rate dividend until 3/31/2025, then the floating-rate kicks in. If interest rates are still elevated, MFA-B would see a significant increase in their dividend rate. For a share that already has an 8.9% stripped yield, a dividend increase only make it better. With both shares trading below $20.00, they also offer investors the potential for a significant capital gain.
If MFA-B recovered to $24.00 over the next two years, it would represent a 21% gain on the share price in addition to the 9.6% stripped yield per year. That leads to a potential total return of about 40% over the next two years. Not too shabby for a preferred share. If interest rates stay higher causing investors to favor MFA-C for the floating rate, the upside would be even higher. My view? I own shares of both.
Can Buy and Hold Investors Buy Preferred Shares?
Absolutely. They need to be willing to accept that a call could happen at some point, but in my experience, most buy-and-hold investors are okay with that. We encourage them to also consider using the occasional swap between two very similar shares. If the share prices are favorable for executing the swap, it can give the investor more income and more upside.
Perhaps NLY-G should be labeled as having the “smallest” amount of upside for trading at $20.40? That’s still a healthy amount of upside given the way investors valued shares previously combined with a big dividend yield. I don’t expect to hold the shares indefinitely. Based on prior valuations, I expect the market will return to valuing NLY-G at a much smaller discount to the other preferred shares from NLY or AGNC. When that happens, I would have no problem with swapping between the shares to take advantage of the swing. We entered NLY-G because it had finally dumped to the point that trading into NLY-G was favorable.
We warn investors away from using most high-yield common shares as buy-and-hold investments because there are just too many opportunities where it doesn’t make sense. However, they may find the preferred shares a much better fit.
The rest of the charts in this article may be self-explanatory to some investors. However, if you’d like to know more about them, you’re encouraged to see our notes for the series.
Stock Table
We will close out the rest of the article with the tables and charts we provide for readers to help them track the sector for both common shares and preferred shares.
We’re including a quick table for the common shares that will be shown in our tables:
Let the images begin!
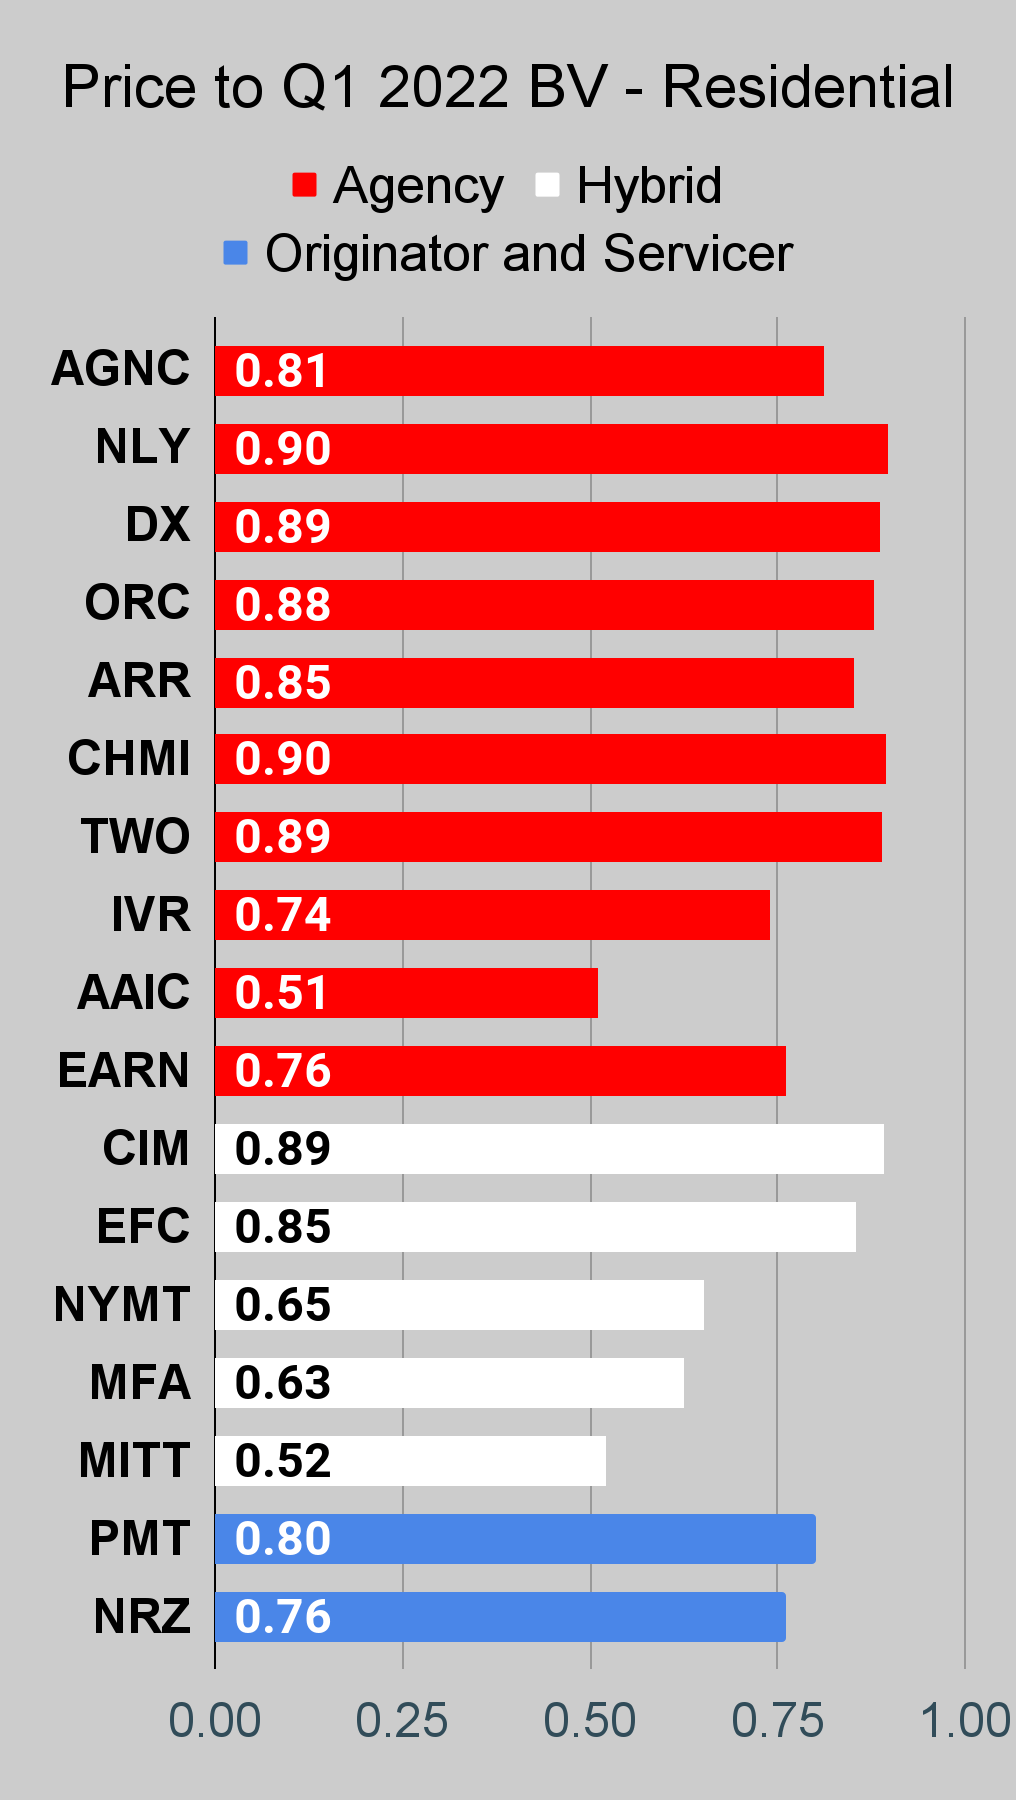
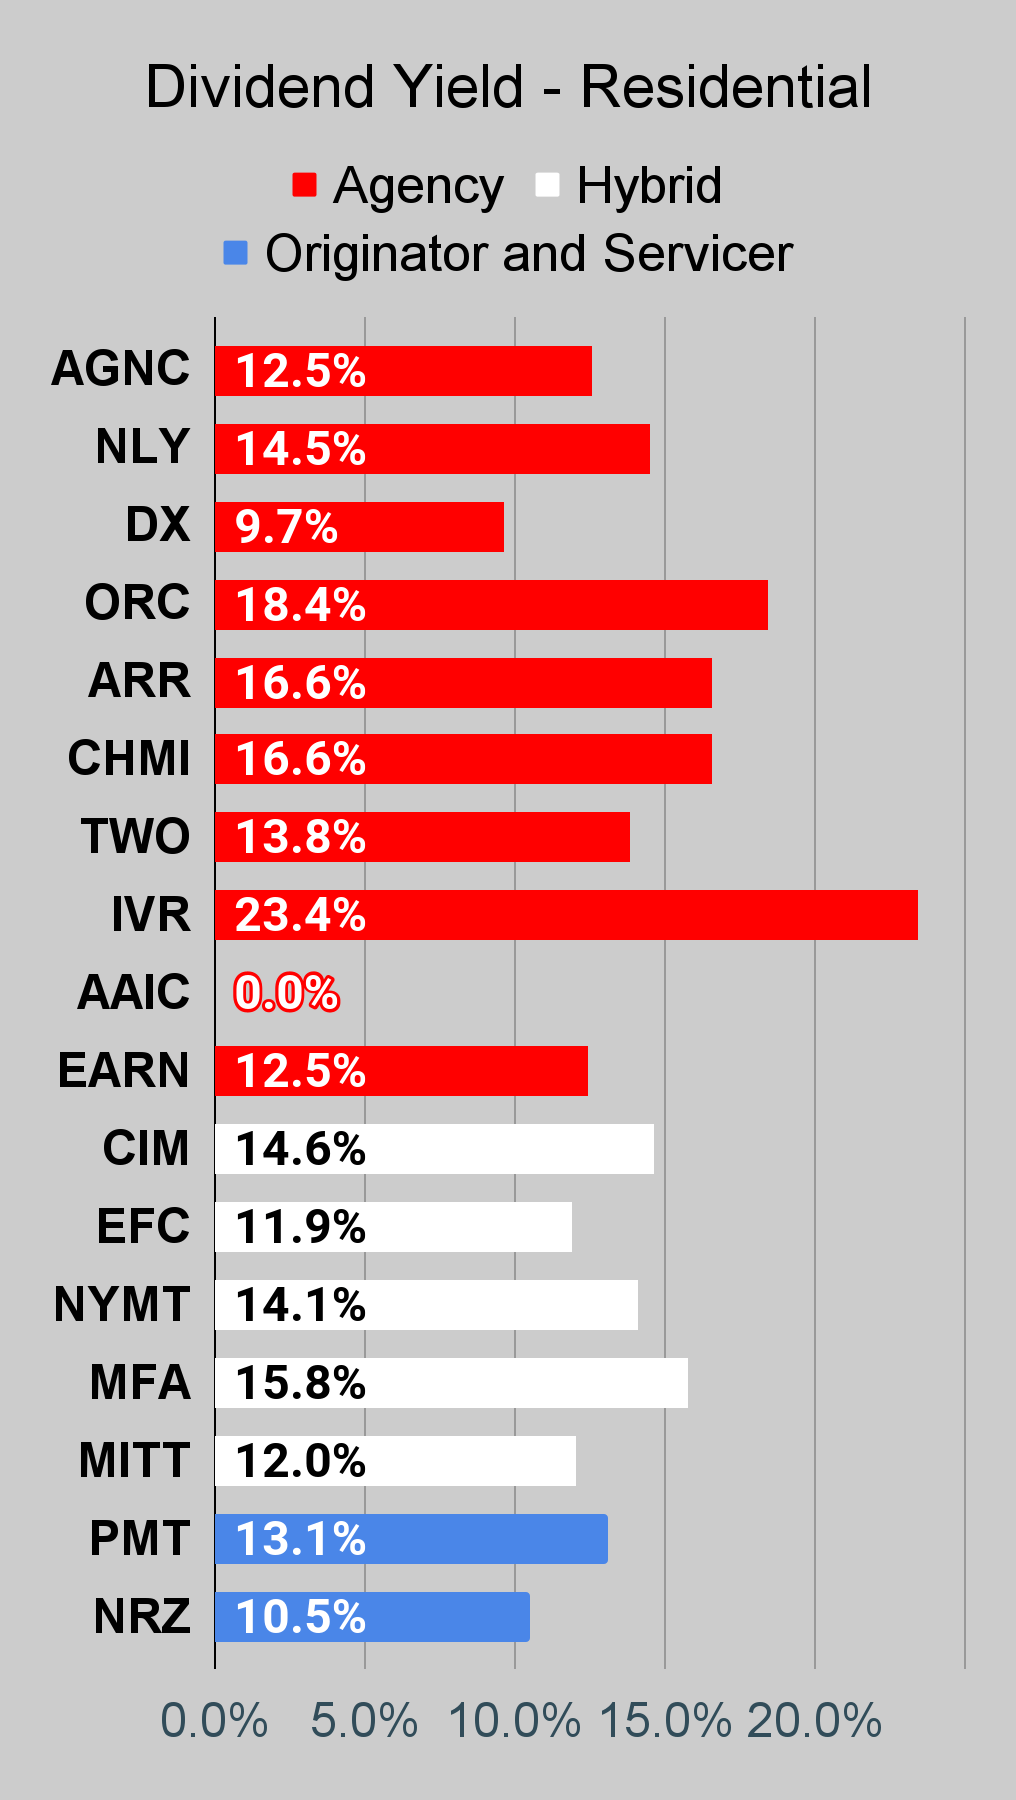
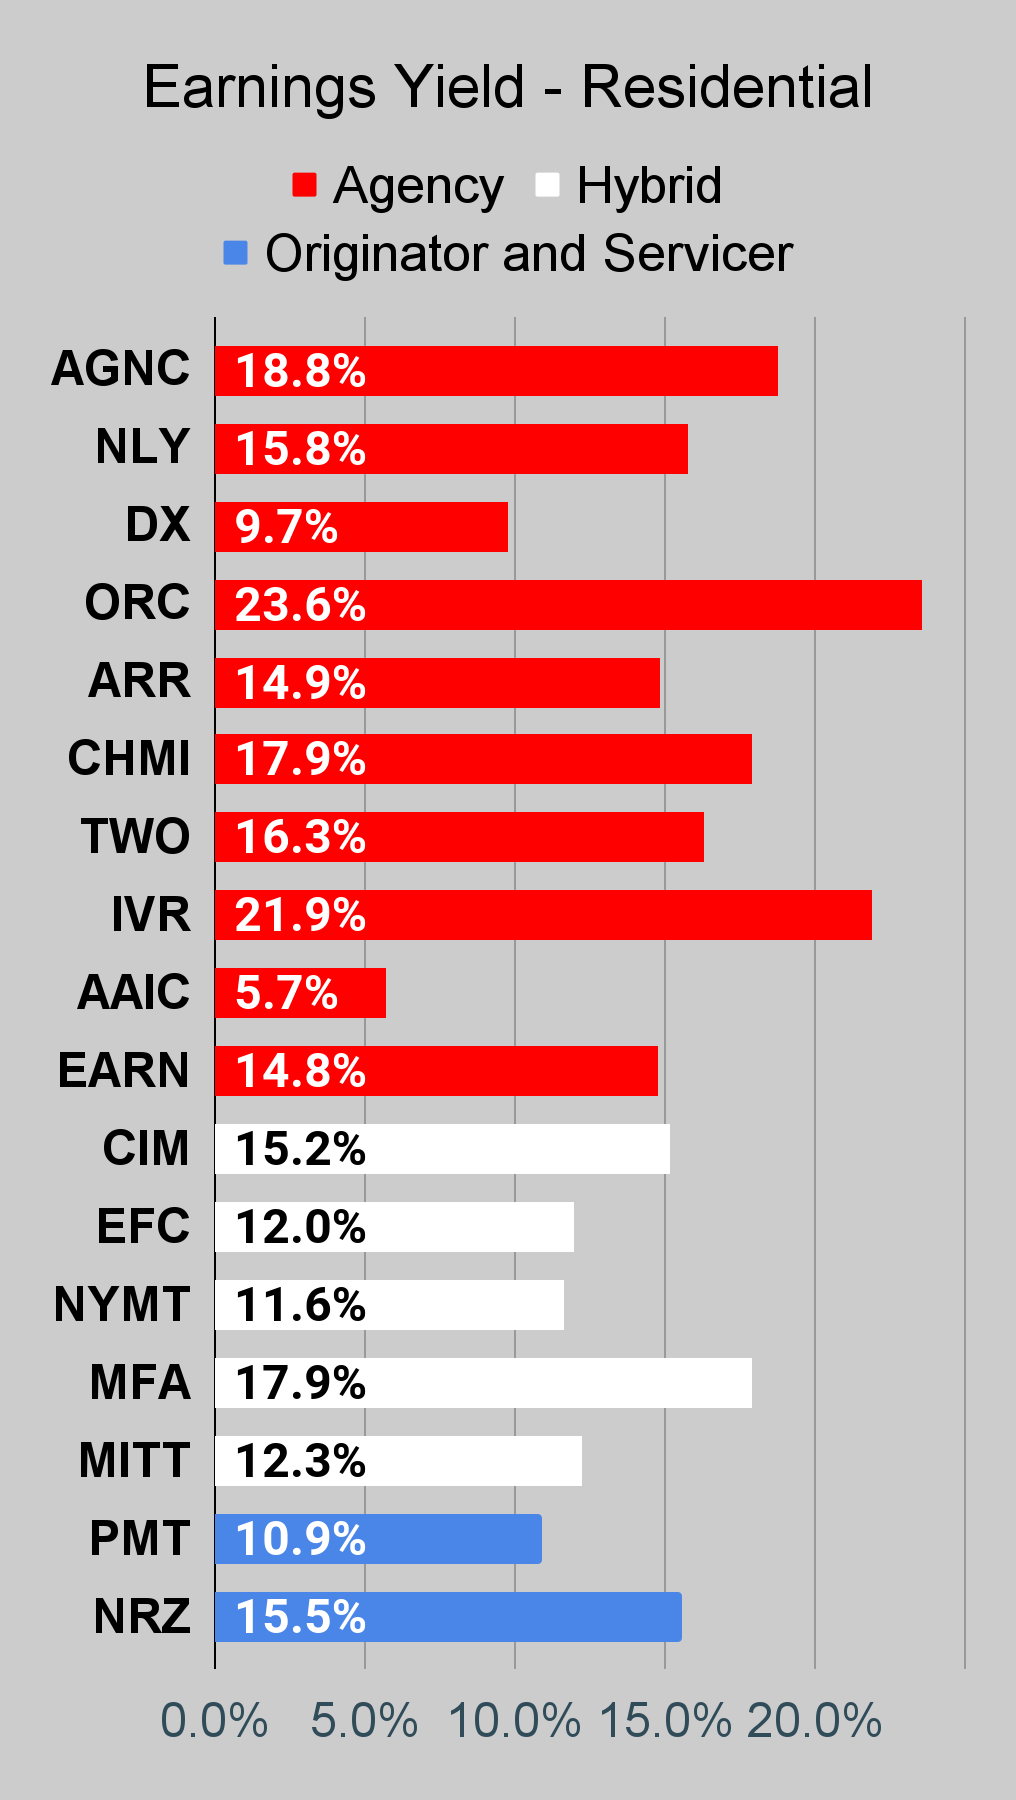
Residential Mortgage REIT Charts
Note: The chart for our public articles uses the book value per share from the latest earnings release. Current estimated book value per share is used in reaching our targets and trading decisions. It is available in our service, but those estimates are not included in the charts below.
 The REIT Forum |
 The REIT Forum |
 The REIT Forum |
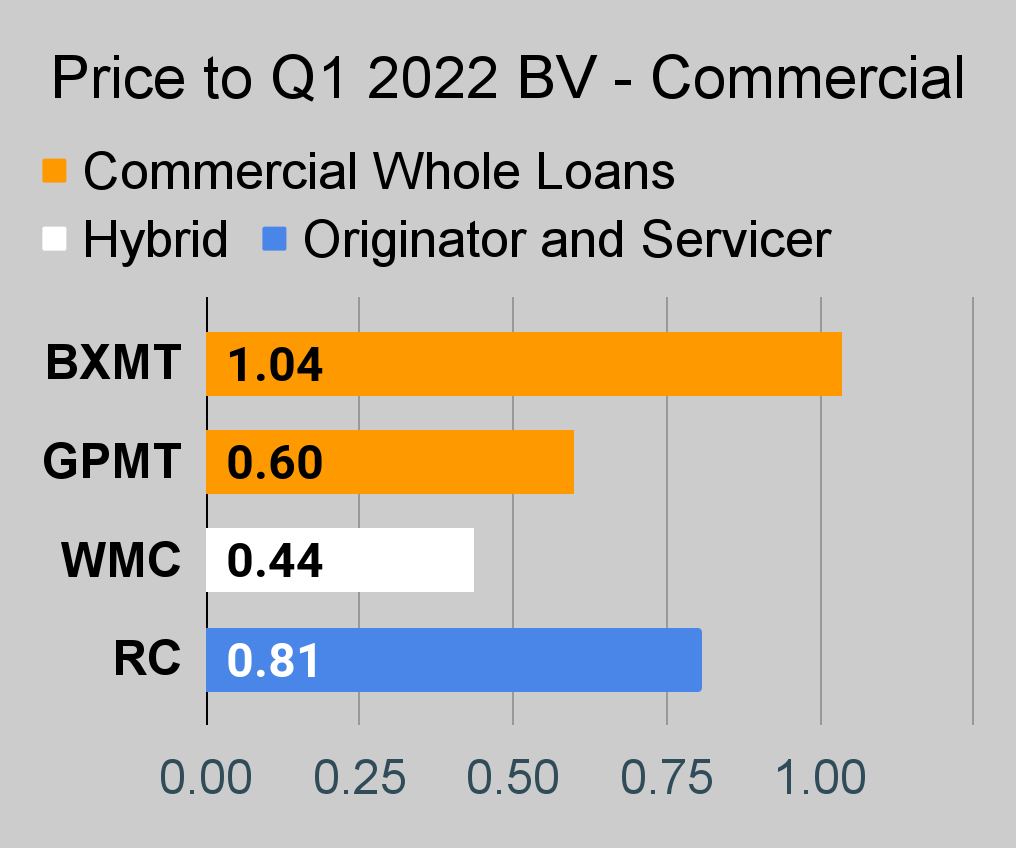
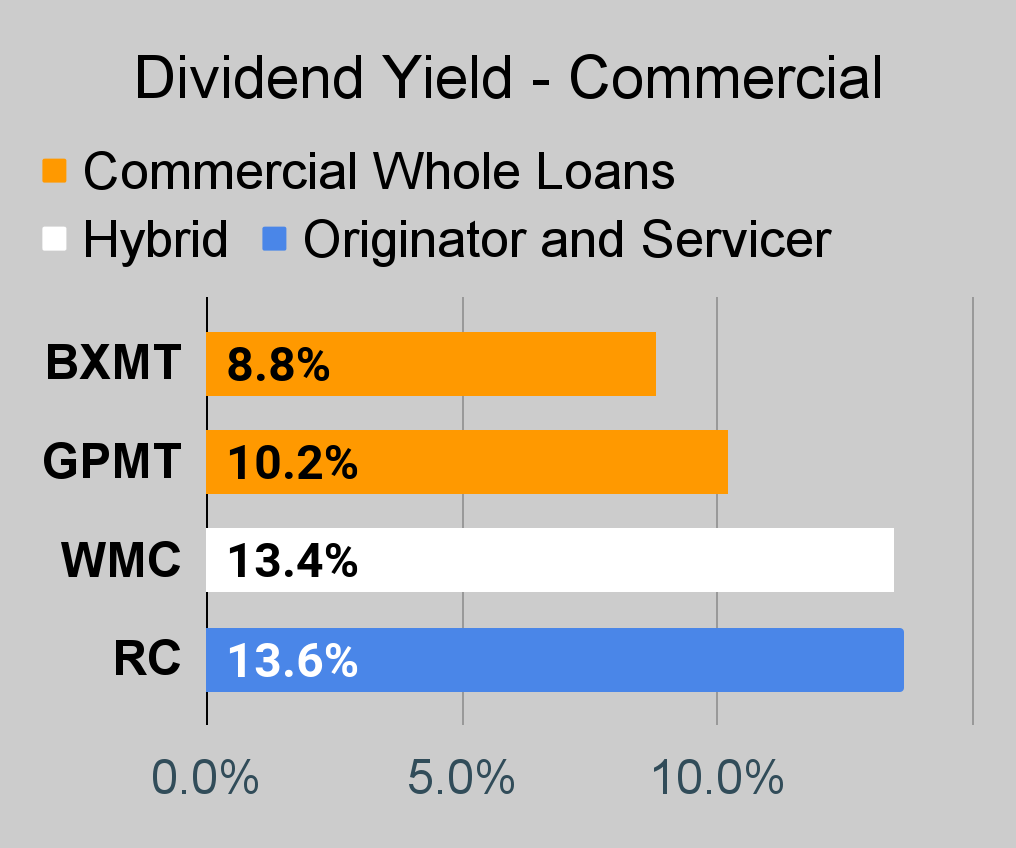
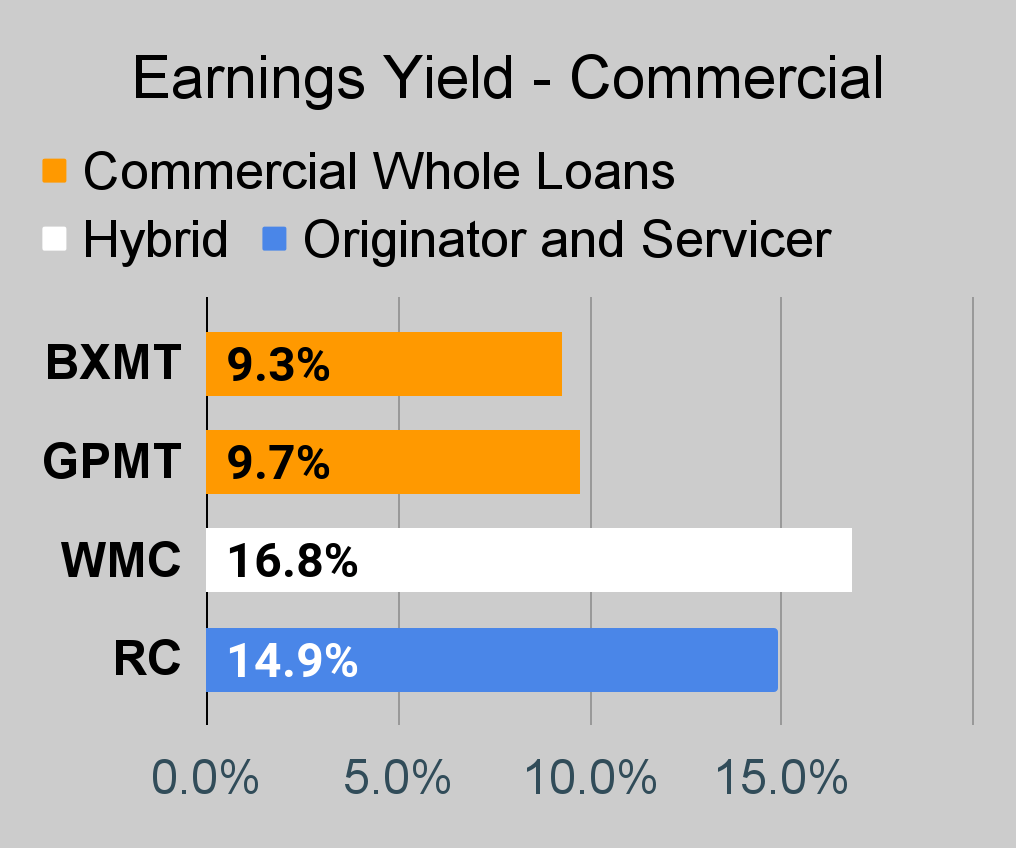
Commercial Mortgage REIT Charts
 The REIT Forum |
 The REIT Forum |
 The REIT Forum |
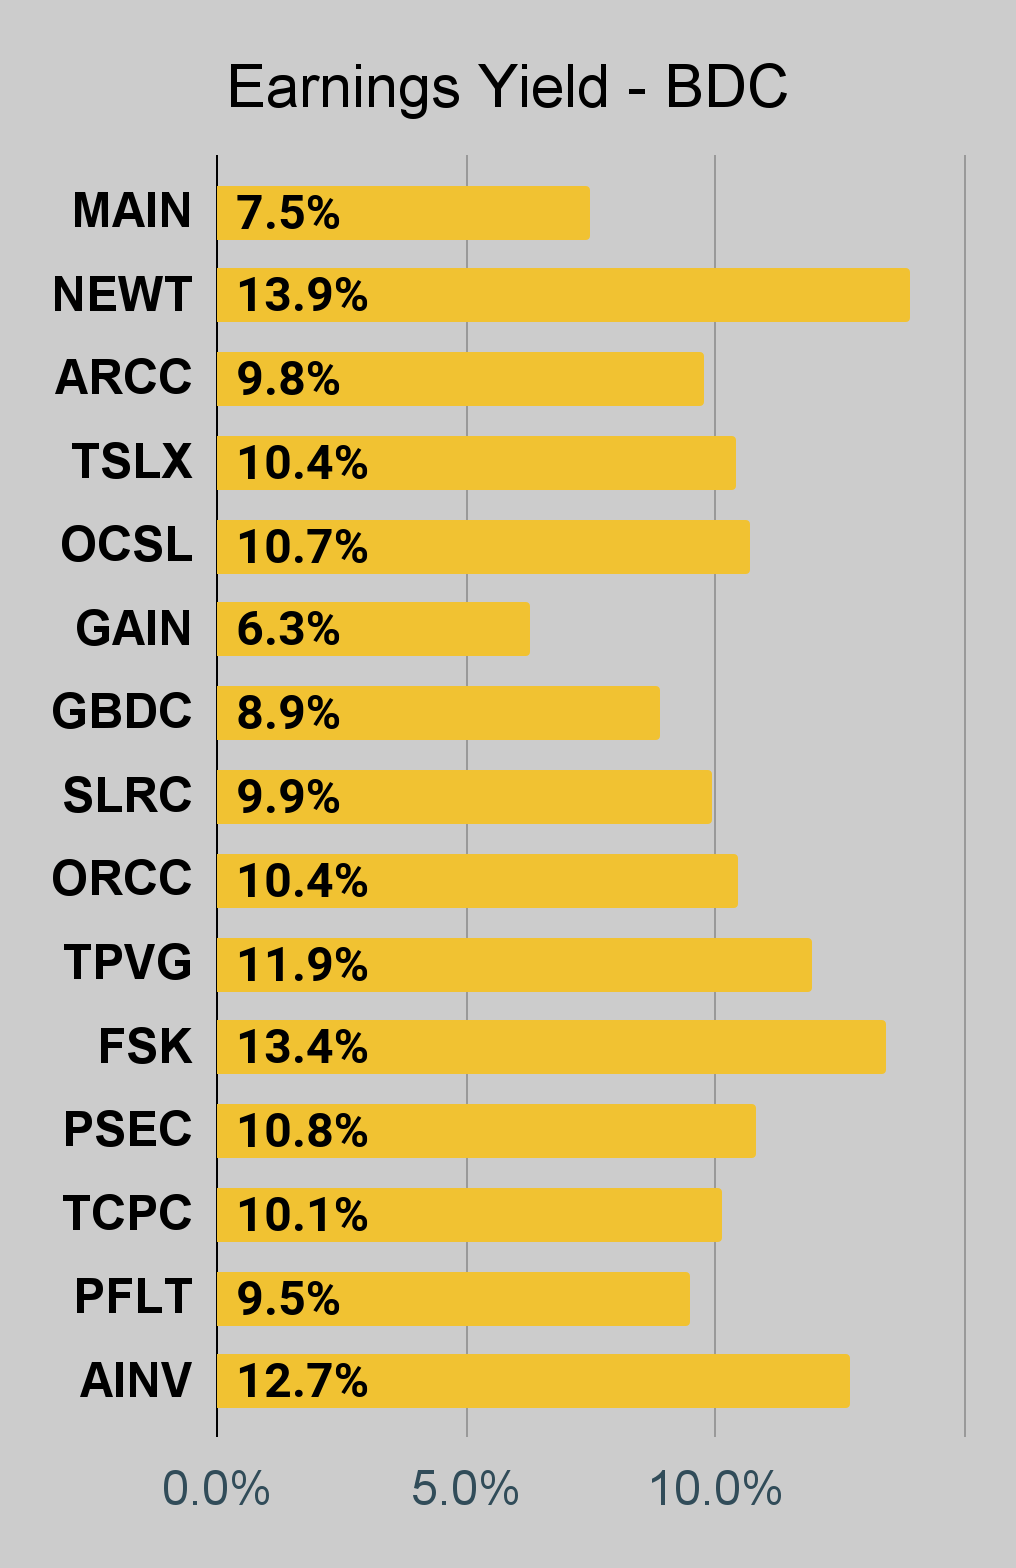
BDC Charts
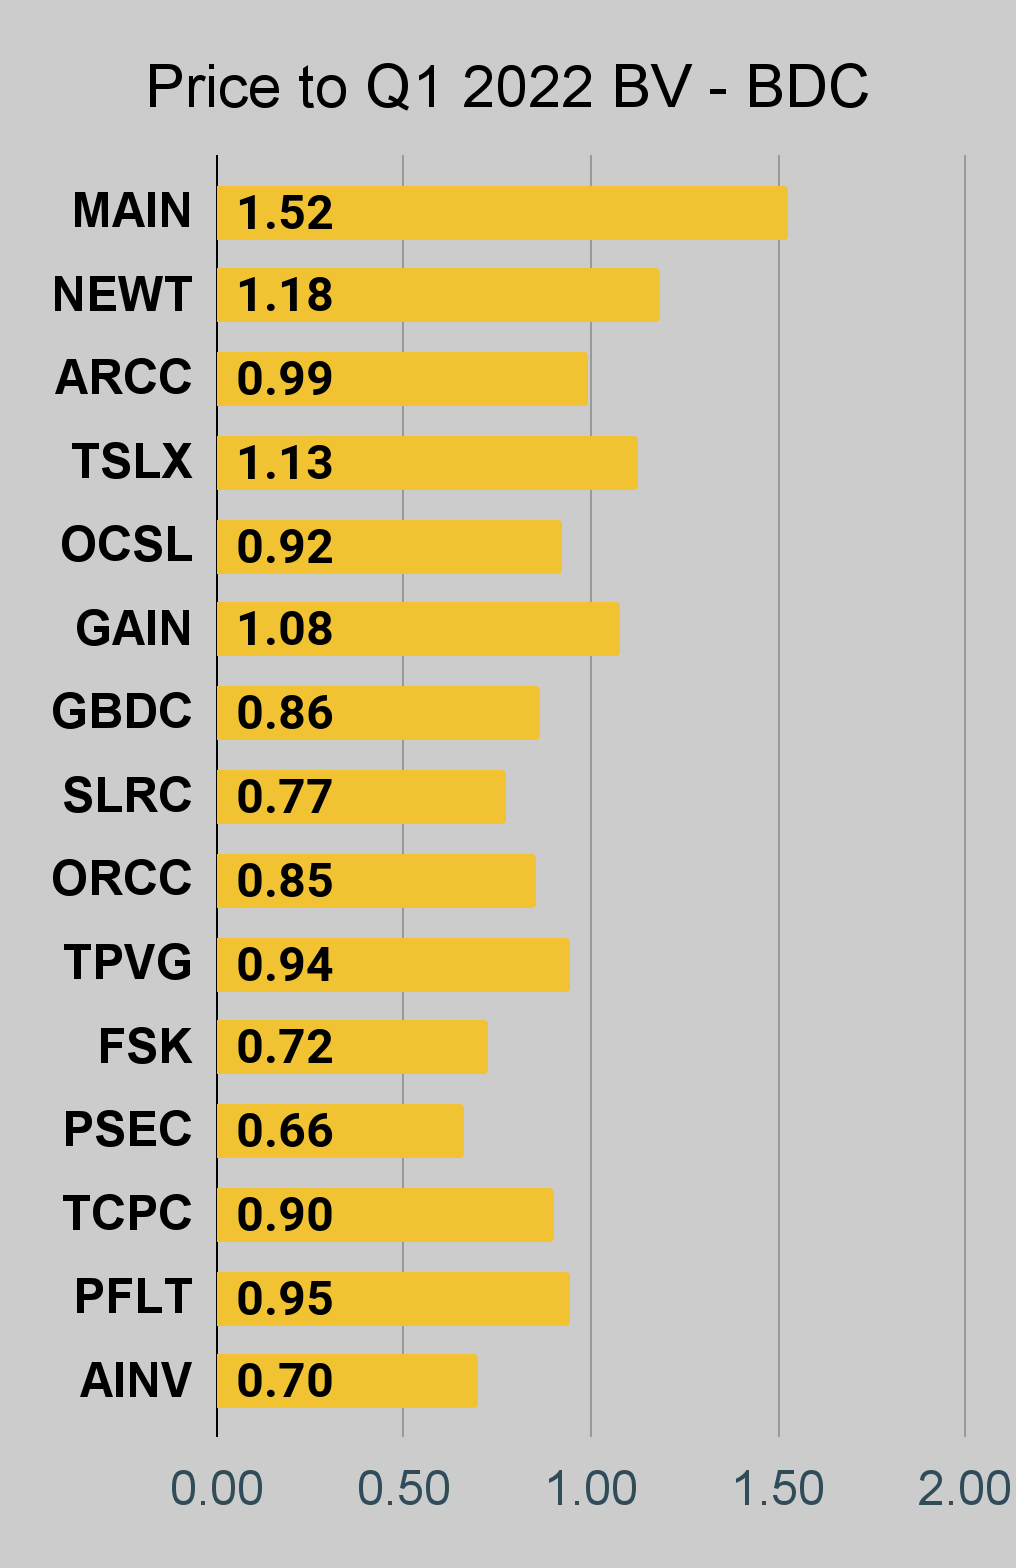 The REIT Forum |
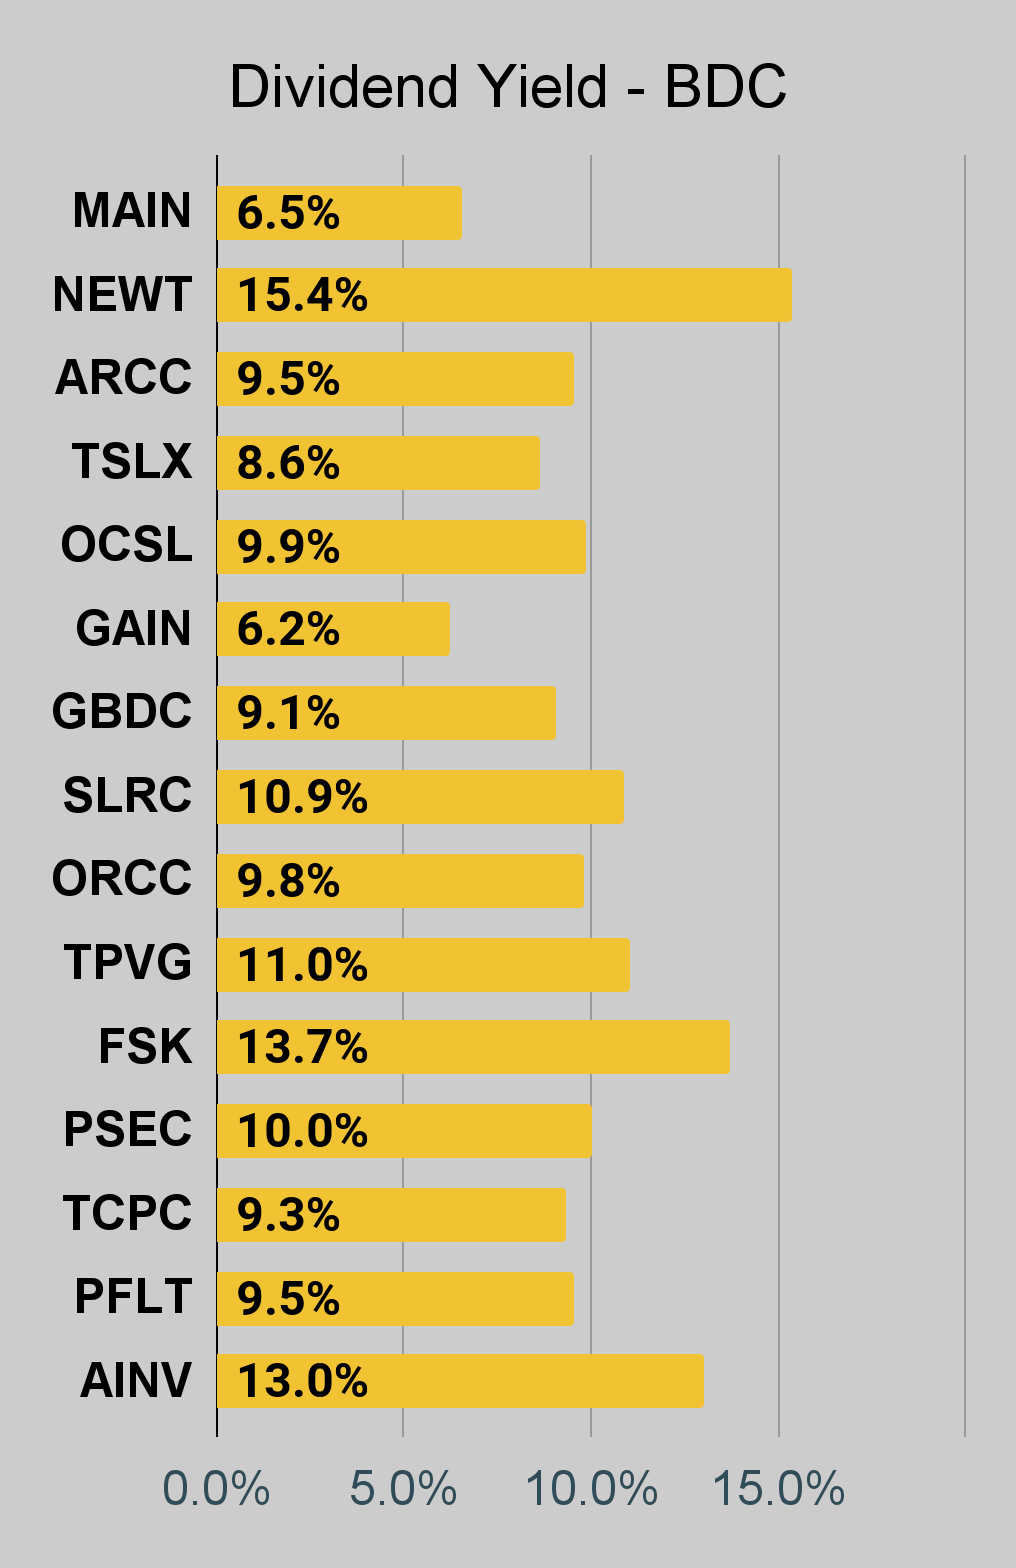 The REIT Forum |
 The REIT Forum |
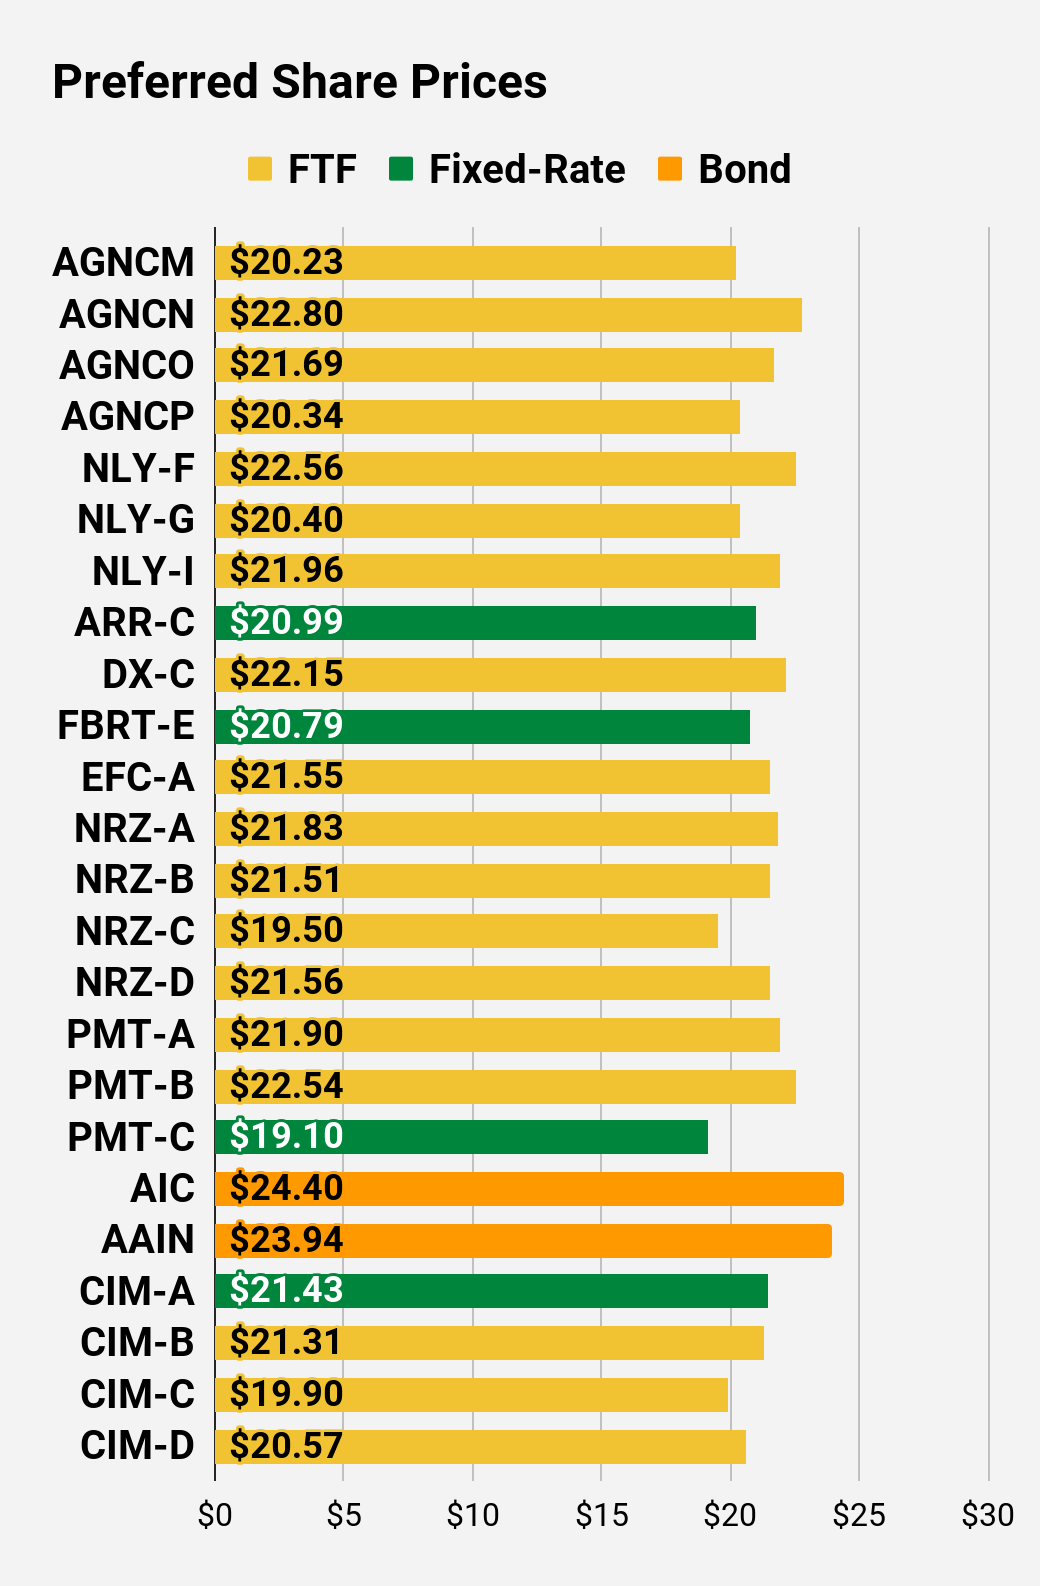
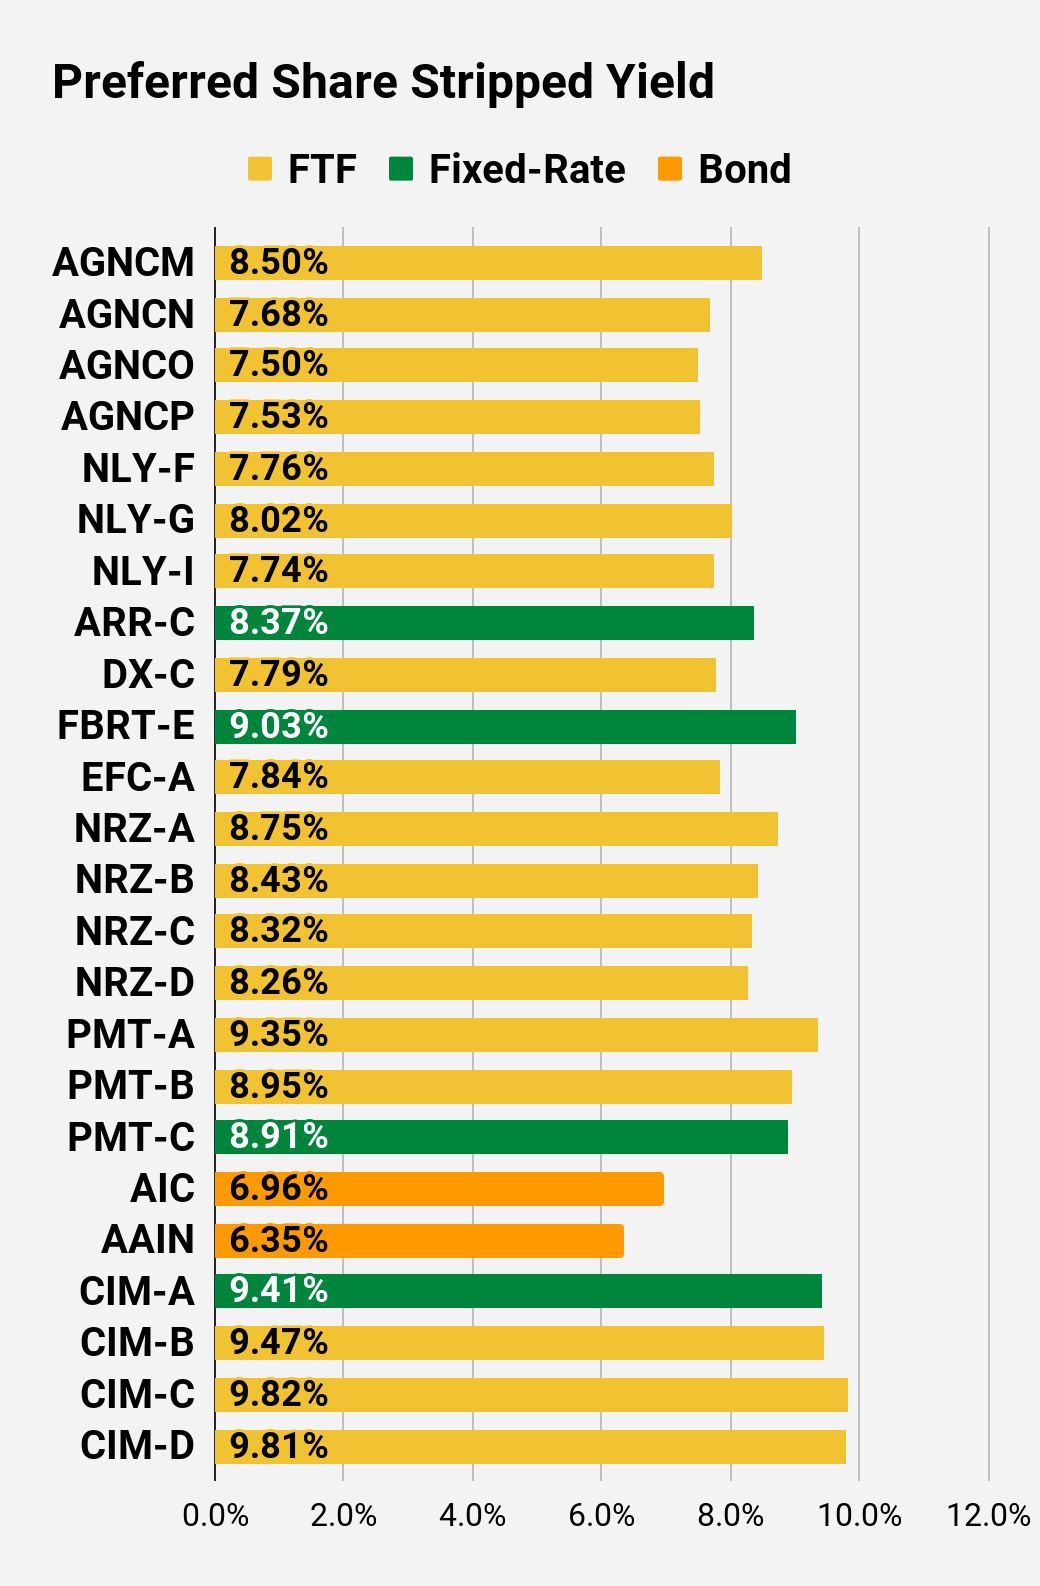
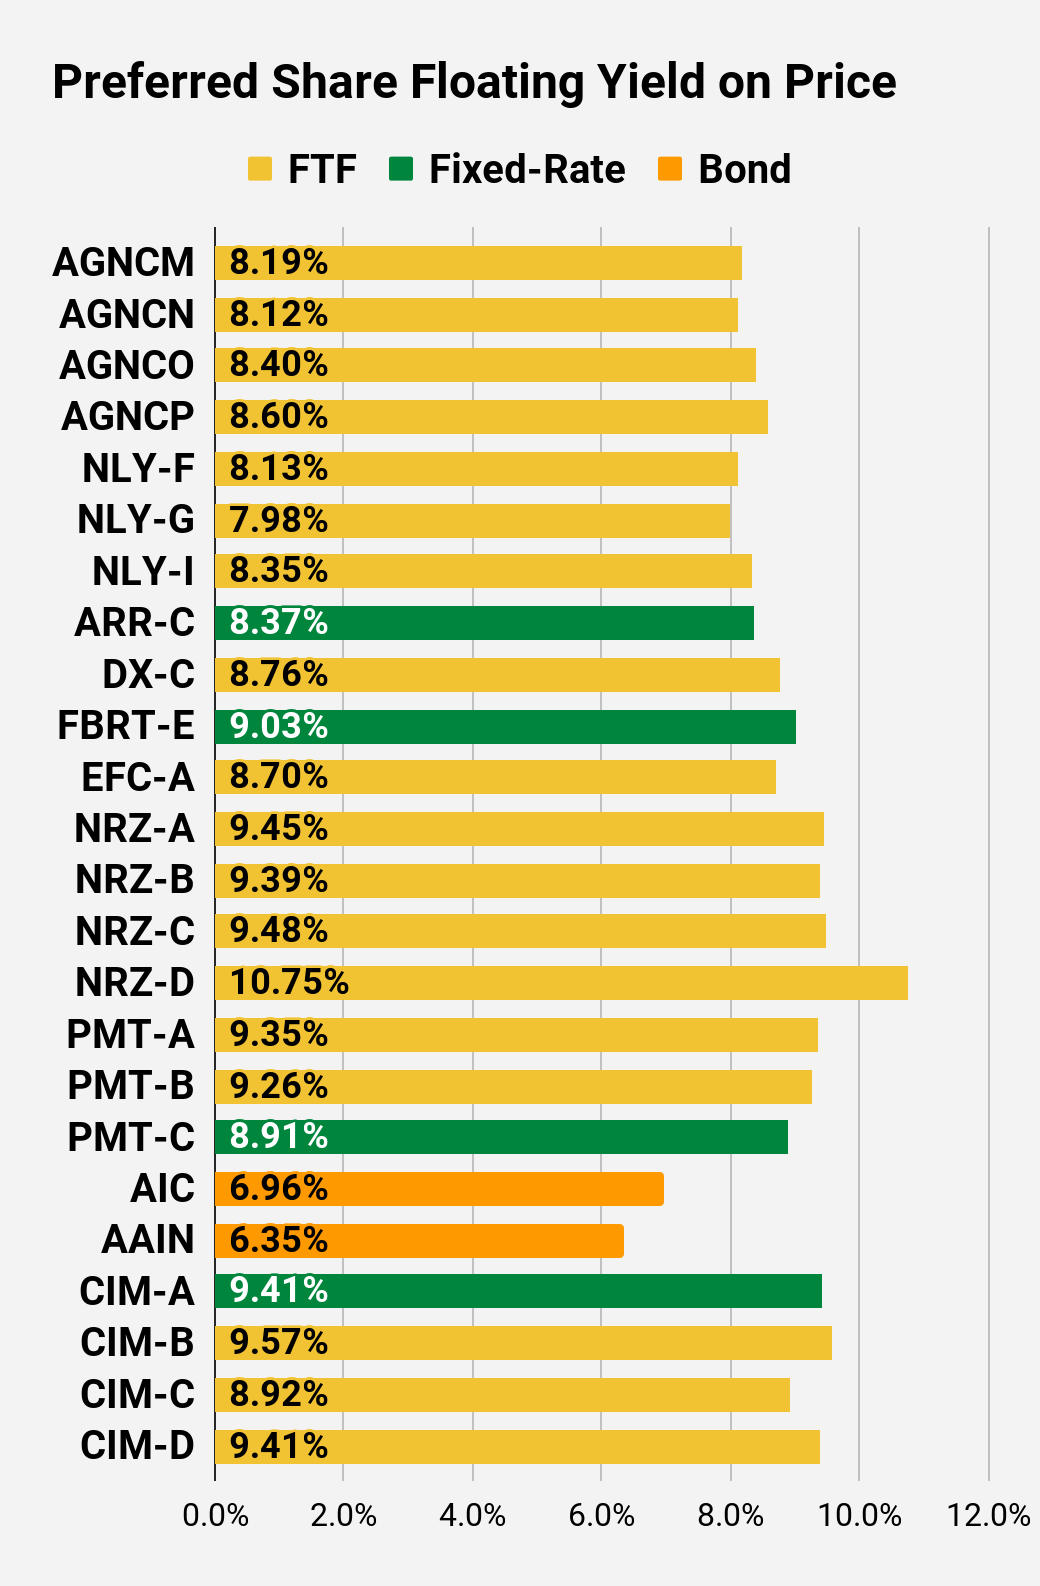
Preferred Share Charts
 The REIT Forum |
 The REIT Forum |
 The REIT Forum |
 The REIT Forum |
 The REIT Forum |
 The REIT Forum |
Preferred Share Data
Beyond the charts, we’re also providing our readers with access to several other metrics for the preferred shares.
After testing out a series on preferred shares, we decided to try merging it into the series on common shares. After all, we are still talking about positions in mortgage REITs. We don’t have any desire to cover preferred shares without cumulative dividends, so any preferred shares you see in our column will have cumulative dividends. You can verify that by using Quantum Online. We’ve included the links in the table below.
To better organize the table, we needed to abbreviate column names as follows:
- Price = Recent Share Price – Shown in Charts
- BoF = Bond or FTF (Fixed-to-Floating)
- S-Yield = Stripped Yield – Shown in Charts
- Coupon = Initial Fixed-Rate Coupon
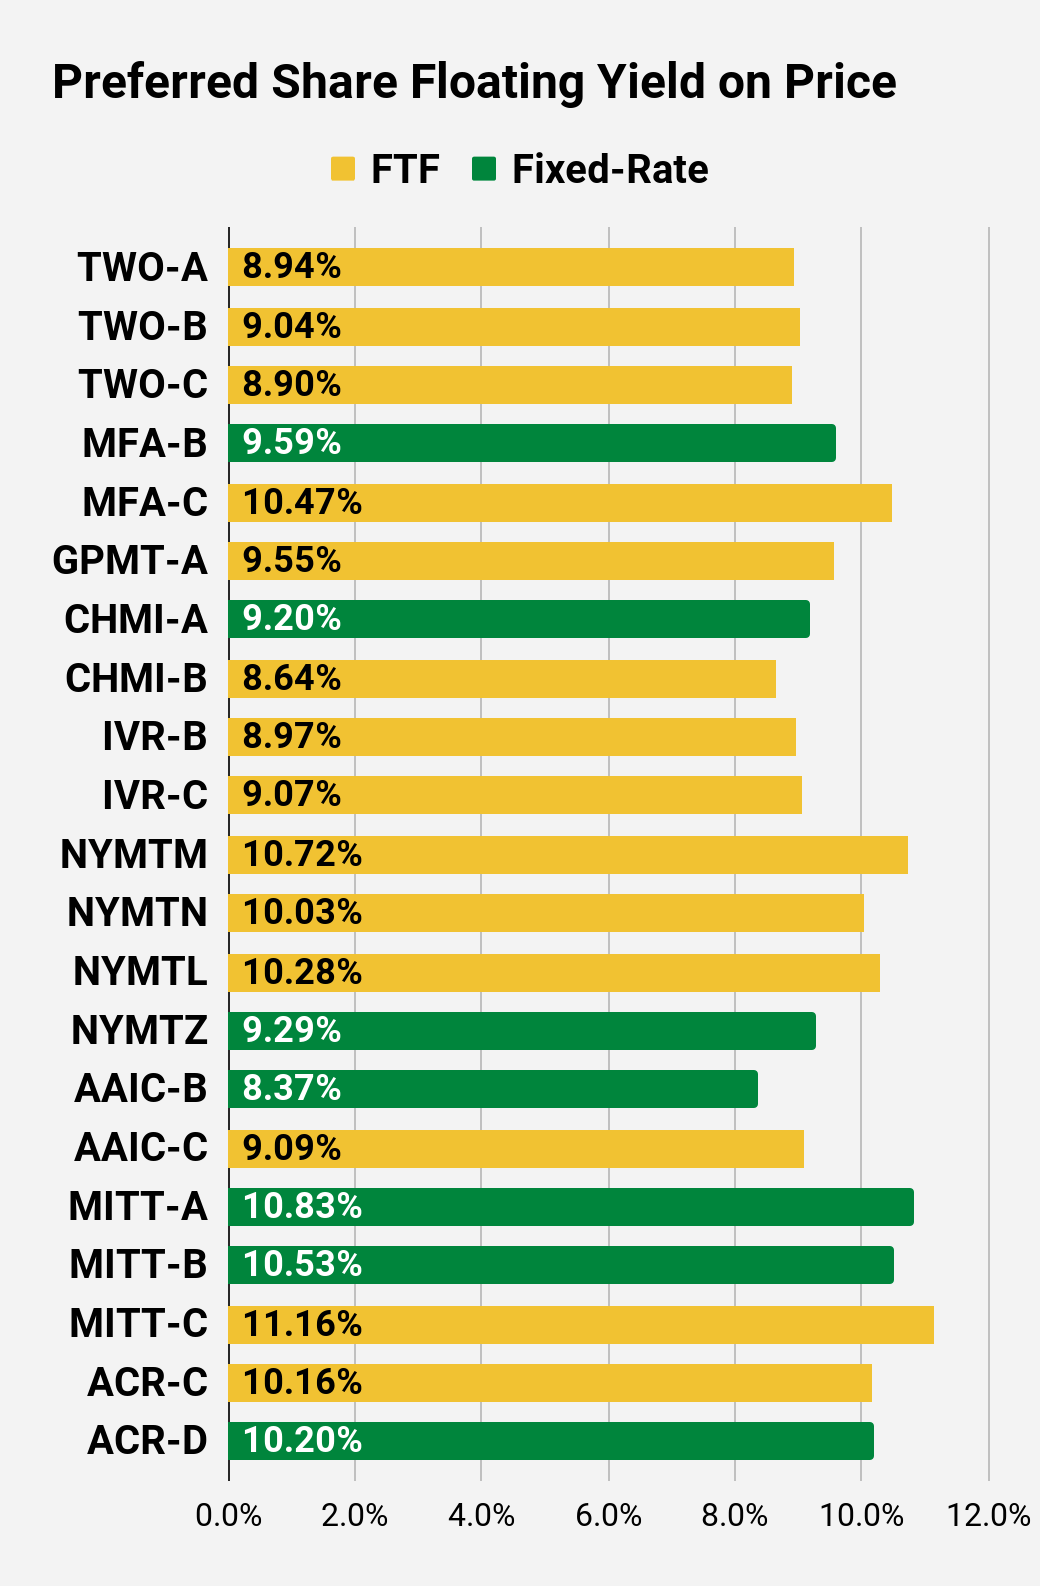
- FYoP = Floating Yield on Price – Shown in Charts
- NCD = Next Call Date (the soonest shares could be called)
- Note: For all FTF issues, the floating rate would start on NCD.
- WCC = Worst Cash to Call (lowest net cash return possible from a call)
- QO Link = Link to Quantum Online Page
Second Batch:
Strategy
Our goal is to maximize total returns. We achieve those most effectively by including “trading” strategies. We regularly trade positions in the mortgage REIT common shares and BDCs because:
- Prices are inefficient.
- Long-term, share prices generally revolve around book value.
- Short-term, price-to-book ratios can deviate materially.
- Book value isn’t the only step in analysis, but it is the cornerstone.
We also allocate to preferred shares and equity REITs. We encourage buy-and-hold investors to consider using more preferred shares and equity REITs.
Performance
We compare our performance against 4 ETFs that investors might use for exposure to our sectors:
The REIT Forum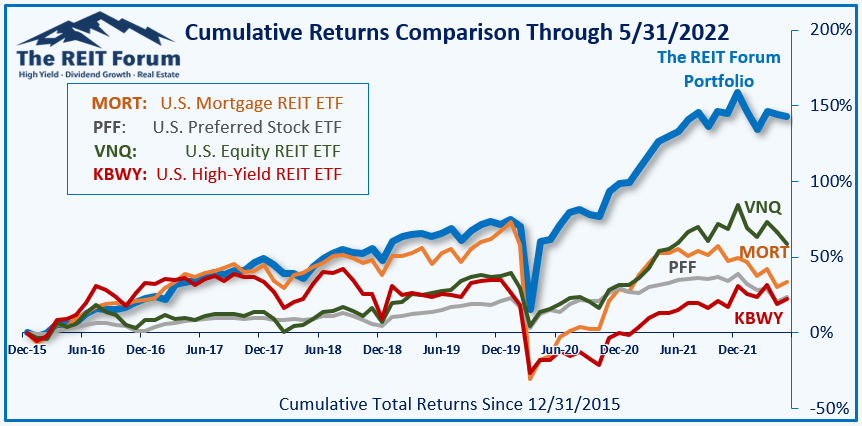
The 4 ETFs we use for comparison are:
|
Ticker |
Exposure |
|
One of the largest mortgage REIT ETFs |
|
|
One of the largest preferred share ETFs |
|
|
Largest equity REIT ETF |
|
|
The high-yield equity REIT ETF. Yes, it has been dreadful. |
When investors think it isn’t possible to earn solid returns in preferred shares or mortgage REITs, we politely disagree. The sector has plenty of opportunities, but investors still need to be wary of the risks. We can’t simply reach for yield and hope for the best. When it comes to common shares, we need to be even more vigilant to protect our principal by regularly watching prices and updating estimates for book value and price targets.
Ratings:
- Bullish on preferred shares: NLY-G, MFA-B, MFA-C
Be the first to comment