

bankrx
Introduction
This will be the first article I’ve written on Cisco Systems (NASDAQ:CSCO) stock. I think the primary reason for that is that the stock has been kind of unremarkable over the past several years, and I usually warn investors when I think a stock is very expensive or share my thoughts on a very cheap stock I have recently purchased. In recent years, Cisco has rarely traded at those extremes which explains my lack of coverage. However, I do think that it’s important to avoid buying stocks like Cisco if you are an investor who purchases individual stocks. In this article, I am going to share three reasons why I’m currently avoiding Cisco stock.
#1: Cisco Systems’ 3-Year Revenue Trend Is Negative
Revenue is a metric that sort of cuts through all of the clutter to give an investor a very quick view of the big-picture trend of a business. Most of the time (as in, more than 90% of the time) quality growing businesses will have consistently growing revenues unless we are deep in a recession or the business is very cyclical. Sure, sometimes there are one-time issues that come along, or there will be a year where some revenues are pulled forward from the future, and therefore might be given back for a year or two. But I have found that if we aren’t deep in a recession, and a business isn’t particularly cyclical, if the three-year cumulative revenue trend is negative, then it’s a good signal to sell a stock. In other words, if revenue this year is lower than it was three years ago, it usually means a business’s growth years are behind it.
I don’t purposefully invest in turnaround stocks or cigar butt stocks. I always require that my long-term earnings expectations at least keep up with inflation for the businesses whose stocks I buy. And it’s pretty hard in most cases for earnings to grow if revenues are consistently falling over time.
With that context, let’s examine Cisco’s 3-year revenue trend:
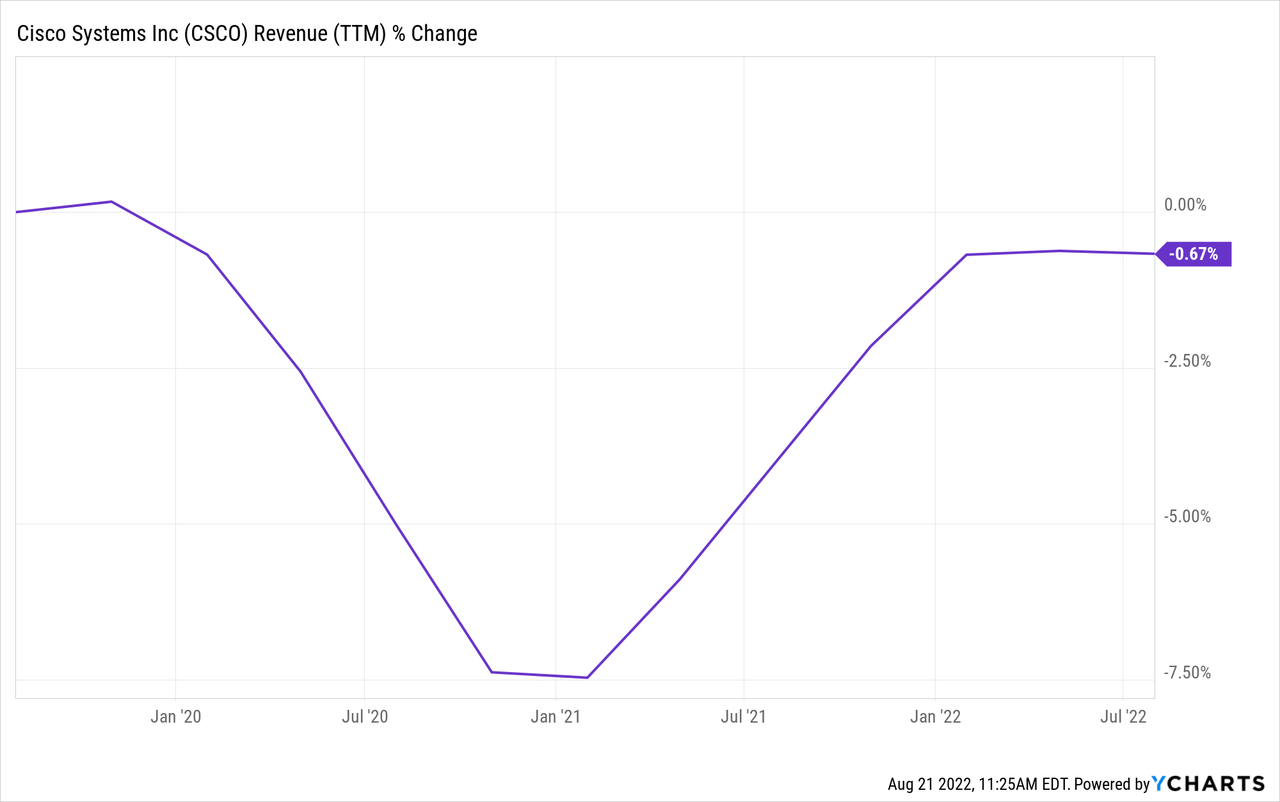
Cisco’s current TTM revenue is slightly below where it was three years ago. Not only is this enough for me to avoid the stock, if I had owned the stock, it would have been enough for me to sell it.
This very simple metric has kept me out of value traps like IBM (IBM) and Wells Fargo (WFC) and many other poor investments over the years that might otherwise look attractive. It should not be ignored.
#2: CSCO Stock Valuation Isn’t Attractive Enough
In this section, I’m going to run through my process for valuing Cisco stock to see if the revenue trend were to change for the better, whether then the stock might be a buy at today’s price.
The valuation method I use for Cisco first checks to see how cyclical earnings have been historically. Once it is determined that earnings aren’t too cyclical, then I use a combination of earnings, earnings growth, and P/E mean reversion to estimate future returns based on previous earnings growth and sentiment patterns. I take those expectations and apply them 10 years into the future, and then convert the results into an expected CAGR percentage. If the expected return is good, I will buy the stock, and if it’s really low, I will often sell a stock.
How Cyclical Are Earnings?
Before I begin this analysis, I’ll check the business’s long-term earnings patterns in order to ensure that the business is a proper fit for this sort of analysis. If the historical earnings 1) don’t have a long enough history, 2) are erratic in nature, or 3) are too cyclical, then I either avoid analyzing the stock altogether or I use a different type of analysis that is more appropriate.
FAST Graphs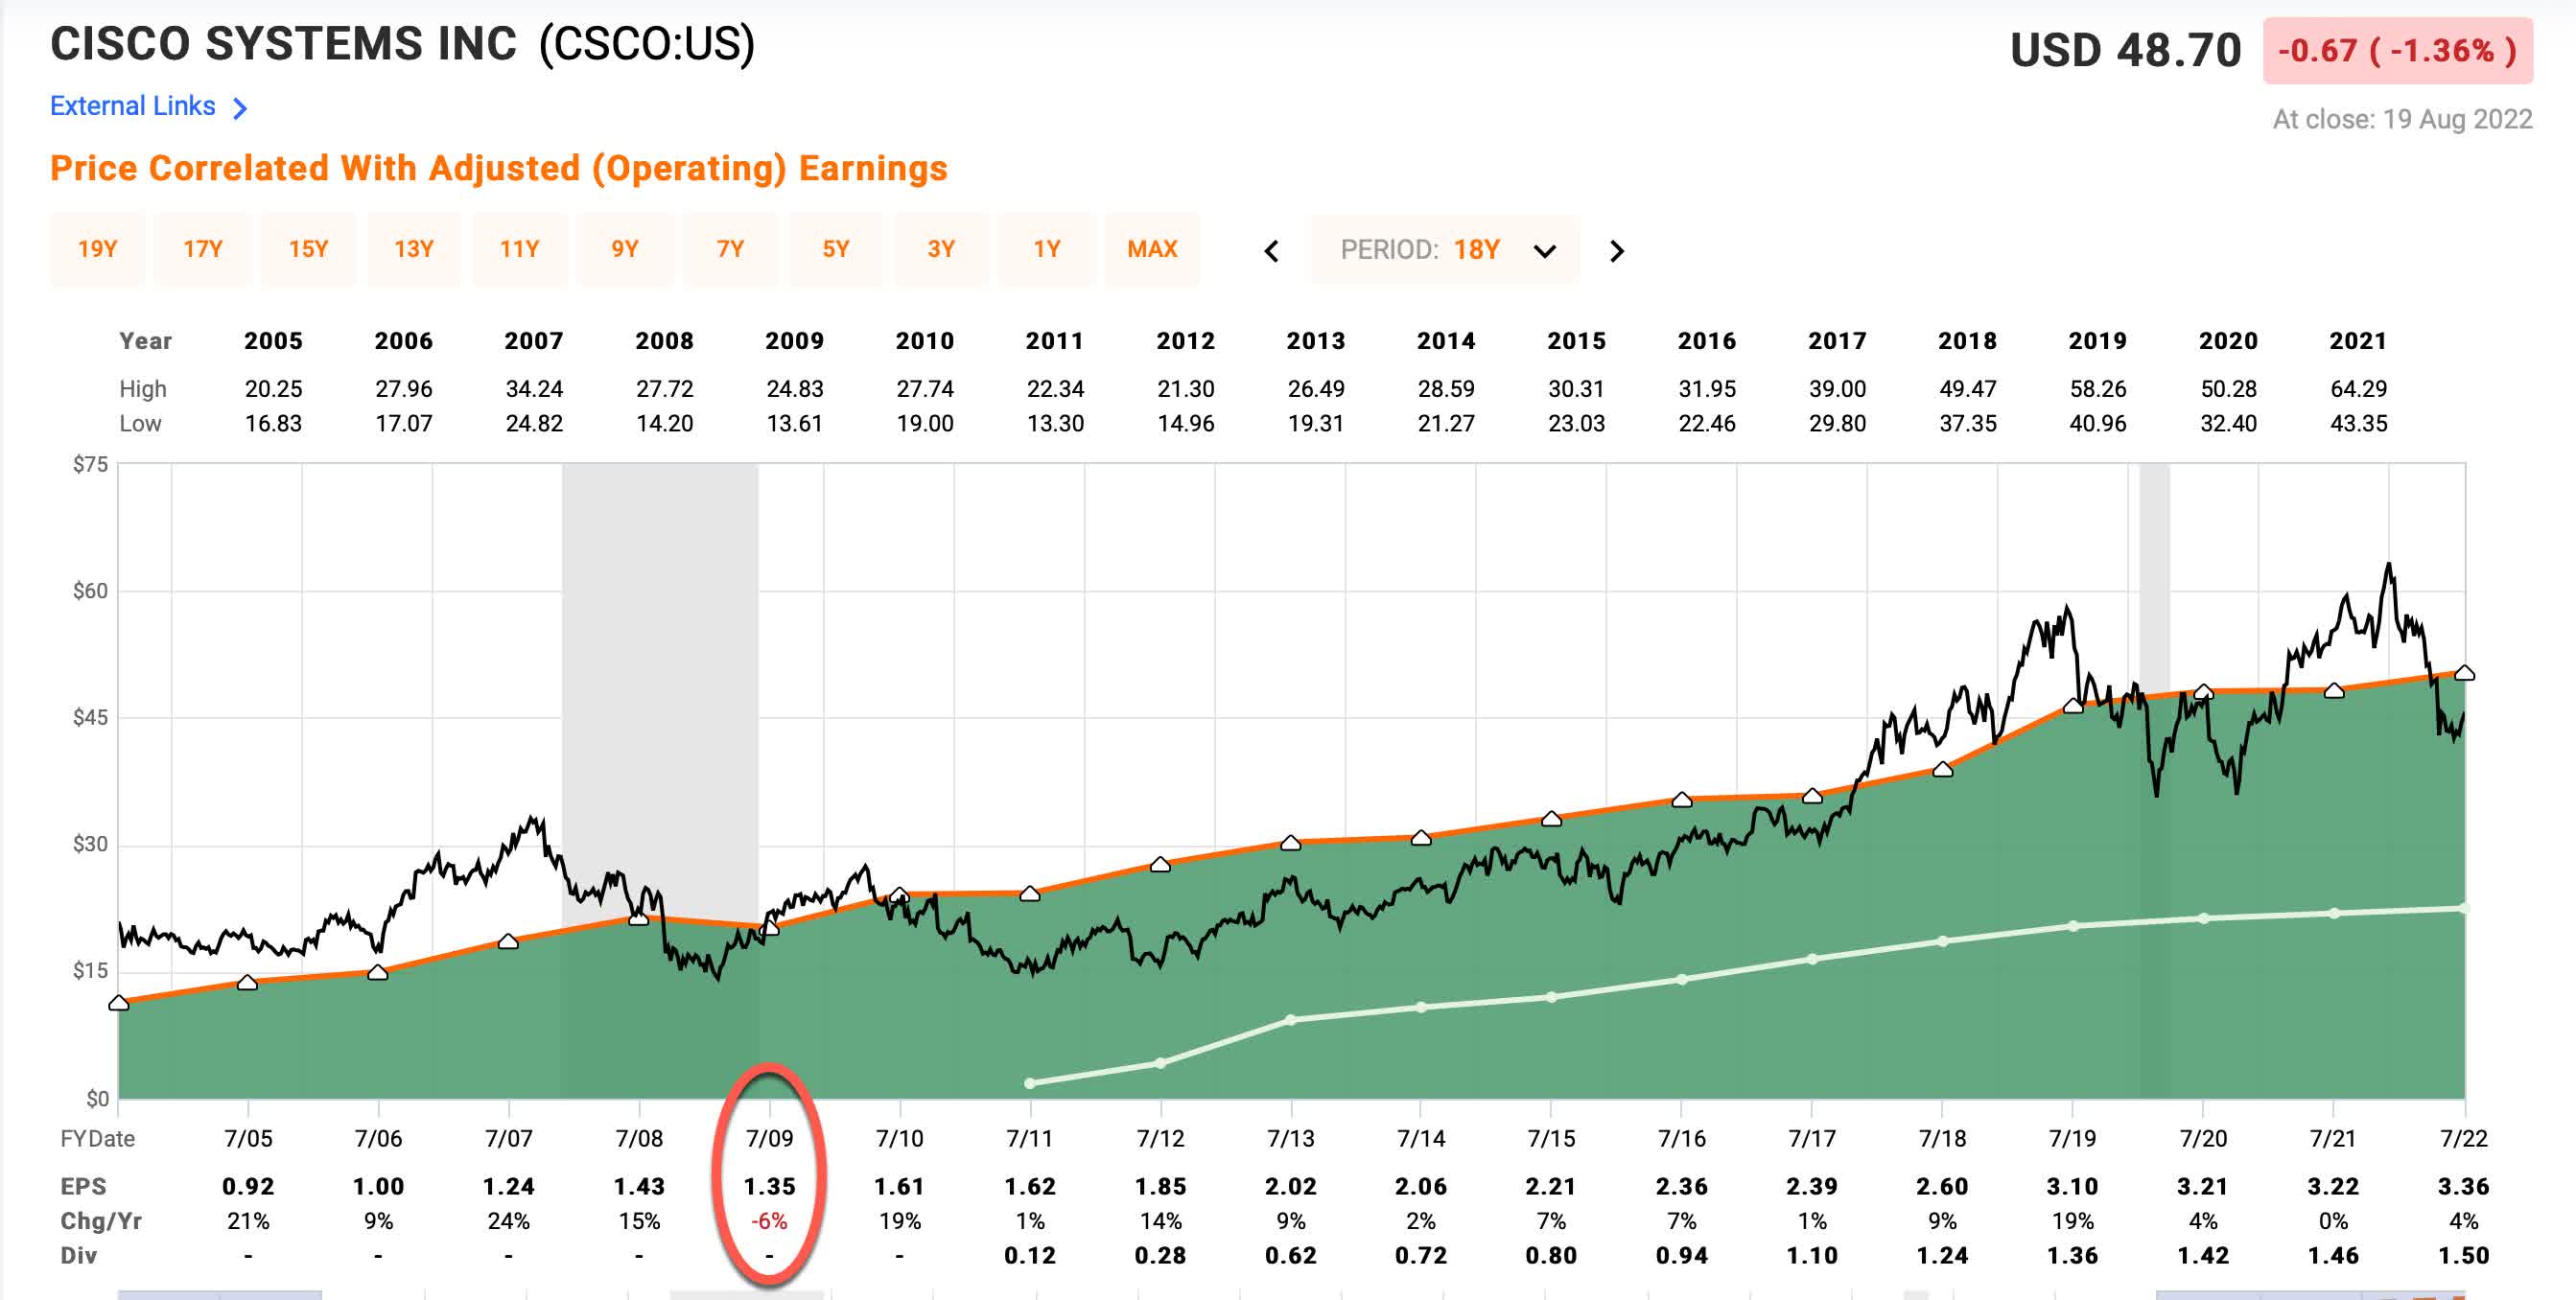
Since 2005 Cisco has only had one year when EPS growth declined, and that was during the GFC in 2009, so it does not have cyclical earnings at all. Because of its stable earnings growth, it is appropriate to use an earnings and earnings growth-based valuation method for this stock.
Market Sentiment Return Expectations
In order to estimate what sort of returns we might expect over the next 10 years, let’s begin by examining what return we could expect 10 years from now if the P/E multiple were to revert to its mean from the previous economic cycle. For this, I’m using a period that runs from 2015-2023.
FAST Graphs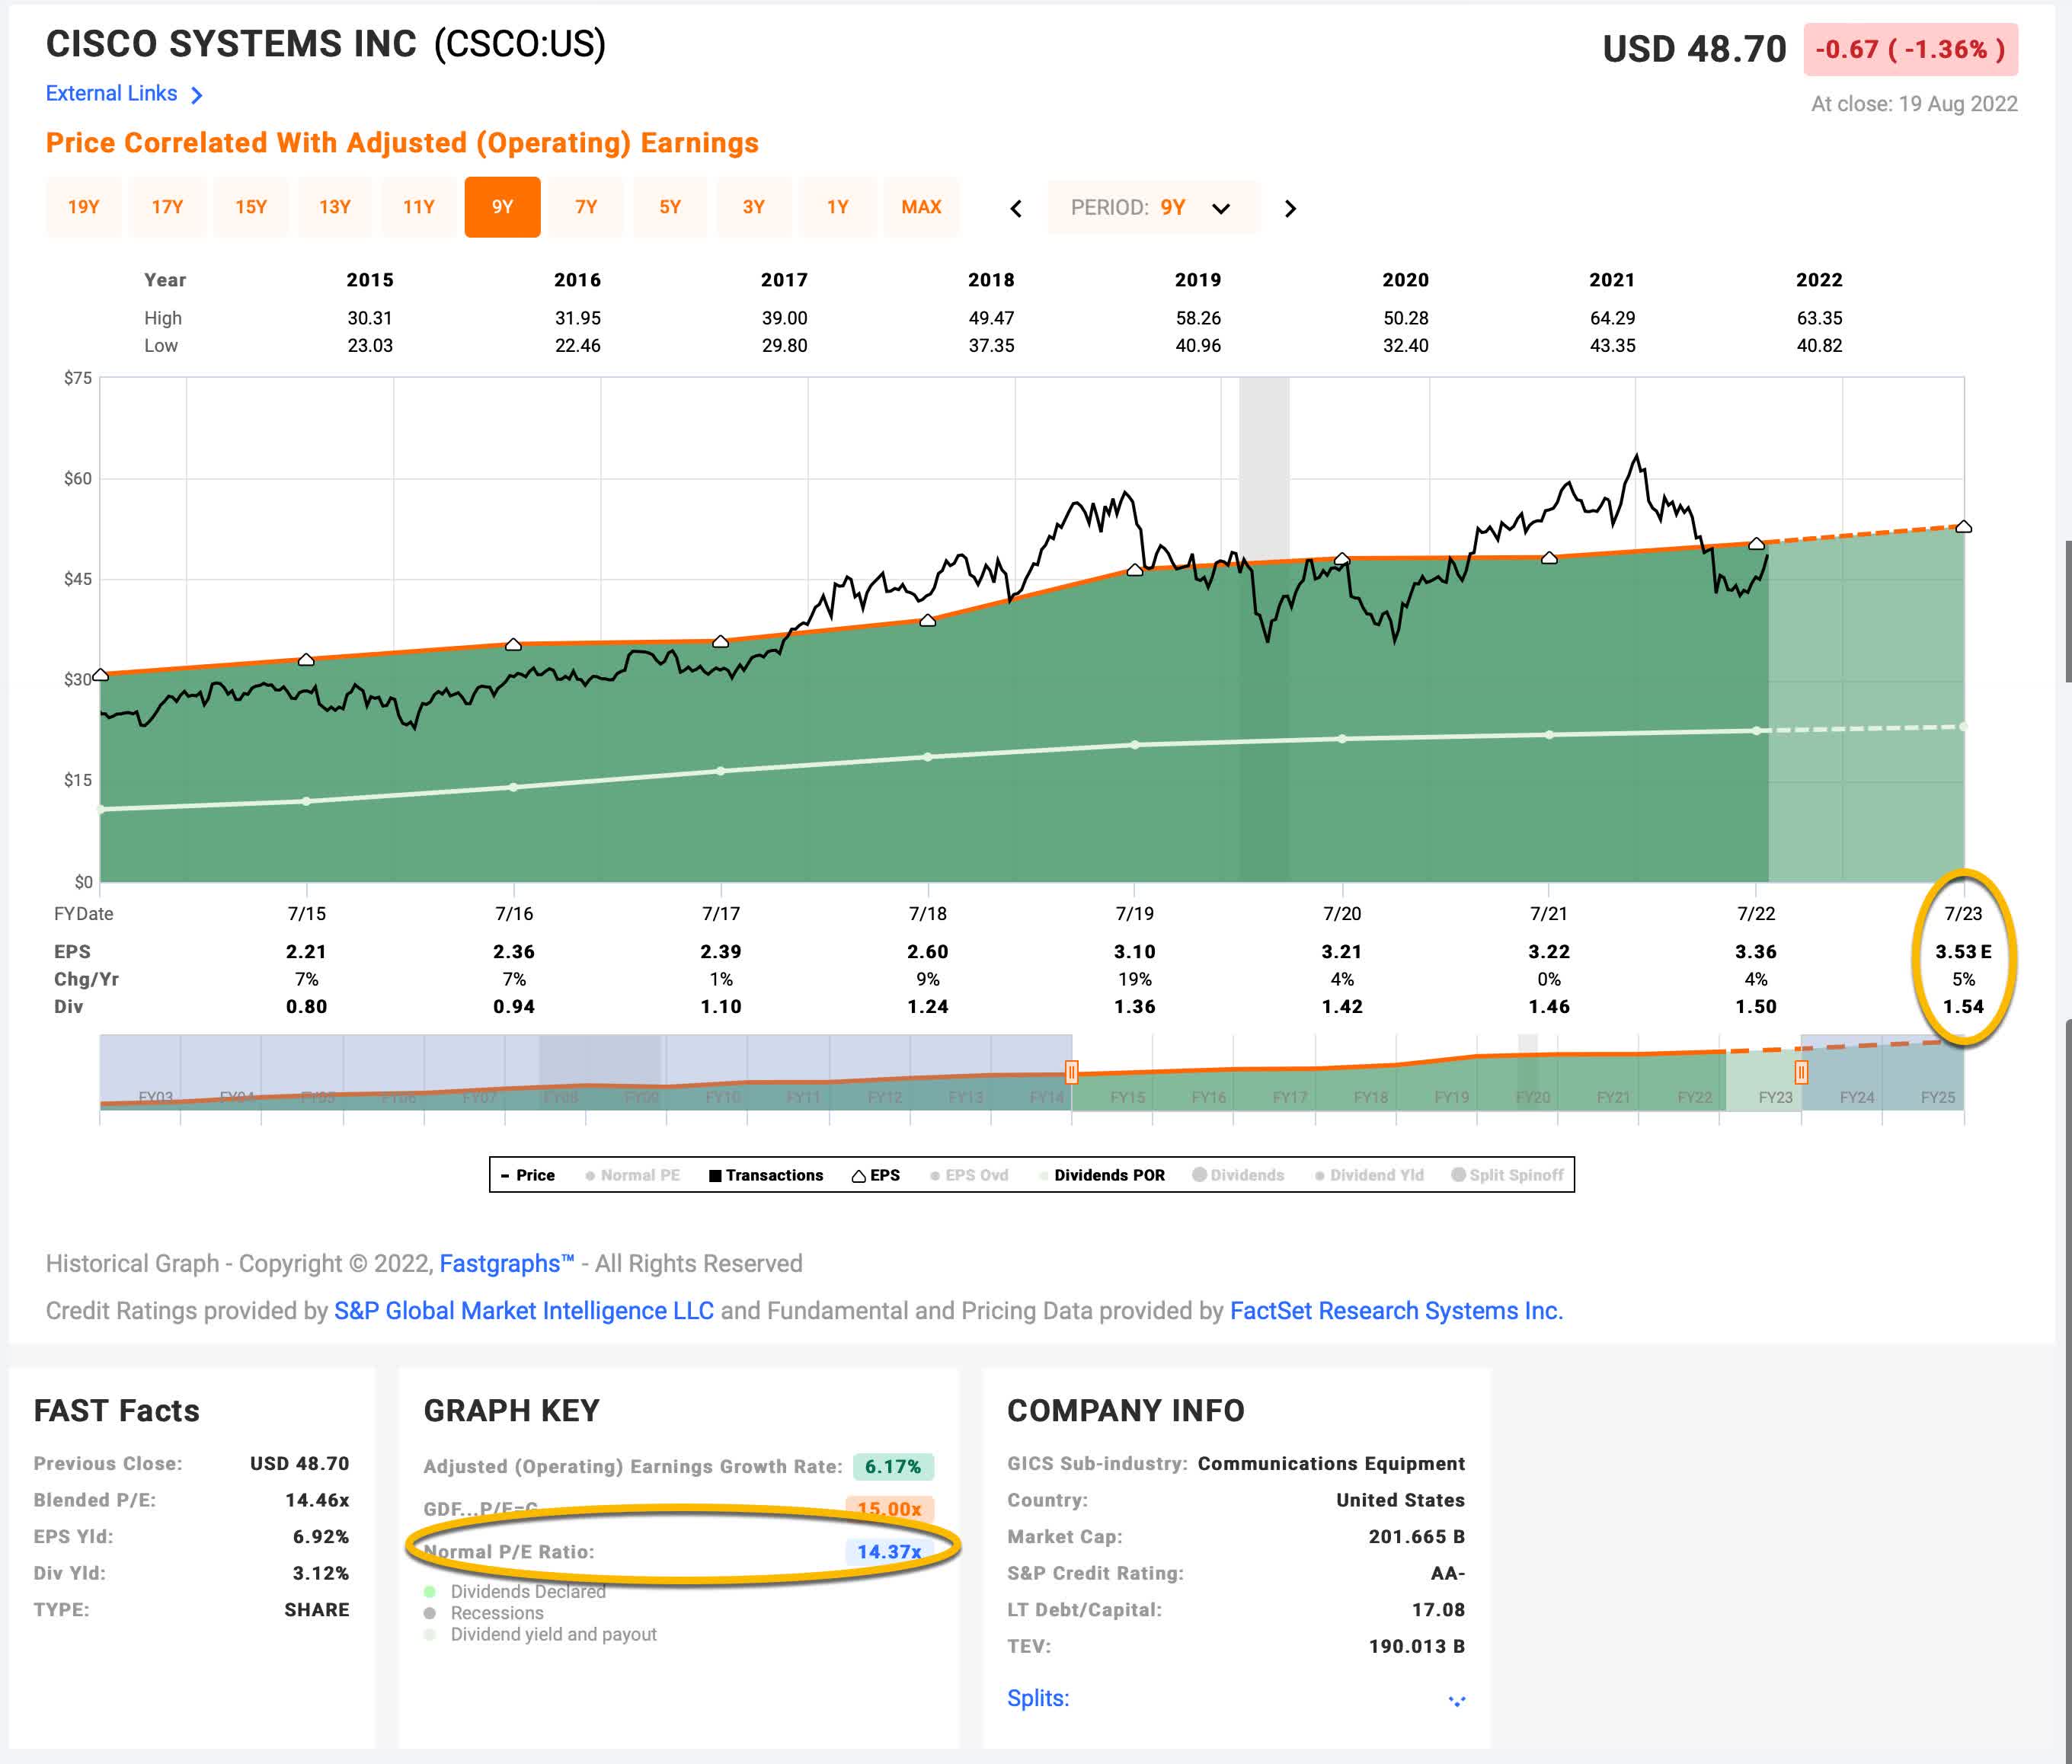
Cisco’s average P/E from 2015 to the present has been about 14.37 (the blue number circled in gold near the bottom of the FAST Graph). Using 2023’s forward earnings estimates of $3.53 (also circled in gold), CSCO has a current P/E of 13.80. If that 13.80 P/E were to revert to the average P/E of 14.37 over the course of the next 10 years and everything else was held the same, CSCO’s price would rise and it would produce a 10-Year CAGR of +0.41%. If it were to revert faster than that, then the CAGR would be higher.
Business Earnings Expectations
We previously examined what would happen if market sentiment reverted to the mean. This is entirely determined by the mood of the market and is quite often disconnected, or only loosely connected, to the performance of the actual business. In this section, we will examine the actual earnings of the business. The goal here is simple: We want to know how much money we would earn (expressed in the form of a CAGR %) over the course of 10 years if we bought the business at today’s prices and kept all of the earnings for ourselves.
There are two main components of this: the first is the earnings yield and the second is the rate at which the earnings can be expected to grow. Let’s start with the earnings yield (which is an inverted P/E ratio, so, the Earnings/Price ratio). The current earnings yield is about +7.25%. The way I like to think about this is, if I bought the company’s whole business right now for $100, I would earn $7.25 per year on my investment if earnings remained the same for the next 10 years.
The next step is to estimate the company’s earnings growth during this time period. I do that by figuring out at what rate earnings grew during the last cycle and applying that rate to the next 10 years. This involves calculating the historical EPS growth rate, taking into account each year’s EPS growth or decline, and then backing out any share buybacks that occurred over that time period (because reducing shares will increase the EPS due to fewer shares).
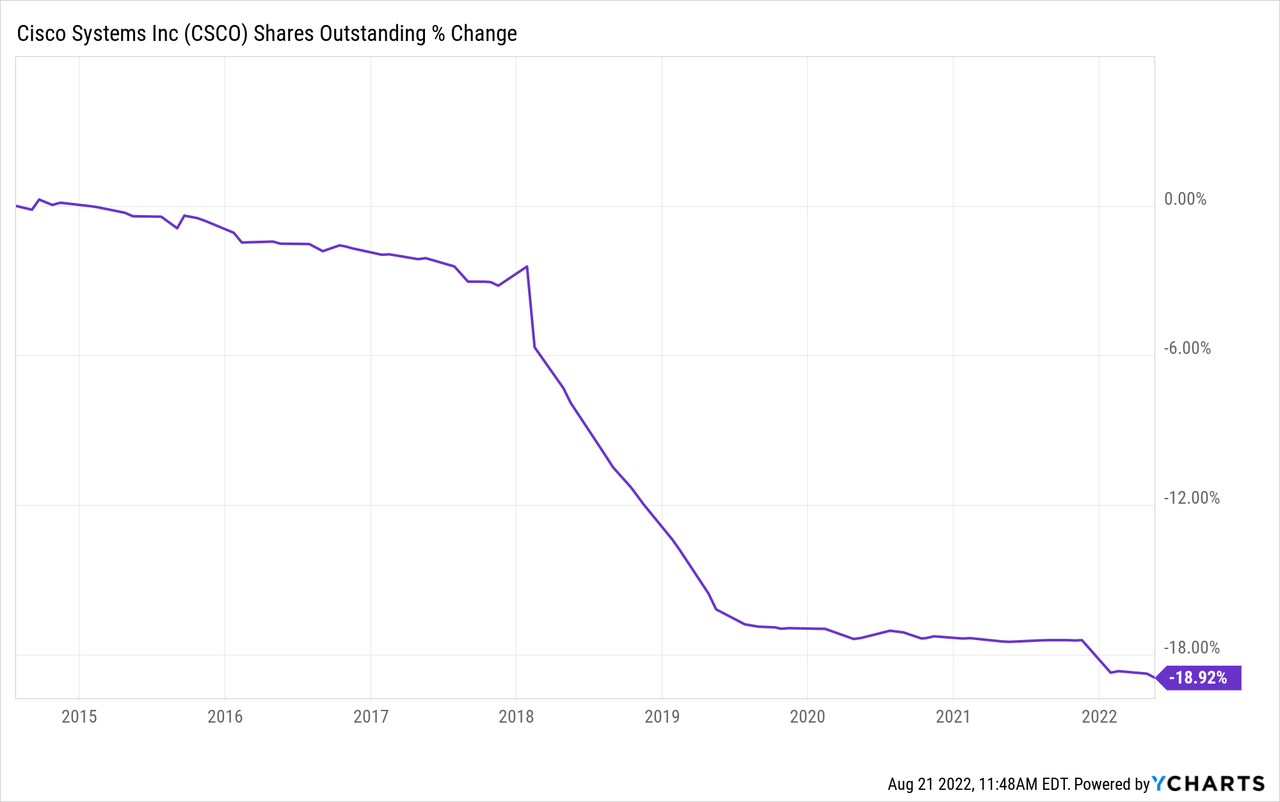
Cisco has bought back about 19% of the company since this point in 2014. I’ll make adjustments for this when estimating the earnings growth rate. After taking the buybacks into account, I have an earnings growth estimate for Cisco of about +3.64%.
Next, I’ll apply that growth rate to current earnings, looking forward 10 years in order to get a final 10-year CAGR estimate. The way I think about this is, if I bought CSCO’s whole business for $100, it would pay me back $7.25 plus +3.64% growth the first year, and that amount would grow at +3.64% per year for 10 years after that. I want to know how much money I would have in total at the end of 10 years on my $100 investment, which I calculate to be about $188.70 (including the original $100). When I plug that growth into a CAGR calculator, that translates to a +6.56% 10-year CAGR estimate for the expected business earnings returns.
10-Year, Full-Cycle CAGR Estimate
Potential future returns can come from two main places: market sentiment returns or business earnings returns. If we assume that market sentiment reverts to the mean from the last cycle over the next 10 years for CSCO, it will produce a +0.41% CAGR. If the earnings yield and growth are similar to the last cycle, the company should produce somewhere around a +3.64% 10-year CAGR. If we put the two together, we get an expected 10-year, full-cycle CAGR of +6.96% at today’s price.
My Buy/Sell/Hold range for this category of stocks is: above a 12% CAGR is a Buy, below a 4% expected CAGR is a Sell, and in between 4% and 12% is a Hold. A +6.96% CAGR expectation makes Cisco stock a “Hold” at today’s price, and almost right in the middle of what I would consider the fair value range, all other things being equal.
Using this valuation method, Cisco would not become a “Buy” until the price fell below $35.32 per share.
#3: I Don’t Like Cisco’s Capital Allocation
This last reason is a little less objective and a little more subjective than the first two reasons, which were more quantitative in nature. I don’t mind if a business has slow earnings growth in the 3-4% range. That level of earnings growth is typically enough to at least keep up with inflation, but when growth is that slow it means that the stock should basically be treated like an inflation-protected bond. And if the business isn’t growing faster than inflation, then I expect the money that the business earns to mostly be returned to shareholders in the form of a dividend. I differ a little bit here from some investors who don’t mind, or perhaps even prefer, stock buybacks. But I am of the opinion that if the business isn’t growing much in real terms then there is no reason for the business to be buying back shares. To me, buying back shares under those conditions is just a form of financial engineering meant to benefit the employees of the company rather than the owners (i.e., shareholders of the company).
Additionally, because I aim for above-average market returns, an inflation-protected bond equivalent needs to yield at the very minimum 6%, but usually more like 7%-8%, in order for me to find it attractive. Cisco currently only yields about +3.12%. I also expect a slow-growth business like this to have a payout ratio of at least 80%. Cisco’s is closer to 45%. So, whatever they are doing with their money, it is clear they are not giving it back to shareholders in the form of a dividend. Anyone who reads my articles knows that I am not a “dividend investor”, but this is one case where I actually do expect the company to pay out dividends to shareholders.
I should also mention here that Cisco’s one good growth year in 2018 was very likely the result of corporate tax cuts, so the real sustainable earnings growth rate is likely even lower than the one that I used in calculations, and it would appear from the shares outstanding graph that Cisco took most of those tax savings and simply bought back shares with it. To make matters worse, they bought most of the shares back when Cisco’s stock was trading well above its average valuation. Putting this all together, Cisco stock isn’t trading at an attractive valuation and I expect this stock to produce below-average returns over the medium-term of 2-5 years.
Conclusion
I am of the opinion that it doesn’t make sense to buy average or below-average stocks. If an investor wants average returns they should simply buy the market index. So, when I see a stock like Cisco where the most generous expectation is that they will produce roughly average returns, then that doesn’t attract me as an investor. Here is how Cisco has performed compared to the S&P 500 (SPY) since 2015.
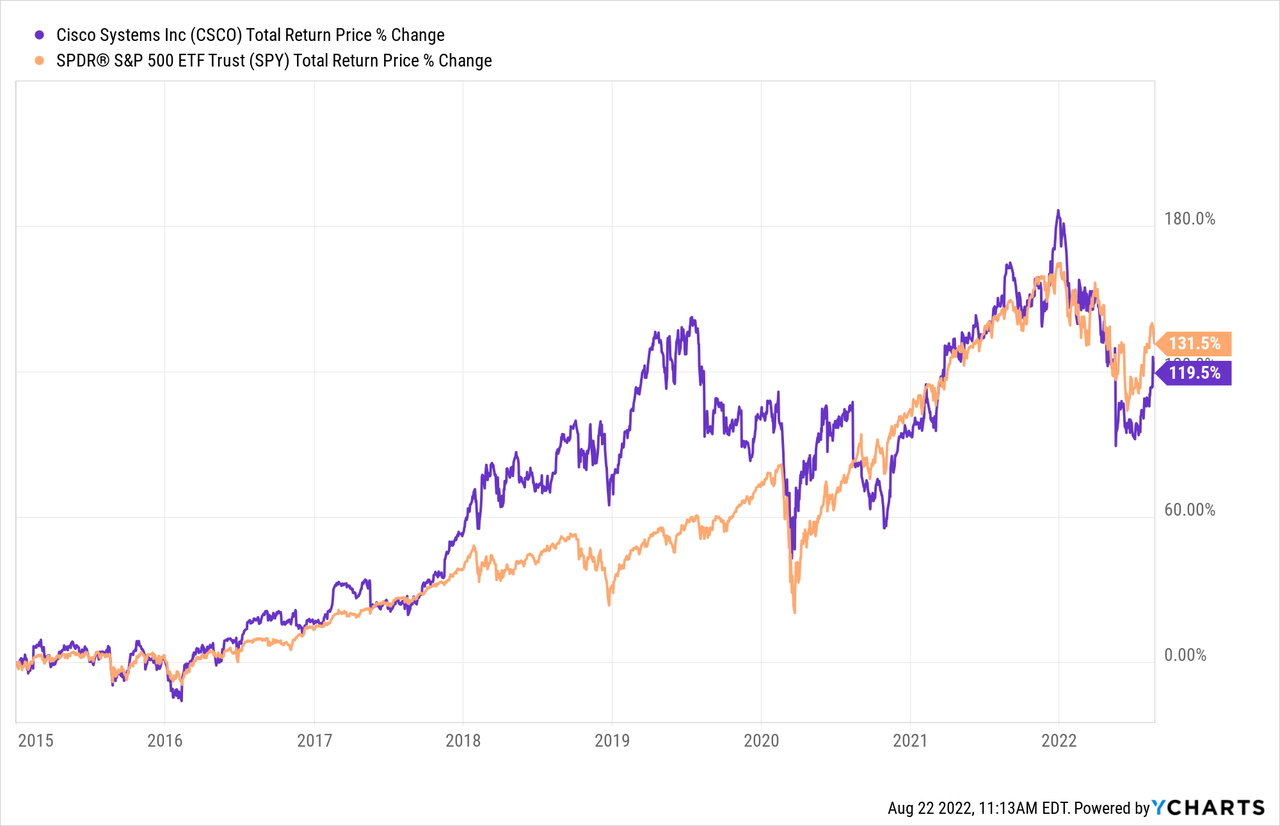
Other than the period in 2018 and 2019 when Cisco was buying back massive amounts of stock, Cisco has mostly traded in line with the index. And since Cisco’s earnings patterns are fairly predictable, it seems reasonable to think this trend will continue. It doesn’t make sense to me to take on individual stock risk with an average-performing stock, when one can take on less risk by owning SPY with similar return expectations.
For all of these reasons, I have avoided Cisco stock for years, and if I owned it, I would swap it out for SPY until I found an individual stock investment that was likely to produce above-average returns.
Be the first to comment