

andresr/E+ via Getty Images
It’s been a wild bear market so far.
Ycharts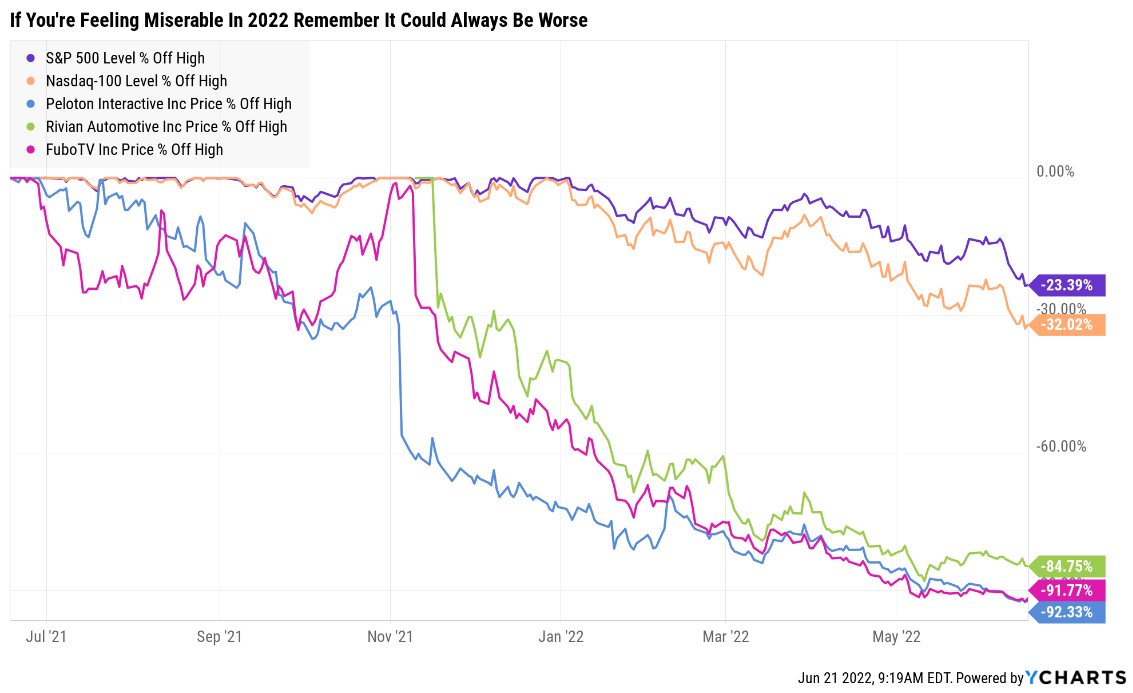
Many investors feel pretty miserable right now, so I recommend putting your paper losses into context.
Michael Batnick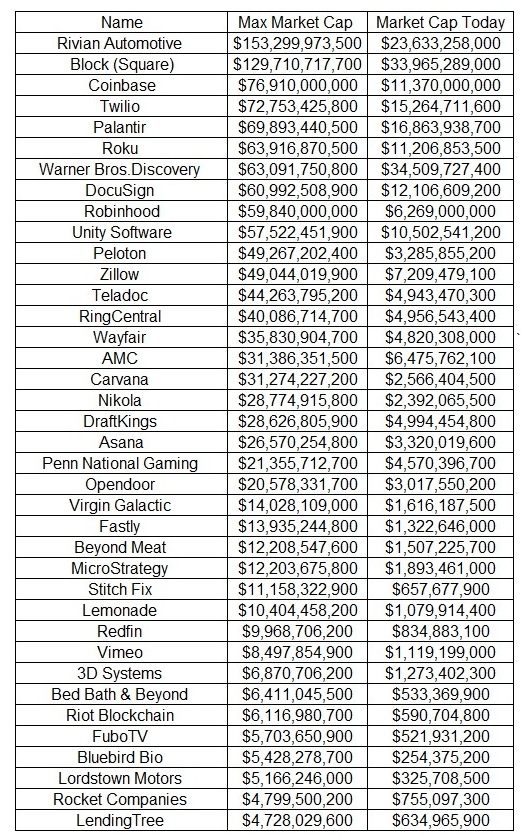
As of June 17th, 11% of the US stock market (Russell 3000) was down 80+%, including former high flyers like Rivian (RIVN), which peaked at $153 billion in market cap despite no sales.
My goal is to avoid such catastrophic declines for one simple reason.
JPMorgan Asset Management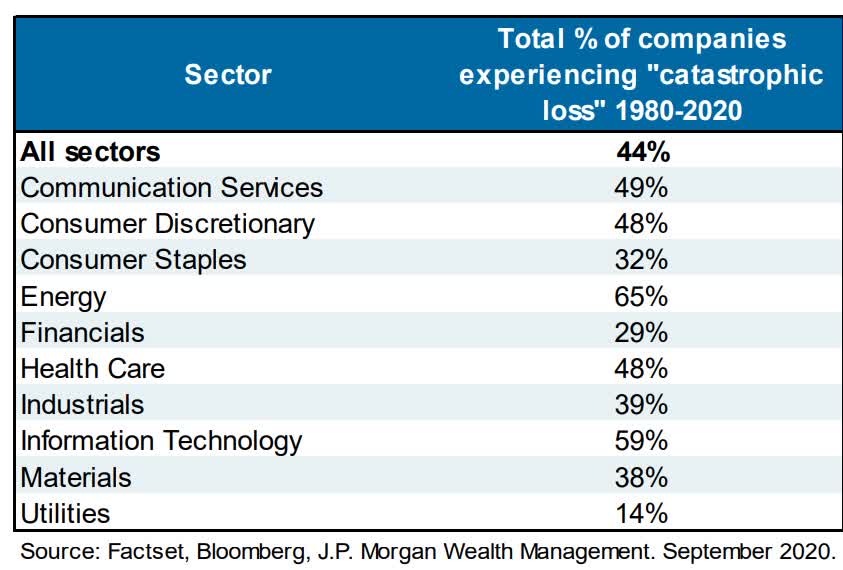
Historically speaking, companies that fall 70+% never come back, tending to trade sideways for years or go to zero.
That’s not always the case of course, with some of the greatest stocks in history, including Apple (AAPL) and Amazon (AMZN) falling 70+% several times.
That’s where quality, safety, and dependability make all the difference.
13/13 quality Ultra SWANs are the greatest companies in the world, as close to perfect as you’ll ever find on Wall Street.
- 5/5 dividend or balance sheet safety
- 3/3 wide and stable moats
- 5/5 exceptional dependability (income and total returns, past and likely future)
In the 2022 bear market, my retirement portfolio’s limited savings (about $10K per month) are focused exclusively on my core holdings, pure Ultra SWAN quality companies.
Last week the market fell almost 25% intra-day, triggering my next correction buying bucket.
Today I wanted to share with you three of the incredible blue-chip bargains I bought last week, that remain some of the best blue-chip buying opportunities of this bear market.
Enterprise Products Partners (EPD): The Safety And Quality King Of Midstream
- a full deep-dive analysis of EPD’s long-term thesis, risk profile, growth potential, valuation, and total return potential:
- Enterprise Products Partners: The Perfect 7.2% Yielding Blue-Chip For What’s Coming Next
- 5 Things All MLP Investors Need To Know
- EPD uses a K-1 tax form
Reasons To Potentially Buy EPD Today
- 90% quality low-risk 13/13 Ultra SWAN midstream
- highest quality midstream
- 96% dividend safety score
- 23-year dividend growth streak
- 7.9% very safe yield
- 0.5% average recession dividend cut risk
- 1.2% severe recession dividend cut risk
- 24% conservatively undervalued (potential strong buy)
- Fair Value: $30.88 (8.65)
- 6.6X forward cash flow vs 10X to 12X historical
- BBB+ stable outlook credit rating = 5% 30-year bankruptcy risk
- 67th industry percentile risk management consensus = Above-Average
- 2% to 13% CAGR margin-of-error growth consensus range
- 4.4% CAGR median growth consensus
- 5-year consensus total return potential: 15% to 21% CAGR
- base-case 5-year consensus return potential: 18% CAGR (2.5X S&P consensus)
- consensus 12-month total return forecast: 40% (highly reasonable, 8.6X cash flow)
- Fundamentally Justified 12-Month Returns: 40% CAGR
EPD 2024 Consensus Total Return Potential
(Source: FAST Graphs, FactSet) (Source: FAST Graphs, FactSet)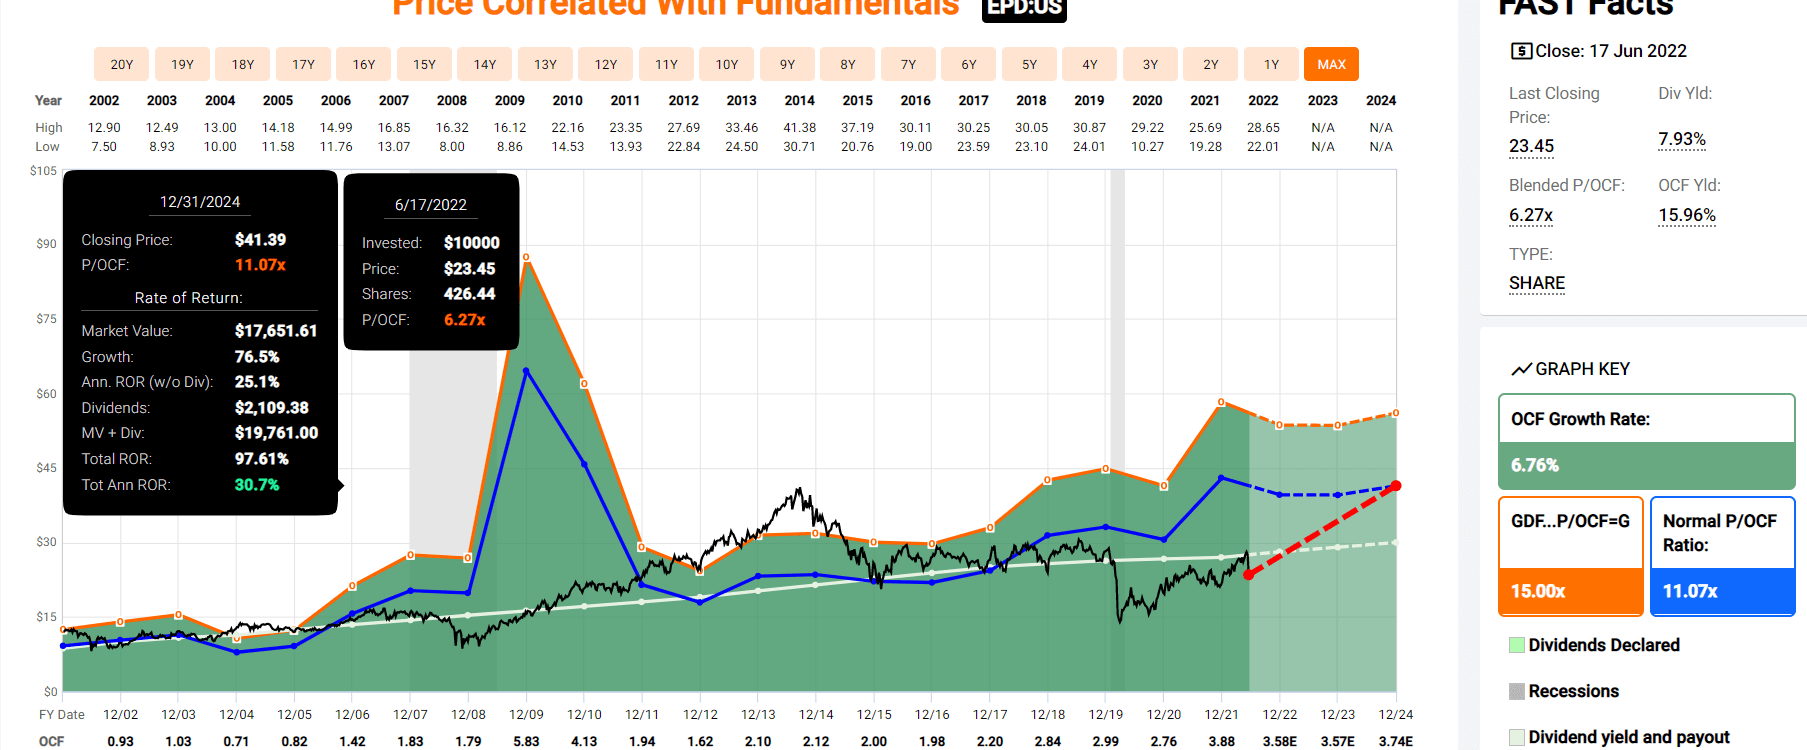
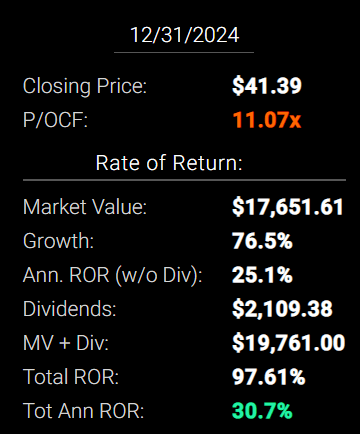
If EPD grows as analysts expect by 2024 and returns to historical mid-range fair value it could deliver 98% total returns or 31% annually.
- Buffett-like returns from an anti-bubble blue-chip bargain hiding in plain sight
EPD 2027 Consensus Total Return Potential
(Source: FAST Graphs, FactSet) (Source: FAST Graphs, FactSet)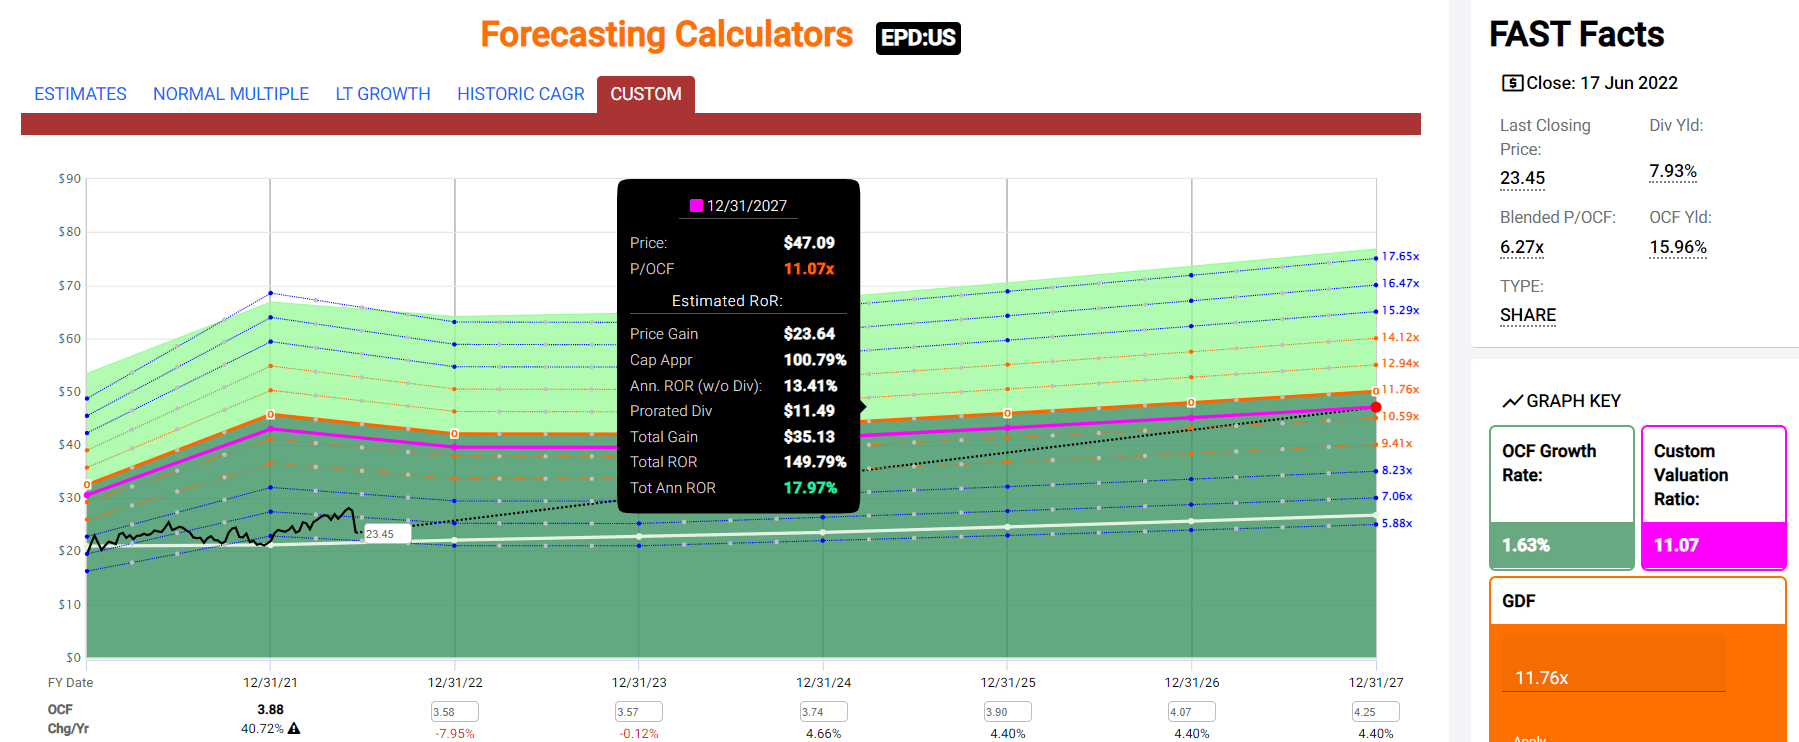
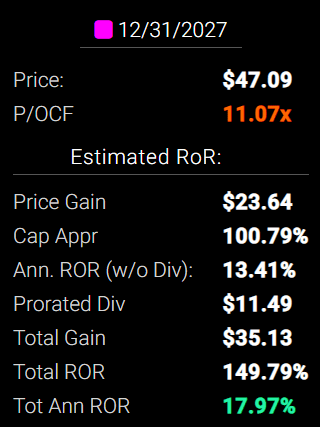
By 2027 if EPD grows as expected and returns to historical mid-range fair value, it could deliver 150% total returns or 18% annually.
- about 2.5X the S&P 500 consensus
- Buffett-like return potential
EPD Long-Term Consensus Total Return Potential
| Investment Strategy | Yield | LT Consensus Growth | LT Consensus Total Return Potential | Long-Term Risk-Adjusted Expected Return | Long-Term Inflation And Risk-Adjusted Expected Returns | Years To Double Your Inflation & Risk-Adjusted Wealth |
10-Year Inflation And Risk-Adjusted Expected Return |
| Enterprise Products Partners | 7.9% | 4.4% | 12.3% | 8.6% | 6.1% | 11.7 | 1.81 |
| Safe Midstream | 6.3% | 6.4% | 12.7% | 8.9% | 6.4% | 11.2 | 1.86 |
| 10-Year US Treasury | 3.3% | 0.0% | 3.3% | 3.3% | 0.8% | 88.9 | 1.08 |
| High-Yield | 3.1% | 12.7% | 15.8% | 11.1% | 8.6% | 8.4 | 2.28 |
| REITs | 2.8% | 6.5% | 9.3% | 6.5% | 4.0% | 17.8 | 1.49 |
| Dividend Aristocrats | 2.4% | 8.5% | 10.9% | 7.6% | 5.2% | 14.0 | 1.65 |
| S&P 500 | 1.8% | 8.5% | 10.3% | 7.2% | 4.7% | 15.2 | 1.59 |
(Sources: Morningstar, FactSet, Ycharts)
- Analysts expect EPD to significantly outperform almost every high-yield investment strategy as well as the dividend aristocrats and S&P 500 over the long-term.
- nothing offers the safety of EPD’s 8% yield with market and aristocrat beating return potential
Inflation-Adjusted Consensus Return Potential: $1,000 Initial Investment
| Time Frame (Years) | 7.6% CAGR Inflation-Adjusted S&P Consensus | 8.4% Inflation-Adjusted Aristocrats Consensus | 9.8% CAGR Inflation-Adjusted EPD Consensus | Difference Between Inflation-Adjusted EPD Consensus Vs S&P Consensus |
| 5 | $1,445.67 | $1,493.29 | $1,598.10 | $152.43 |
| 10 | $2,089.97 | $2,229.92 | $2,553.93 | $463.96 |
| 15 | $3,021.42 | $3,329.92 | $4,081.45 | $1,060.04 |
| 20 | $4,367.98 | $4,972.54 | $6,522.58 | $2,154.60 |
| 25 | $6,314.67 | $7,425.45 | $10,423.76 | $4,109.09 |
| 30 | $9,128.95 | $11,088.36 | $16,658.26 | $7,529.30 |
(Source: DK Research Terminal, FactSet)
Analysts believe that over the next 30 years EPD could deliver almost 17X inflation-adjusted returns.
| Time Frame (Years) | Ratio Aristocrats/S&P Consensus | Ratio Inflation–Adjusted EPD Consensus |
| 5 | 1.03 | 1.11 |
| 10 | 1.07 | 1.22 |
| 15 | 1.10 | 1.35 |
| 20 | 1.14 | 1.49 |
| 25 | 1.18 | 1.65 |
| 30 | 1.21 | 1.82 |
(Source: DK Research Terminal, FactSet)
Which is almost 2X more than the S&P 500 and 60% more than the dividend aristocrats
- while you enjoy a very safe yield that’s nearly 5X higher.
EPD Investment Decision Score
DK (Source: DK Automated Investment Decision Tool)
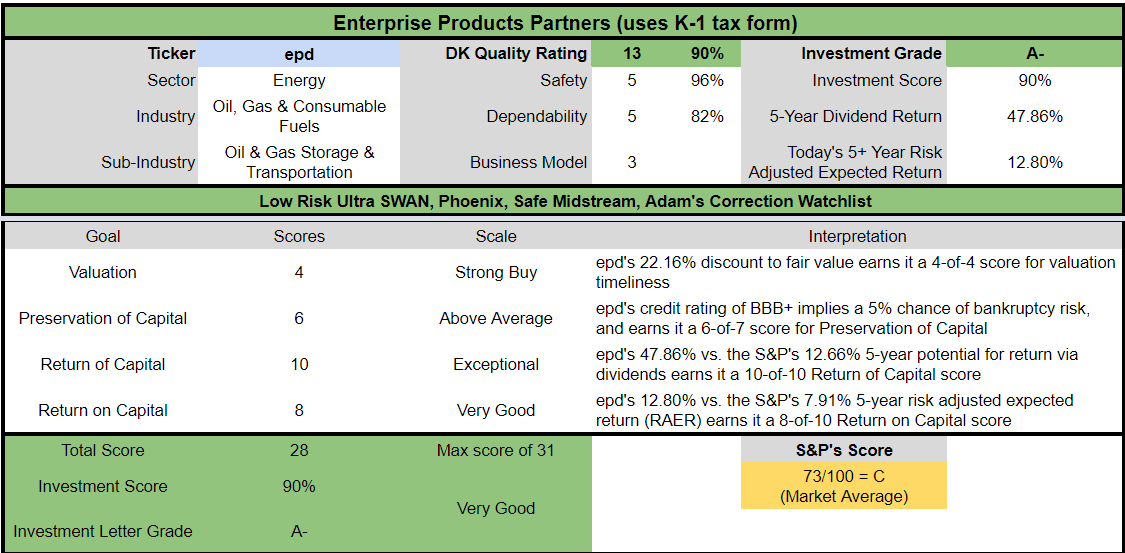
For anyone comfortable with its risk profile, EPD is one of the most reasonable and prudent ultra-high-yielding blue-chips you can buy.
- 24% discount vs 8% market discount = 16% better valuation
- 7.9% yield vs 1.8% yield (and a much safer yield at that) almost 5X the market’s yield
- potentially 30% higher long-term return potential than S&P 500 overtime
- about 1.5X better risk-adjusted expected return over the next five years
- 48% of your investment repaid in the first five years in consensus tax-deferred distributions
Mastercard (MA): The Fastest Growing Dividend Ultra SWANs On Wall Street
- a full deep-dive analysis of MA’s long-term thesis, risk profile, growth potential, valuation, and total return potential
- Mastercard: This Buffett-Style Blue-Chip Could Potentially Triple In The Next 5 Years
Reasons To Potentially Buy MA Today
- 100% quality low-risk 13/13 Ultra SWAN
- 3rd highest quality company on the DK 500 Masterlist
- 100% dividend safety score
- 10-year dividend growth streak
- 0.6% very safe yield
- 0.5% average recession dividend cut risk
- 1.0% severe recession dividend cut risk
- 14% undervalued (potential strong buy)
- Fair Value: $367.78
- 30.2X forward earnings vs 28.5X to 34.5X historical
- 21.5X cash-adjusted earnings
- A+ stable credit rating = 0.6% 30-year bankruptcy risk
- 82nd industry percentile risk management consensus = very good
- 19% to 30% CAGR margin-of-error growth consensus range
- 24.3% CAGR median growth consensus
- 5-year consensus total return potential: 18% to 26% CAGR
- base-case 5-year consensus return potential: 24% CAGR (6X S&P consensus)
- consensus 12-month total return forecast: 37%
- Fundamentally Justified 12-Month Returns: 17% CAGR
MA 2024 Consensus Total Return Potential
(Source: FAST Graphs, FactSet) (Source: FAST Graphs, FactSet)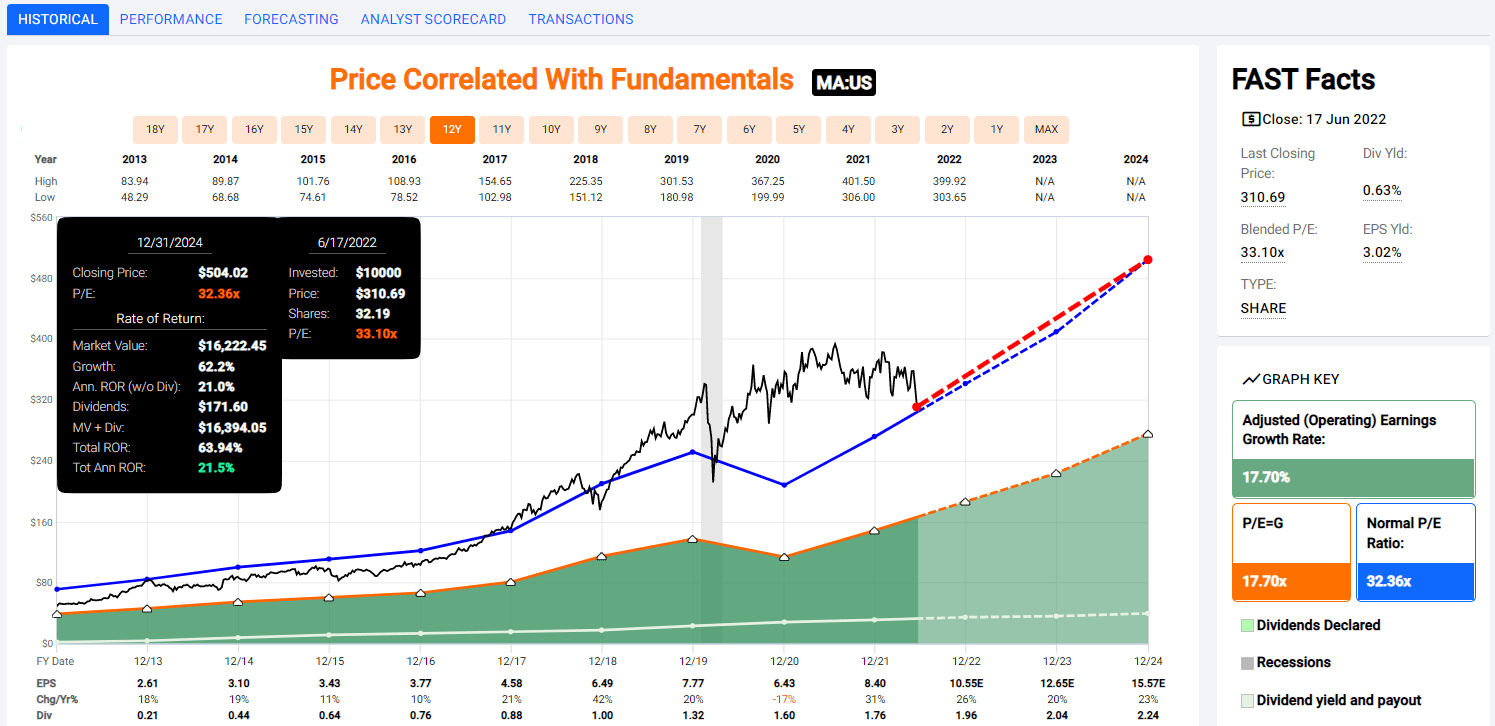
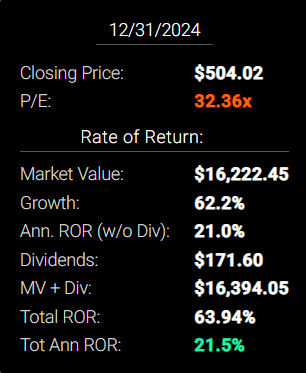
If MA grows as analysts expect by 2024, it could deliver 64% total returns or 22% annually.
- Buffett-like returns from a hyper-growth dividend growth Ultra SWAN
MA 2027 Consensus Total Return Potential
(Source: FAST Graphs, FactSet) (Source: FAST Graphs, FactSet)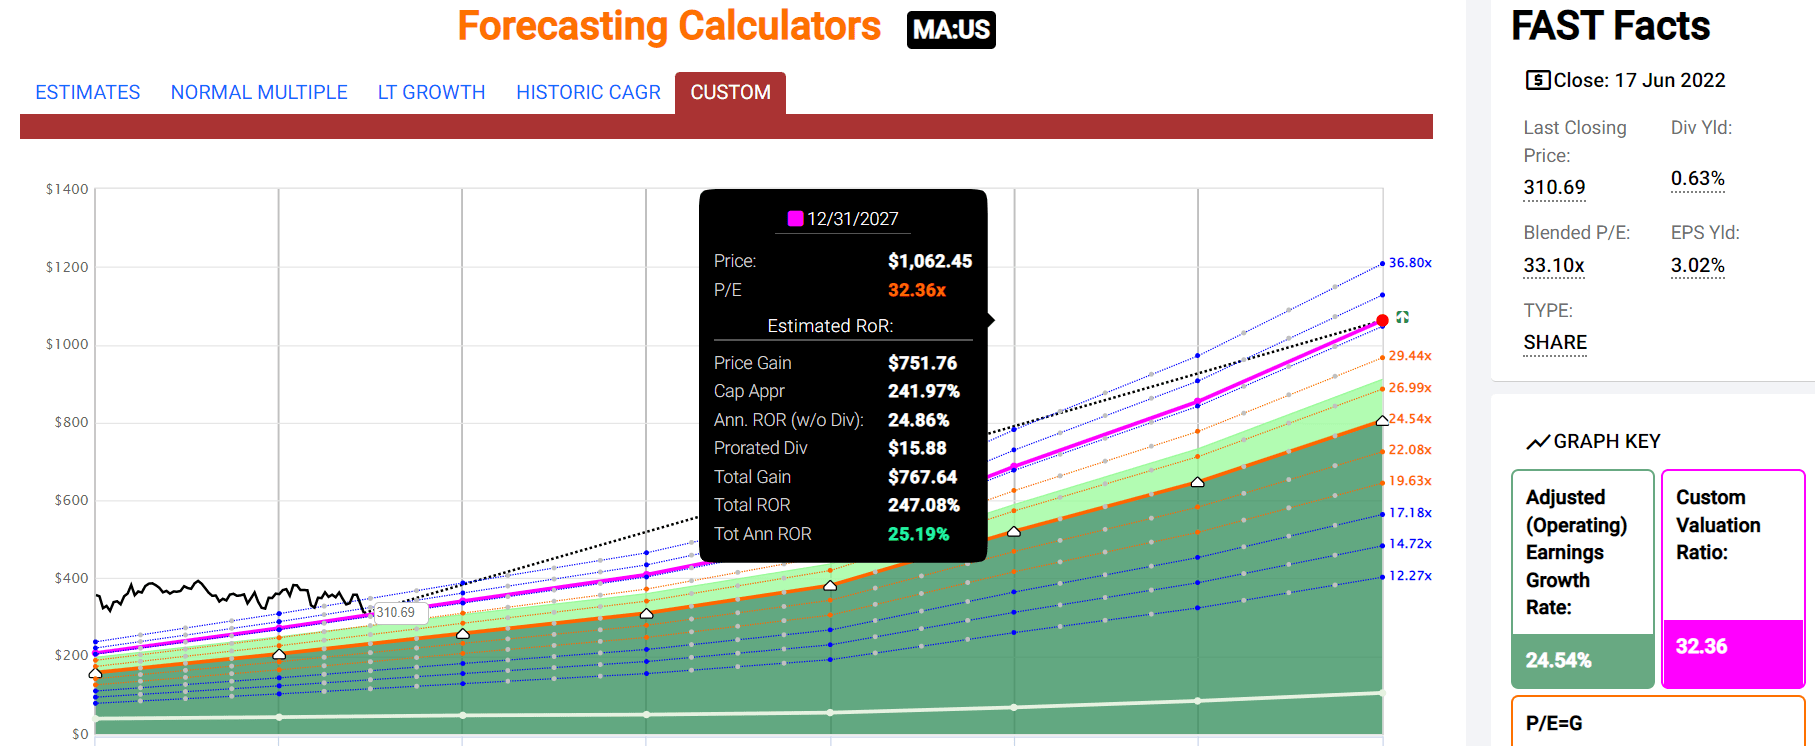
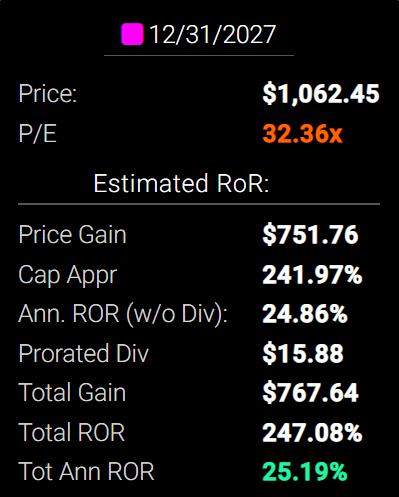
By 2027 if MA grows as expected and returns to historical fair value, it could deliver 247% total returns or 25% annually.
- about 5X the S&P 500 consensus
- Buffett-like return potential
MA Long-Term Consensus Total Return Potential
| Investment Strategy | Yield | LT Consensus Growth | LT Consensus Total Return Potential | Long-Term Risk-Adjusted Expected Return | Long-Term Inflation And Risk-Adjusted Expected Returns | Years To Double Your Inflation & Risk-Adjusted Wealth |
10-Year Inflation And Risk-Adjusted Expected Return |
| Mastercard | 0.6% | 24.3% | 24.9% | 17.4% | 15.0% | 4.8 | 4.03 |
| Nasdaq | 0.9% | 15.9% | 16.8% | 11.8% | 9.3% | 7.8 | 2.43 |
| Dividend Growth | 2.0% | 11.5% | 13.5% | 9.5% | 7.0% | 10.3 | 1.96 |
| Dividend Aristocrats | 2.4% | 8.5% | 10.9% | 7.6% | 5.2% | 14.0 | 1.65 |
| S&P 500 | 1.8% | 8.5% | 10.3% | 7.2% | 4.7% | 15.2 | 1.59 |
(Sources: Morningstar, FactSet, YCharts)
- Analysts expect MA to significantly outperform almost every growth investment strategy as well as the dividend aristocrats, and S&P 500 over the long term.
Inflation-Adjusted Consensus Return Potential: $1,000 Initial Investment
| Time Frame (Years) | 7.6% CAGR Inflation-Adjusted S&P Consensus | 8.4% Inflation-Adjusted Aristocrats Consensus | 22.4% CAGR Inflation-Adjusted MA Consensus | Difference Between Inflation-Adjusted MA Consensus Vs S&P Consensus |
| 5 | $1,445.67 | $1,493.29 | $2,750.67 | $1,305.00 |
| 10 | $2,089.97 | $2,229.92 | $7,566.21 | $5,476.24 |
| 15 | $3,021.42 | $3,329.92 | $20,812.19 | $17,790.77 |
| 20 | $4,367.98 | $4,972.54 | $57,247.56 | $52,879.58 |
| 25 | $6,314.67 | $7,425.45 | $157,469.42 | $151,154.75 |
| 30 | $9,128.95 | $11,088.36 | $433,147.17 | $424,018.22 |
(Source: DK Research Terminal, FactSet)
Even if MA only grows as analysts expect for 10 years, that’s about 8X inflation-adjusted return potential.
| Time Frame (Years) | Ratio Aristocrats/S&P Consensus | Ratio Inflation–Adjusted MA Consensus vs S&P consensus |
| 5 | 1.03 | 1.90 |
| 10 | 1.07 | 3.62 |
| 15 | 1.10 | 6.89 |
| 20 | 1.14 | 13.11 |
| 25 | 1.18 | 24.94 |
| 30 | 1.21 | 47.45 |
(Source: DK Research Terminal, FactSet)
Which is nearly 4X what analysts expect from the S&P 500 and dividend aristocrats.
MA Investment Decision Score
DK Dividend Kings Automated Investment Decision Tool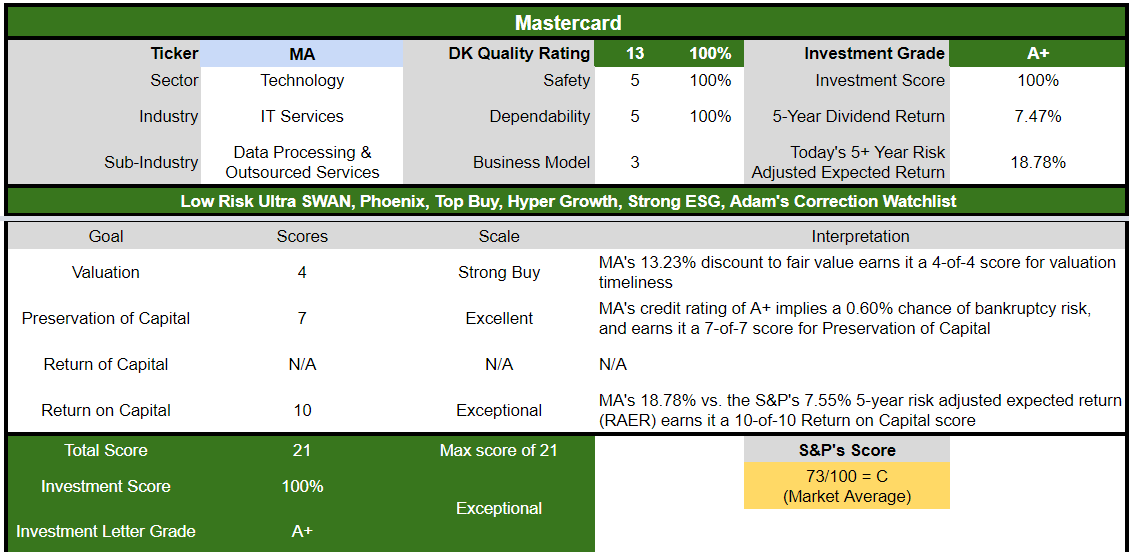
For anyone comfortable with its risk profile, MA is as close to a perfect hyper-growth dividend growth investment opportunity as exists on Wall Street.
- 13% discount vs 8% market discount = 5% better valuation
- much higher quality (as close to a perfect quality company as exists)
- potentially almost 150% higher long-term return potential than S&P 500 overtime
- about 2.5X better risk-adjusted expected return over the next five years
- about 2.5X more consensus dividends than the S&P 500 over the next five years
Amazon (AMZN): One Of The Best Hyper-Growth Stories In History Is Crazy, Stupid, Cheap
- a full deep-dive analysis of AMZN’s long-term thesis, risk profile, growth potential, valuation, and total return potential
- It’s Time To Back Up The Truck On Amazon
Reasons To Potentially Buy AMZN Today
- 97% quality medium-risk 13/13 hyper-growth Ultra SWAN
- 100% balance sheet safety score
- 46% undervalued (potential Ultra Value Strong Buy)
- Fair Value: $203.72
- 17.2X forward cash flow vs 25X to 27X historical
- 14.1X cash-adjusted earnings: hyper-growth at a wonderful price
- AA stable credit rating = 0.51% 30-year bankruptcy risk
- 52nd industry percentile risk management consensus = Average
- 17% to 46% CAGR margin-of-error growth consensus range
- 27.6% CAGR median growth consensus
- 5-year consensus total return potential: 34% to 39% CAGR
- base-case 5-year consensus return potential: 24% CAGR (6X S&P consensus)
- consensus 12-month total return forecast: 60%
- Fundamentally Justified 12-Month Returns: 84% CAGR
AMZN 2024 Consensus Total Return Potential
FAST Graphs, FactSet FAST Graphs, FactSet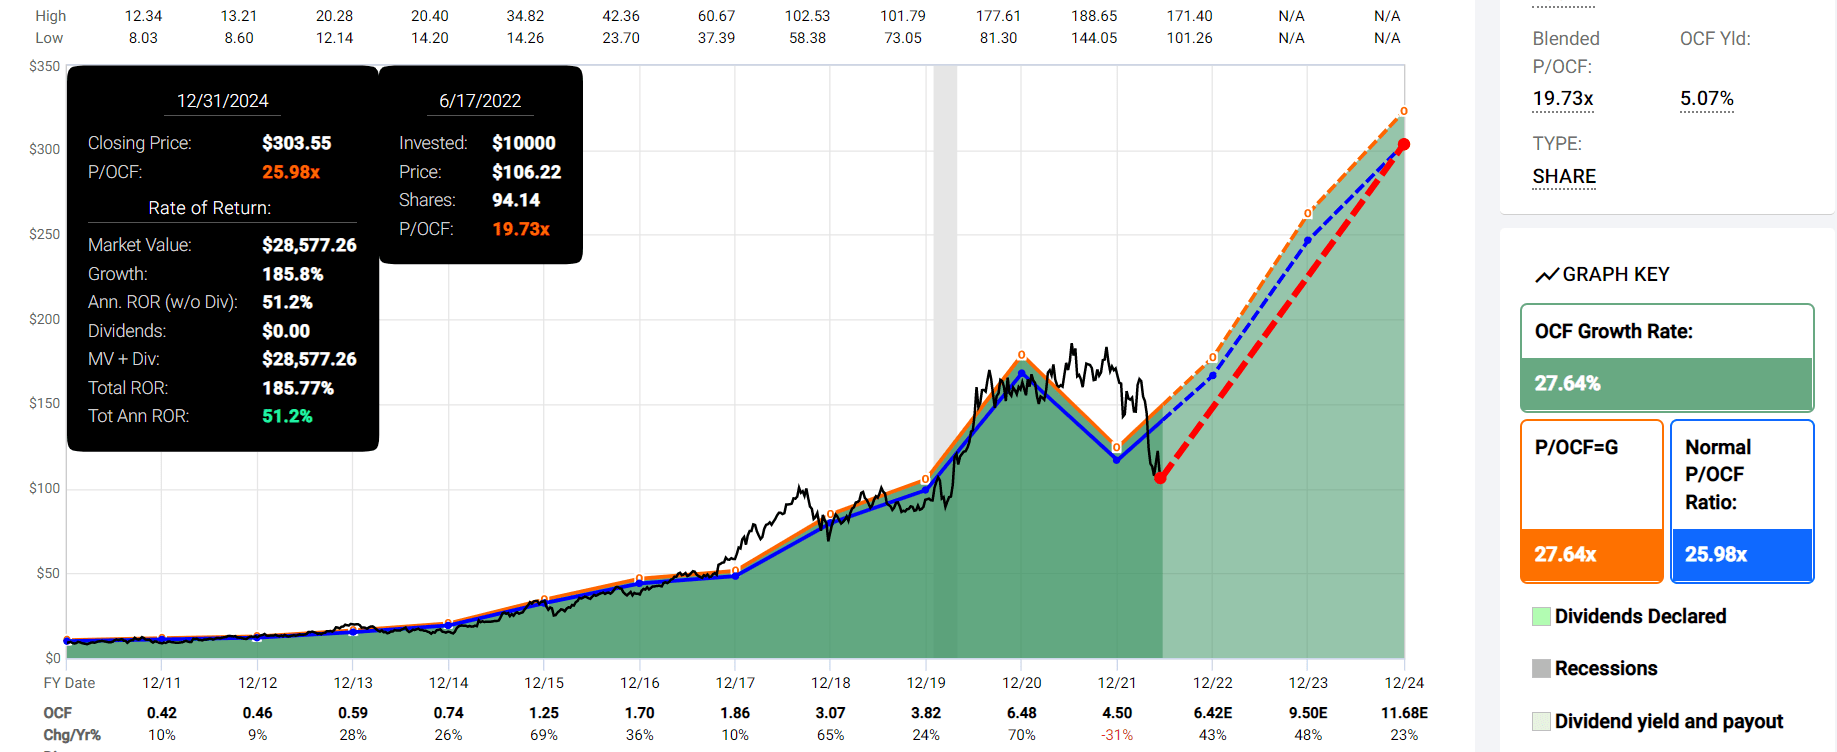
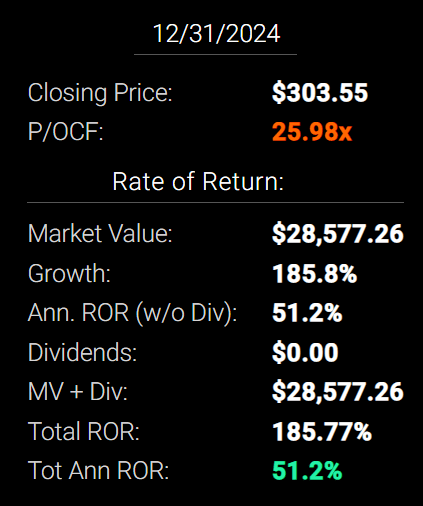
If AMZN grows as analysts expect by 2024, it could deliver 186% total returns or 51% annually.
- Buffett (and Joel Greenblatt)-like returns from an anti-bubble blue-chip bargain hiding in plain sight
AMZN 2027 Consensus Total Return Potential
FAST Graphs, FactSet FAST Graphs, FactSet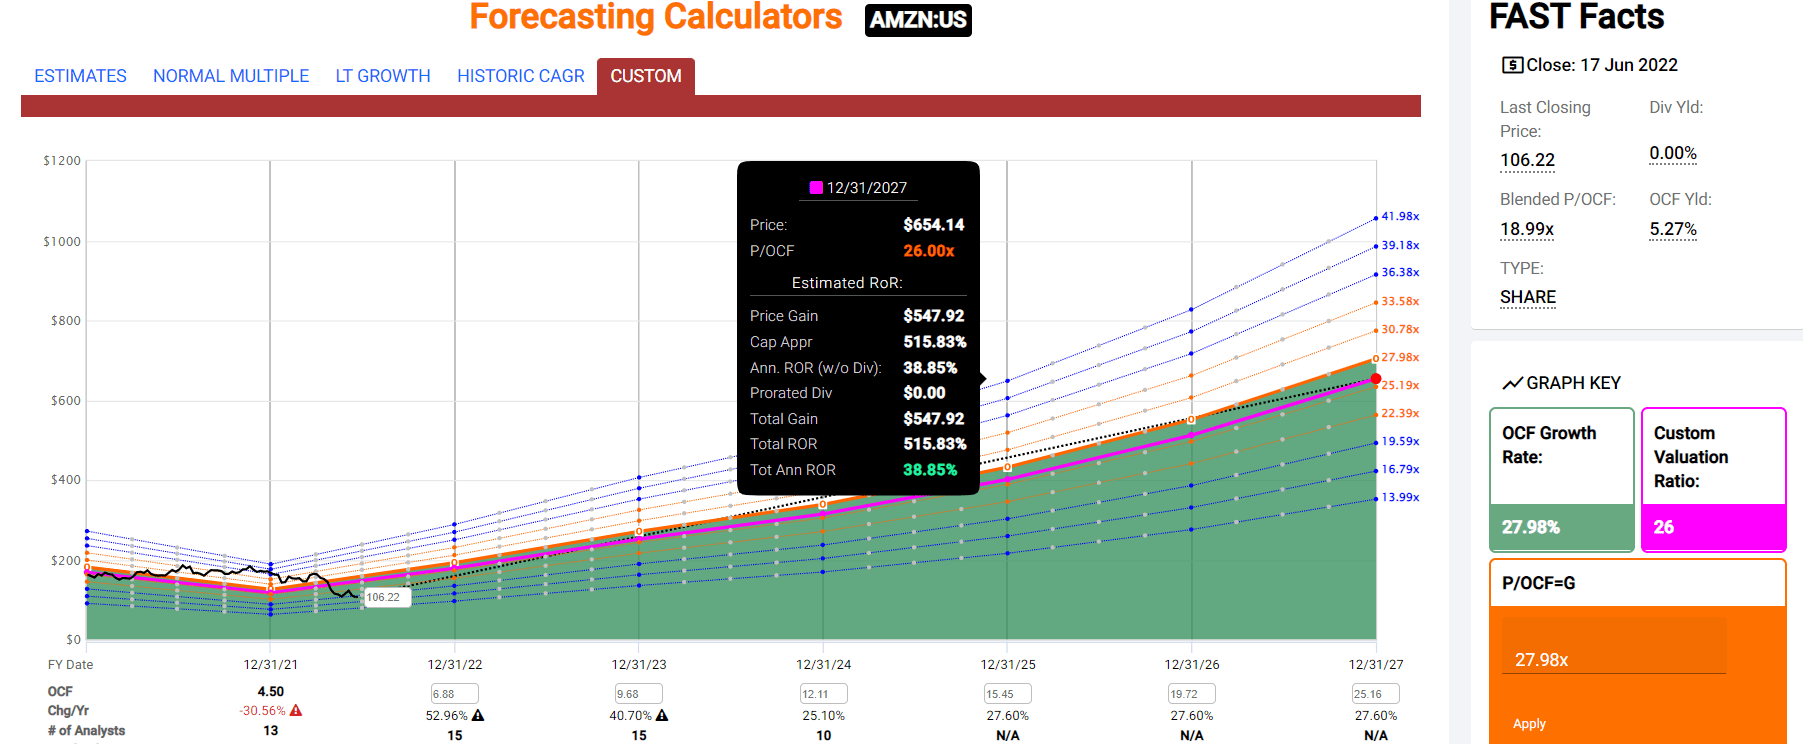
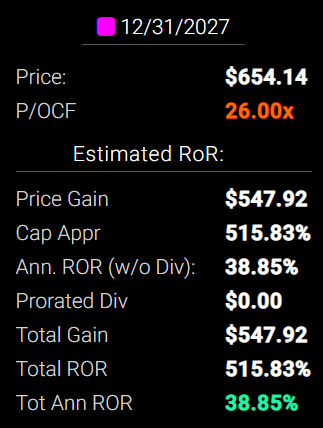
By 2027 if AMZN grows as expected and returns to historical fair value, it could deliver 516% total returns or 39% annually.
- about 9X the S&P 500 consensus
- Buffett-like return potential
AMZN Long-Term Consensus Total Return Potential
| Investment Strategy | Yield | LT Consensus Growth | LT Consensus Total Return Potential | Long-Term Risk-Adjusted Expected Return | Long-Term Inflation And Risk-Adjusted Expected Returns | Years To Double Your Inflation & Risk-Adjusted Wealth |
10-Year Inflation And Risk-Adjusted Expected Return |
| Amazon | 0.0% | 27.6% | 27.6% | 19.3% | 16.9% | 4.3 | 4.75 |
| Nasdaq | 0.9% | 15.9% | 16.8% | 11.8% | 9.3% | 7.8 | 2.43 |
| Dividend Growth | 2.0% | 11.5% | 13.5% | 9.5% | 7.0% | 10.3 | 1.96 |
| Dividend Aristocrats | 2.4% | 8.5% | 10.9% | 7.6% | 5.2% | 14.0 | 1.65 |
| S&P 500 | 1.8% | 8.5% | 10.3% | 7.2% | 4.7% | 15.2 | 1.59 |
(Sources: Morningstar, FactSet, YCharts)
- Analysts expect AMZN to significantly outperform almost every investment strategy as well as the dividend aristocrats, Nasdaq, and S&P 500 over the long term.
- only one Ultra SWAN offers superior long-term consensus return potential
Inflation-Adjusted Consensus Return Potential: $1,000 Initial Investment
| Time Frame (Years) | 7.6% CAGR Inflation-Adjusted S&P Consensus | 8.4% Inflation-Adjusted Aristocrats Consensus | 25.1% CAGR Inflation-Adjusted AMZN Consensus | Difference Between Inflation-Adjusted AMZN Consensus Vs S&P Consensus |
| 5 | $1,445.67 | $1,493.29 | $3,067.66 | $1,621.99 |
| 10 | $2,089.97 | $2,229.92 | $9,410.54 | $7,320.57 |
| 15 | $3,021.42 | $3,329.92 | $28,868.33 | $25,846.91 |
| 20 | $4,367.98 | $4,972.54 | $88,558.22 | $84,190.24 |
| 25 | $6,314.67 | $7,425.45 | $271,666.52 | $265,351.84 |
| 30 | $9,128.95 | $11,088.36 | $833,380.51 | $824,251.55 |
(Source: DK Research Terminal, FactSet)
Even if AMZN only grows as analysts expect for 10 years, that’s nearly 10X inflation-adjusted return potential.
| Time Frame (Years) | Ratio Aristocrats/S&P Consensus | Ratio Inflation–Adjusted AMZN Consensus vs S&P consensus |
| 5 | 1.03 | 2.12 |
| 10 | 1.07 | 4.50 |
| 15 | 1.10 | 9.55 |
| 20 | 1.14 | 20.27 |
| 25 | 1.18 | 43.02 |
| 30 | 1.21 | 91.29 |
(Source: DK Research Terminal, FactSet)
Which is nearly 5X what analysts expect from the S&P 500 and dividend aristocrats.
- completely ignoring its absurdly great discount to fair value
AMZN Investment Decision Score
DK Dividend Kings Automated Investment Decision Tool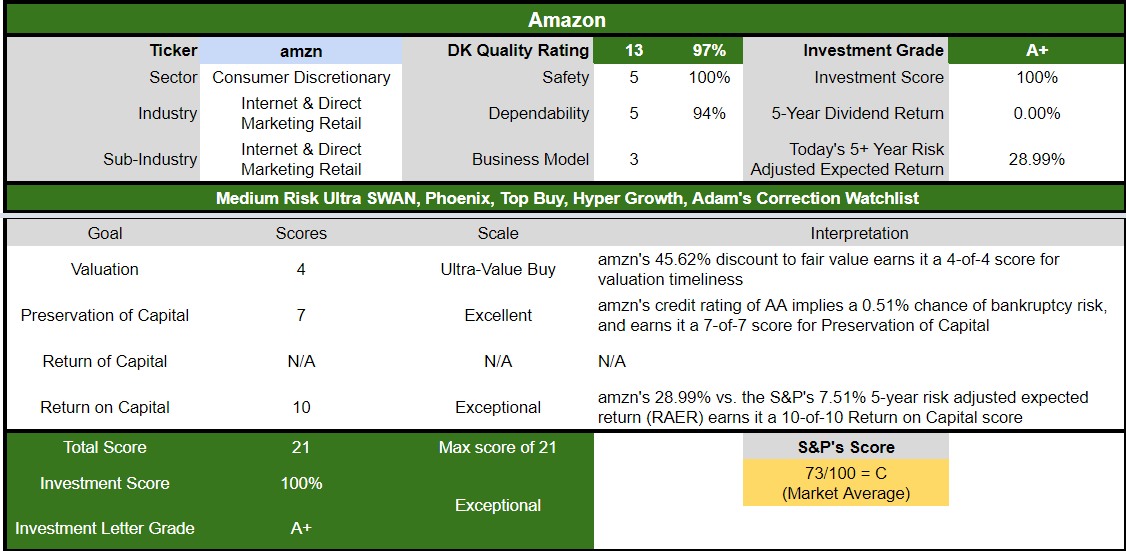
For anyone comfortable with its risk profile, AMZN as close to the perfect hyper-growth Ultra SWAN as you can buy today.
- 46% discount vs 8% market discount = 38% better valuation
- potentially 2.8X higher long-term return potential than S&P 500 overtime
- about 4X better risk-adjusted expected return over the next five years
Bottom Line: Buying Crashing Blue-Chips Are How You Get Rich During A Bear Market
Fortunes are made in bear markets.” – Todd Sullivan
I can’t tell you whether or not this bear market has bottomed yet, that will depend on whether or not we get a recession.
Daily Shot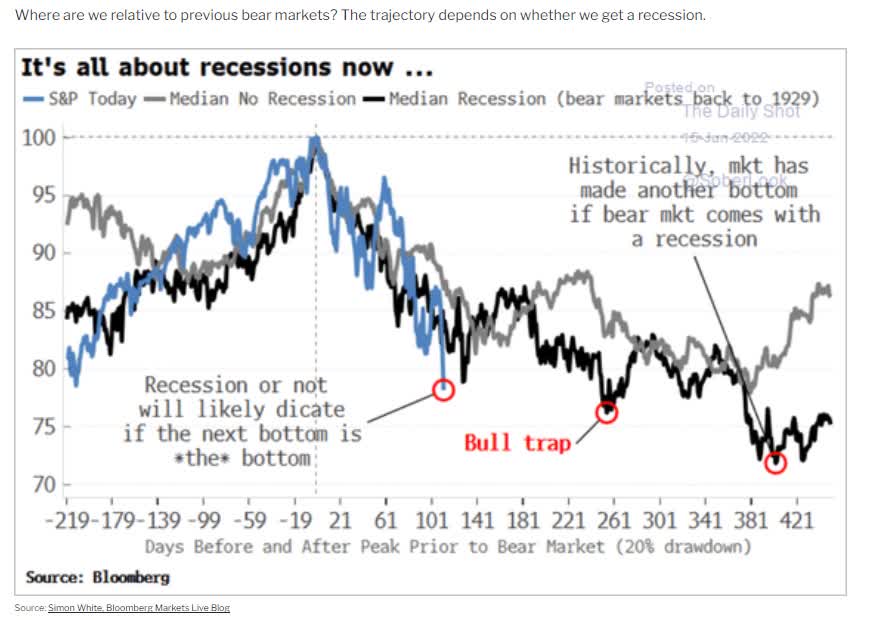
The historically average recessionary bear market has four bear market rallies, and we’ve now had three of those.
Naturally, each bear market is different and the consensus among analysts is that the market likely won’t bottom until the Fed pivots.
And that will depend on inflation.
Daily Shot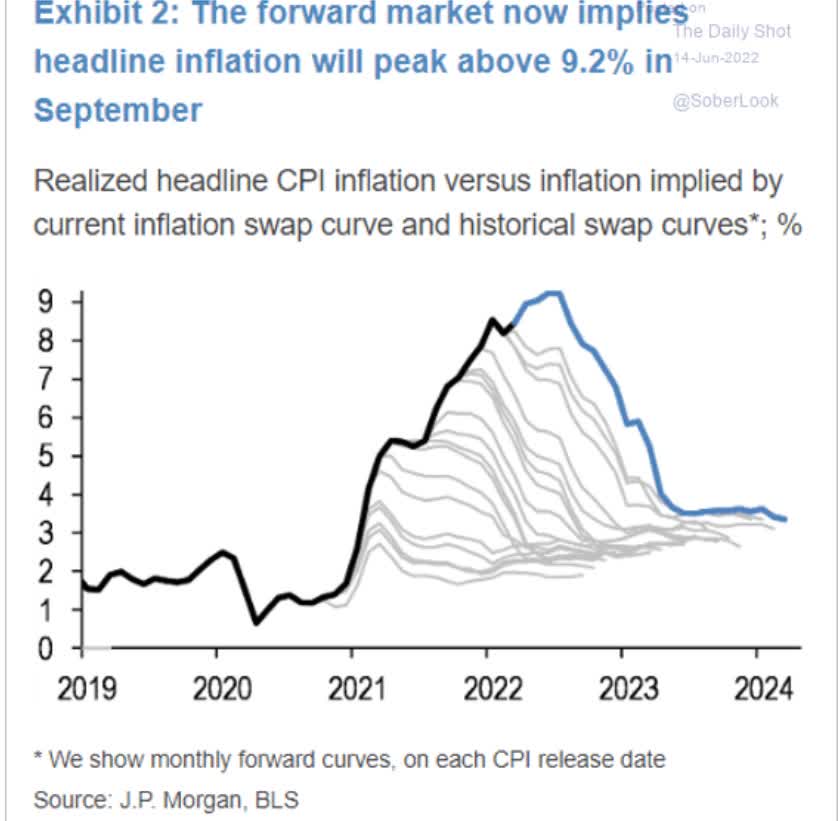
The commodities futures market is pricing in a peak inflation rate of 9.2% in September (the October CPI report).
Of course, this forecast could prove incorrect, either with inflation peaking sooner, or coming down slower than expected.
Cleveland Federal Reserve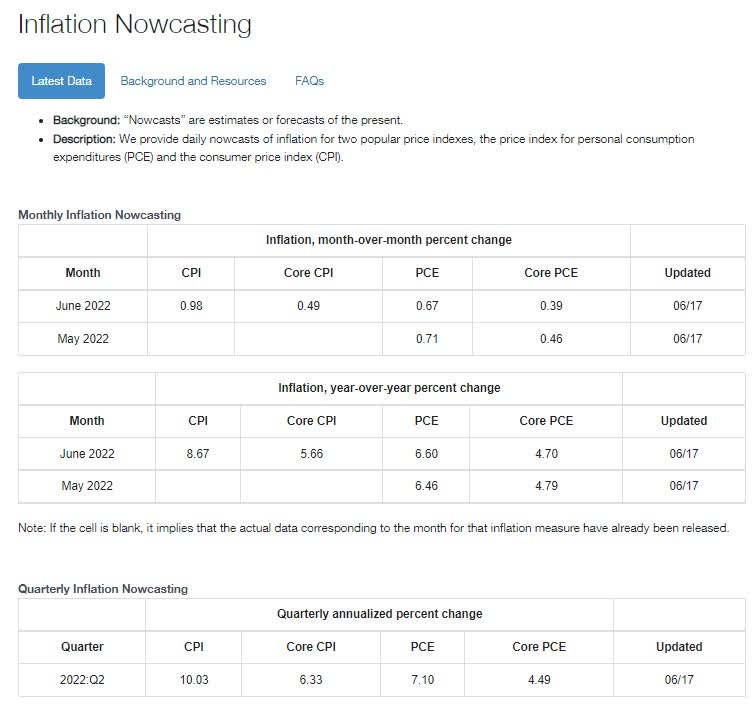
The Cleveland Fed’s economists are tracking inflation daily and estimate that we’re headed for 8.7% CPI in the July report.
- the FactSet economist consensus is also 8.7%
Does this mean that stocks are doomed to fall all summer? They easily could struggle with increased volatility but remember that bear markets don’t bottom because bad news stops coming.
- they bottom when the bad news is priced in
- and no one tells you when that is
My job as a long-term investor isn’t to try to time the exact market bottom. It’s only to buy the world’s best companies at reasonable to attractive valuation and then hold on for years or even decades.
Fortunes are made by buying right and holding on.” – Tom Phelps
I can’t tell you whether Enterprise, Mastercard, or Amazon have further to fall, but here’s something to consider.
- a 10% further decline boosts total returns over 30 years by 11% or 0.2% per year
- a 20% further decline boosts total returns by 25% over 30 years or 0.75% per year
When you can buy very safe yields of 8% and 150% to 516% potential total returns for the next five years, and possibly Buffett-like returns for many years beyond that, what is the greater risk?
- missing out entirely on such incredible blue-chip bargains because you’re trying to earn an extra 0.2% per year?
- or buying 10% to 20% above the final bottom (and still likely getting rich over time)?
I am buying steadily in this bear market because I have strong confidence that the world’s best companies will pull through this potential recession just as they always have.
If you don’t believe America or the world has a bright future then why are you invested in the stock market or reading this article?
It’s better to be approximately right than precisely wrong.” – Warren Buffett
There will always be doomsday prophets telling you how every bear market is a 50%, 60%, or even 90% crash.
Guess how often these doomsday permabears would tell you to buy the market? Never.
- not during the Great Recession’s 56% market crash (the 2nd worst in US history)
- not during the Pandemic 34% bear market
- not during the 2011 or 2018 bear markets
While it might feel great to have cash right now, never forget that cash is only safe in the short-term.
- in the long-term it’s guaranteed to earn almost nothing or even lose to inflation
Cash in a bear market is a powerful tool but also a potentially dangerous drug.
It’s easy to get addicted to cash and since you can’t tell bear market rallies from the start of a new bull market, if you fall in love with cash, you might end up owning it far too long.
- those who went to cash early in the Great Recession often stayed in cash for 5+ years while the market roared higher
For anyone with 5+ years to wait out whatever is coming next in this bear market, the time for blue-chip bargain hunting is now.
Not “all in” market timing bets, but steadily buying the world’s best blue-chips that can best meet your specific investing goals.
This is how you stop gambling in the market and start investing for your future.
This is how you can take charge of your financial destiny and let the world’s best blue-chips help you retire in safety and splendor.
Be the first to comment