

shapecharge
Dividend aristocrats are famous for their dependability, strong balance sheets, mature and stable businesses, and of course, having the safest dividends in the world.
Naturally, one might assume that an ETF comprised of these bluest of blue-chips is a great long-term investment strategy. However, that’s not always the case. I’ve been warning Dividend Kings members in our Preparing for Recession video series, which covers every facet of prudent investing in bear markets, including ETFs.
I recently covered three global aristocrat ETFs that sound great in theory but like market timing, don’t actually deliver good results over time. These three global aristocrats’ ETFs are some of the worst dividend growth investing options.
Fortunately, there is a way to safely and profitably invest in high-yield international aristocrats, and in this article, I’ll show you how.
But first, here are three global aristocrats’ ETFs that are best avoided.
3 Dangerous Dividend Aristocrat ETFs To Avoid
What are these three global aristocrat stocks you should avoid?
| Strategy | ETF | Ticker | Morningstar Rating | Expense Ratio | Yield |
| “Longest records of consistent dividend growth in the developed international markets” | ProShares MSCI EAFE Dividend Growers | (EFAD) | 2 Star Negative | 0.50% | 2.5% |
| “Focuses exclusively on the companies of the MSCI Europe Index with the longest records of consistent dividend growth.” | ProShares MSCI Europe Dividend Growers ETF | (EUDV) | 3 Star Neutral | 0.55% | 2.6% |
| “Focuses exclusively on the MSCI Emerging Markets Index companies with the longest records of consistent dividend growth.” | ProShares MSCI Emerg Mkts Dividend Growers | (EMDV) | 2 Star Negative | 0.61% | 3.8% |
| Average | 0.55% | 2.9% |
(Source: Morningstar)
They are ETFs that seek to find the most dependable dividend growth stocks in developed international markets, Europe, and emerging markets.
Their average 2.9% yields seem attractive, compared to the US aristocrats (NOBL) 2.4%, and much higher than the S&P 500’s 1.6% or Nasdaq’s 1.0%.
| ETF | Yield | Long-Term Growth Forecast (Morningstar) | LT Total Return Potential (Morningstar) | Risk-Adjusted Expected Return | 30-Year Risk & Inflation-Adjusted Expected Returns |
Time To Double (Years) |
| EFAD | 2.50% | 10.88% | 13.38% | 9.37% | 6.90% | 10.44 |
| EUDV | 2.55% | 9.44% | 11.99% | 8.39% | 5.92% | 12.16 |
| EMDV | 3.75% | 10.30% | 14.05% | 9.84% | 7.37% | 9.78 |
| Average | 2.93% | 10.21% | 13.14% | 9.20% | 6.73% | 10.79 |
(Source: Morningstar)
And their growth prospects, at least according to Morningstar’s analysts, seem very attractive.
- US aristocrat growth consensus 8.9%
- S&P 500 growth consensus 8.5% CAGR
Then again, market timing also sounds great in theory, but in practice, it’s anything but. That’s also the case with these international aristocrat ETFs.
But first, let’s look at what’s in these aristocrat ETFs and why they are too good to be true.
International Aristocrat ETFs: Great In Theory But Not In Real Life
See my special report for Dividend Kings for a deep dive into these ETFs.
But here is the summary, which is rather horrific returns, and highly variable and untrustworthy income.
History doesn’t repeat, but if often rhymes.” – Mark Twain
Past performance is no guarantee of future results. Still, studies show that over time, blue-chips with relatively stable fundamentals offer predictable returns based on yield, growth, and valuation mean reversion.
Bank of America
Over statistically significant periods, we can say with as much as 97% confidence that certain investment strategies and companies will keep generating good results over the long-term.
| Time Frame (Years) |
Total Returns Explained By Fundamentals/Valuations |
| 1 Day | 0.01% |
| 1 month | 0.25% |
| 3 months | 0.75% |
| 6 months | 1.5% |
| 1 | 3% (Short-Term) |
| 2 | 6% |
| 3 | 23% |
| 4 | 31% |
| 5 | 39% |
| 6 | 47% |
| 7 | 55% (Medium-Term) |
| 8 | 62% |
| 9 | 70% |
| 10 | 78% |
| 11+ | 90% to 91% (Long-Term) |
| 30+ | 97% (Very Long-Term) |
(Sources: JPMorgan, Bank of America, Princeton, Fidelity, RIA)
So let’s look at how these international ETFs has done historically compared to the US aristocrats.
Total Returns Since February 2016 (47% Statistically Significant)
Portfolio Visualizer Premium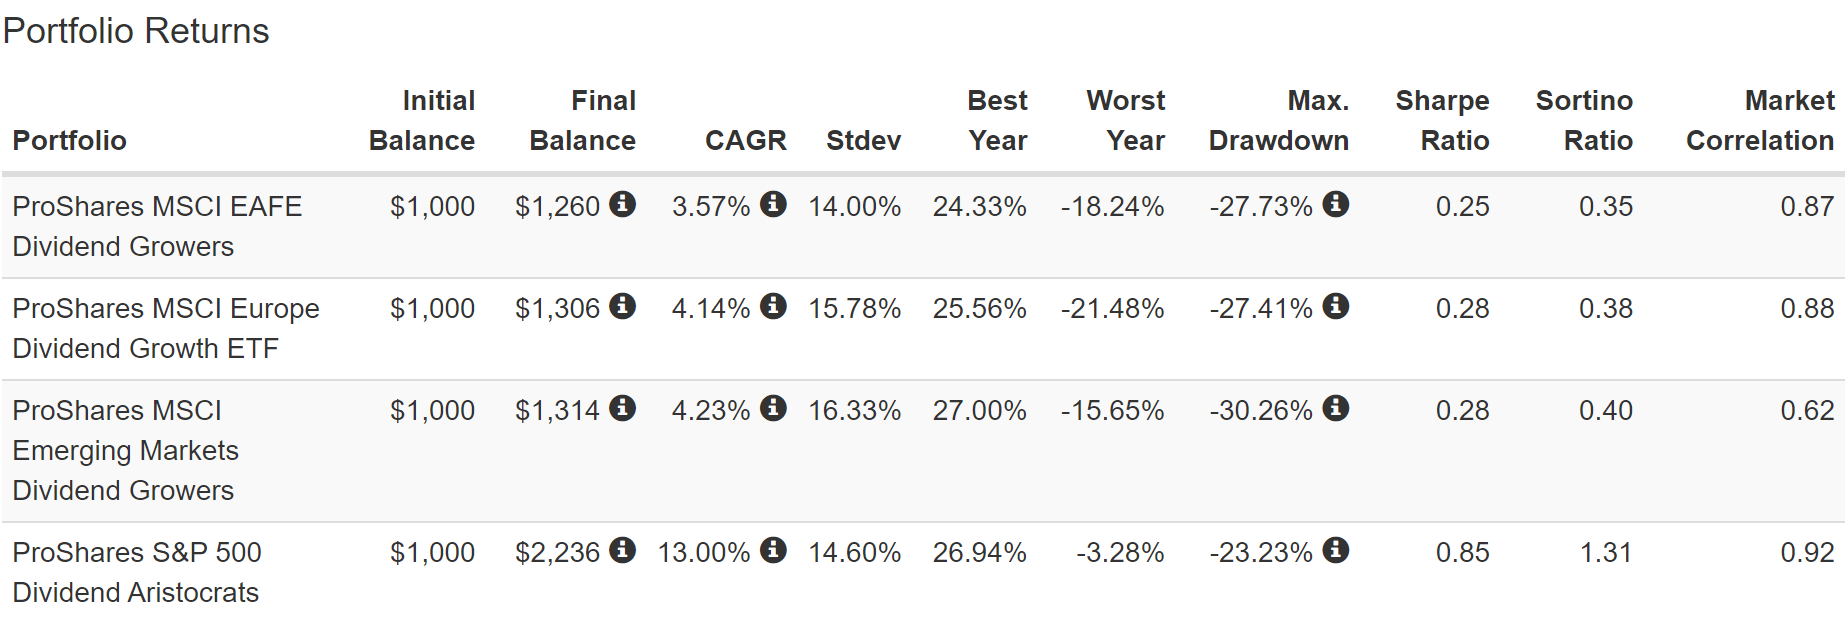
The international aristocrat ETFs all woefully underperformed the US aristocrats by about 70% per year. They also delivered higher volatility during times of peak market stress, such as the Pandemic crash.
Portfolio Visualizer Premium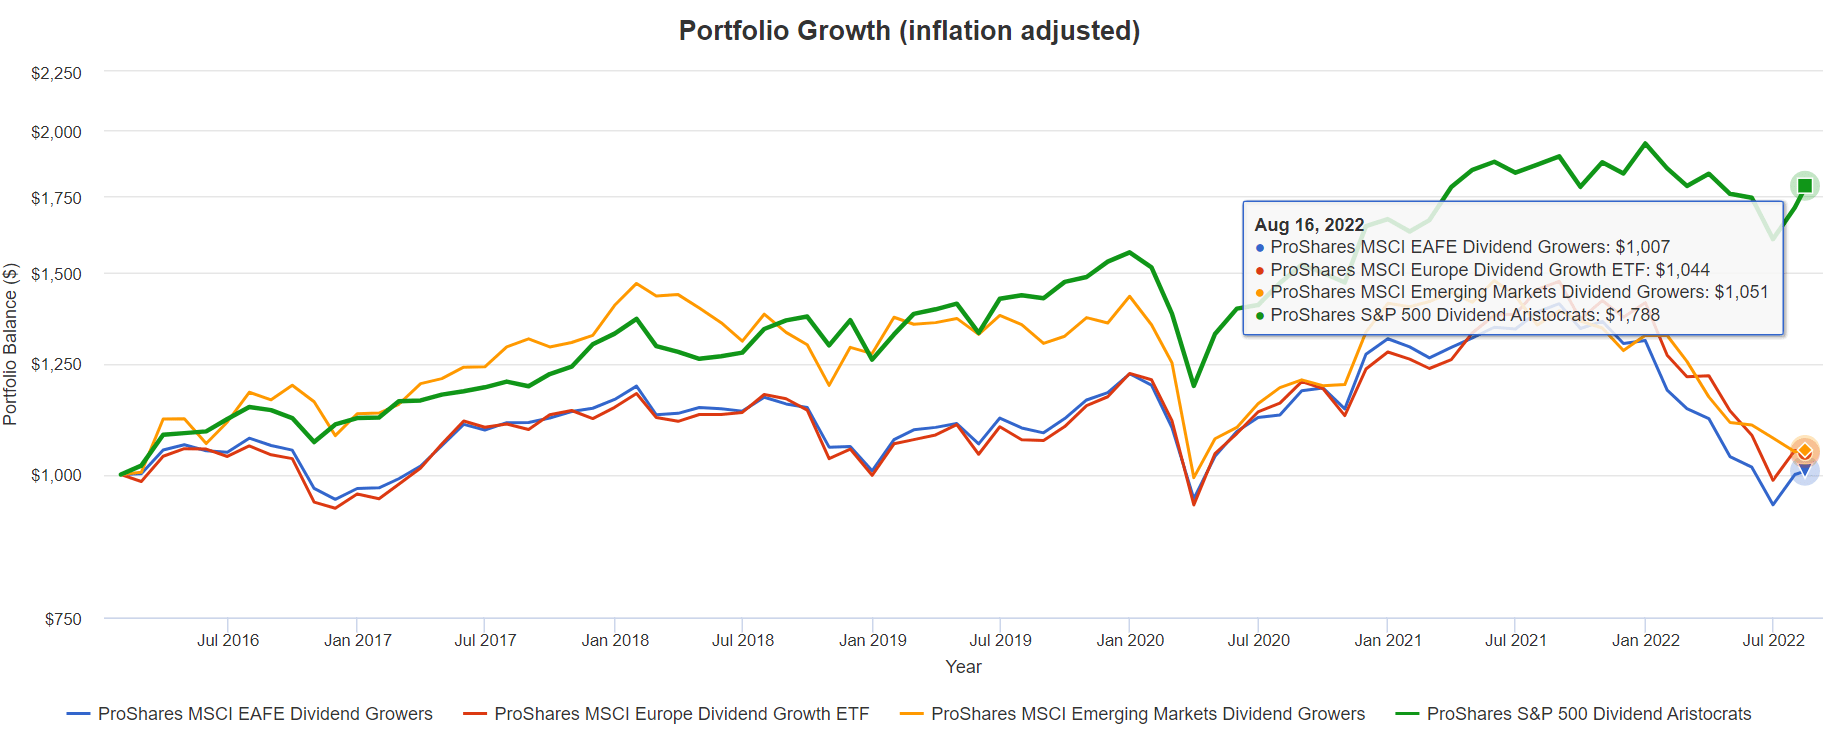
Looking at their inflation-adjusted returns, things look even worse.
| Stock | Ticker | Inflation-Adjusted Return Since February 2016 |
Annual Real Return Since February 2016 |
| ProShares MSCI EAFE Dividend Growers | EFAD | 0.7% | 0.12% |
| ProShares MSCI Europe Dividend Growth ETF | EUDV | 4.4% | 0.72% |
| ProShares MSCI Emerging Markets Dividend Growers | EMDV | 5.10% | 0.83% |
| ProShares S&P 500 Dividend Aristocrats | NOBL | 78.8% | 10.2% |
(Source: Portfolio Visualizer Premium)
These international aristocrat ETFs delivered virtually no returns for the last six years when adjusted for inflation. US aristocrats delivered 10% annular returns.
But isn’t six years too short a time frame to pass judgment on an investing strategy? Indeed it is, and there is a 53% statistical chance that these aristocrat ETFs delivered poor returns out of bad luck and through no fault in strategy or company quality.
So let’s zoom out another year and see if things improve any.
Total Returns Since October 2015 (55% Statistically Significant)
Portfolio Visualizer Premium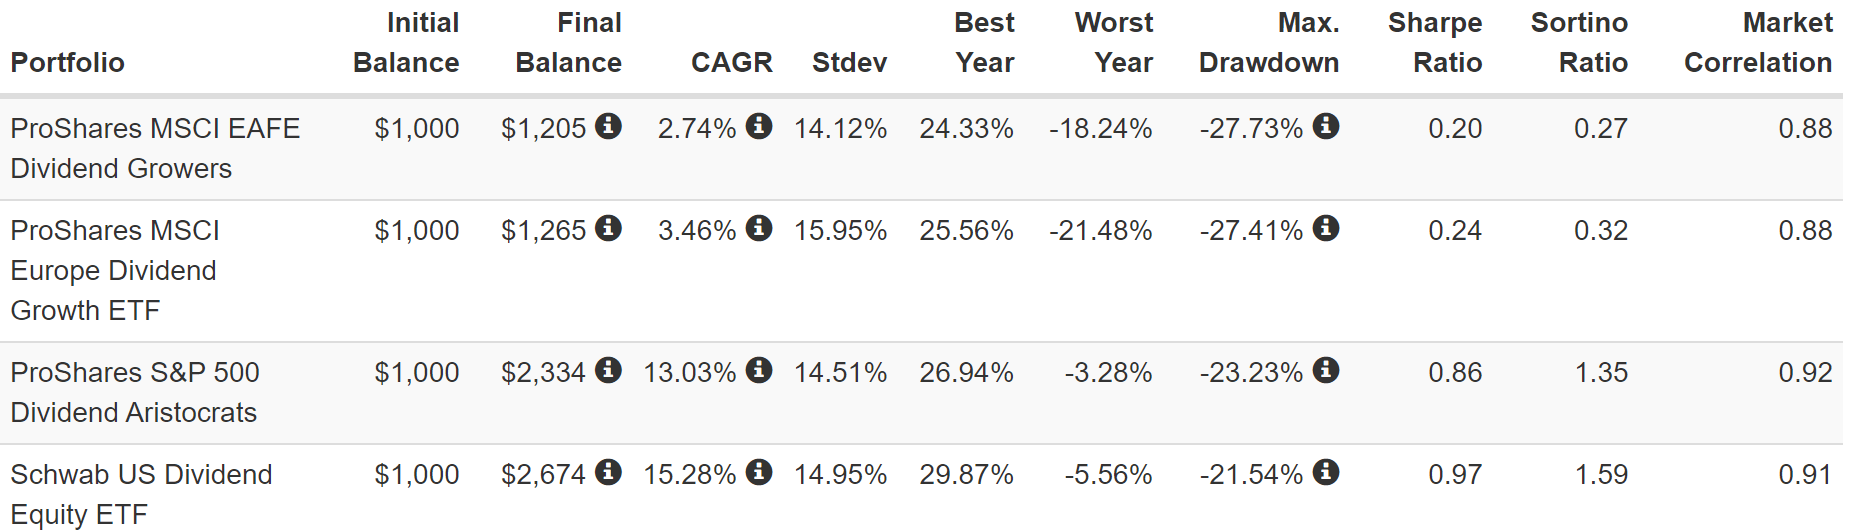
Over the last seven years, the international aristocrat ETFs performed even more poorly, with 80% lower negative volatility-adjusted returns than the US aristocrats (Sortino ratio).
Adjust for inflation, and things look even worse.
Portfolio Visualizer Premium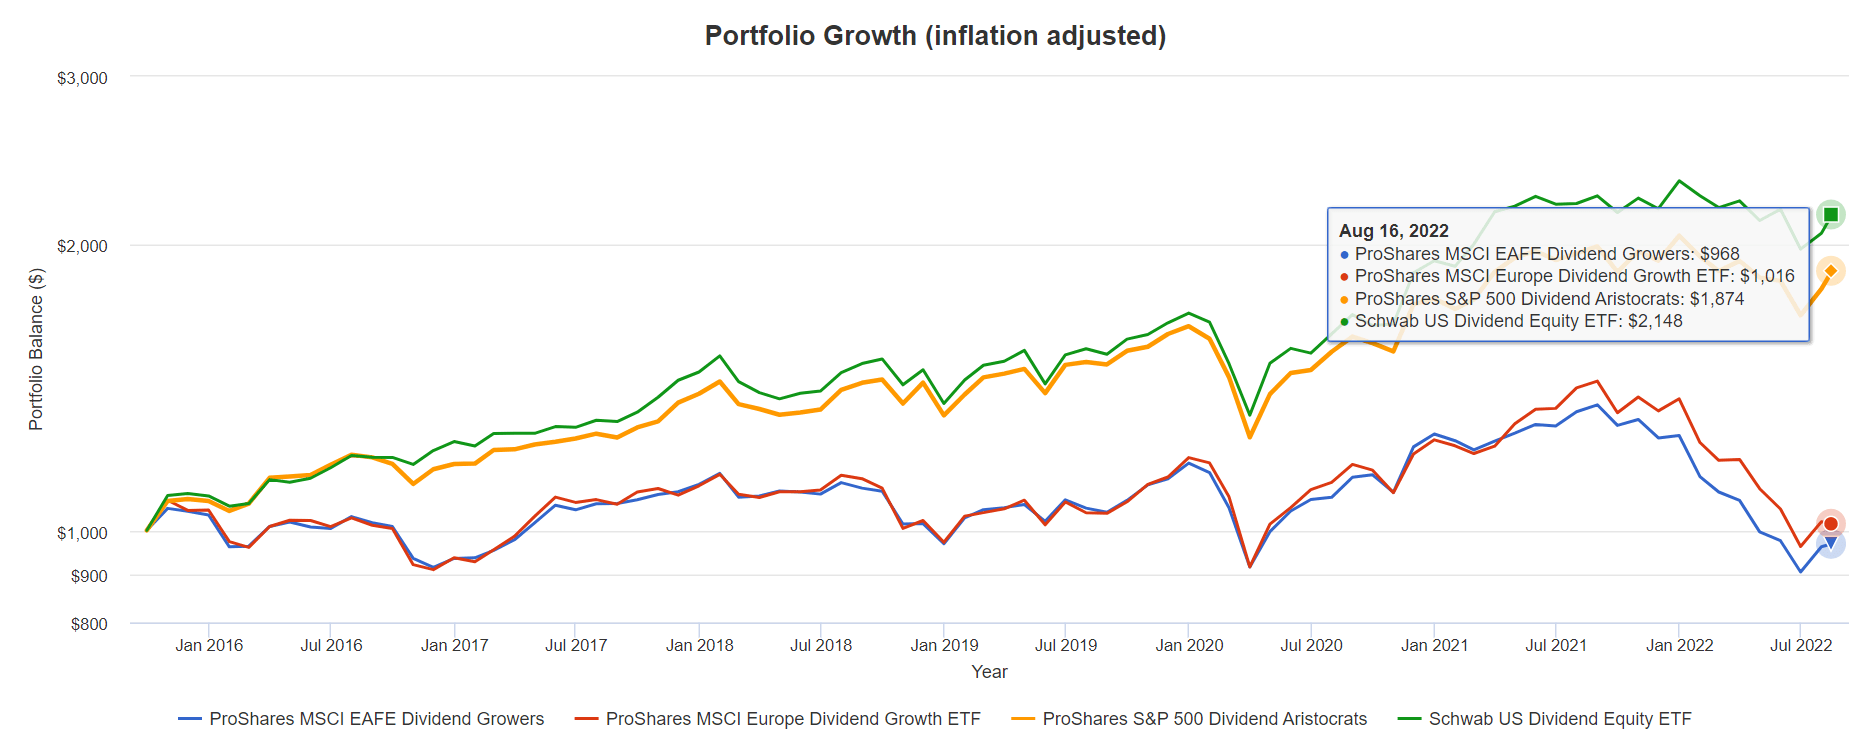
How would you like to lose money over seven years owning the supposedly most dependable international dividend blue-chips?
| Stock | Ticker | Inflation-Adjusted Return Since February 2016 |
Annual Real Return Since February 2016 |
| ProShares MSCI EAFE Dividend Growers | EFAD | -3.2% | -0.46% |
| ProShares MSCI Europe Dividend Growth ETF | EUDV | 2.1% | 0.30% |
| ProShares S&P 500 Dividend Aristocrats | NOBL | 87.40% | 9.40% |
| Schwab US Dividend Equity ETF | SCHD | 114.8% | 11.5% |
(Source: Portfolio Visualizer Premium)
International and European aristocrats delivered returns worse than cash, while US aristocrats and high-yield blue-chips doubled your money.
OK, but what if it’s still just bad luck? Let’s zoom out one more year to look at how the oldest international ETF, EFAD, performed compared to far superior US dividend growth ETFs.
Total Returns Since September 2014 (62% Statistically Significant)
Portfolio Visualizer Premium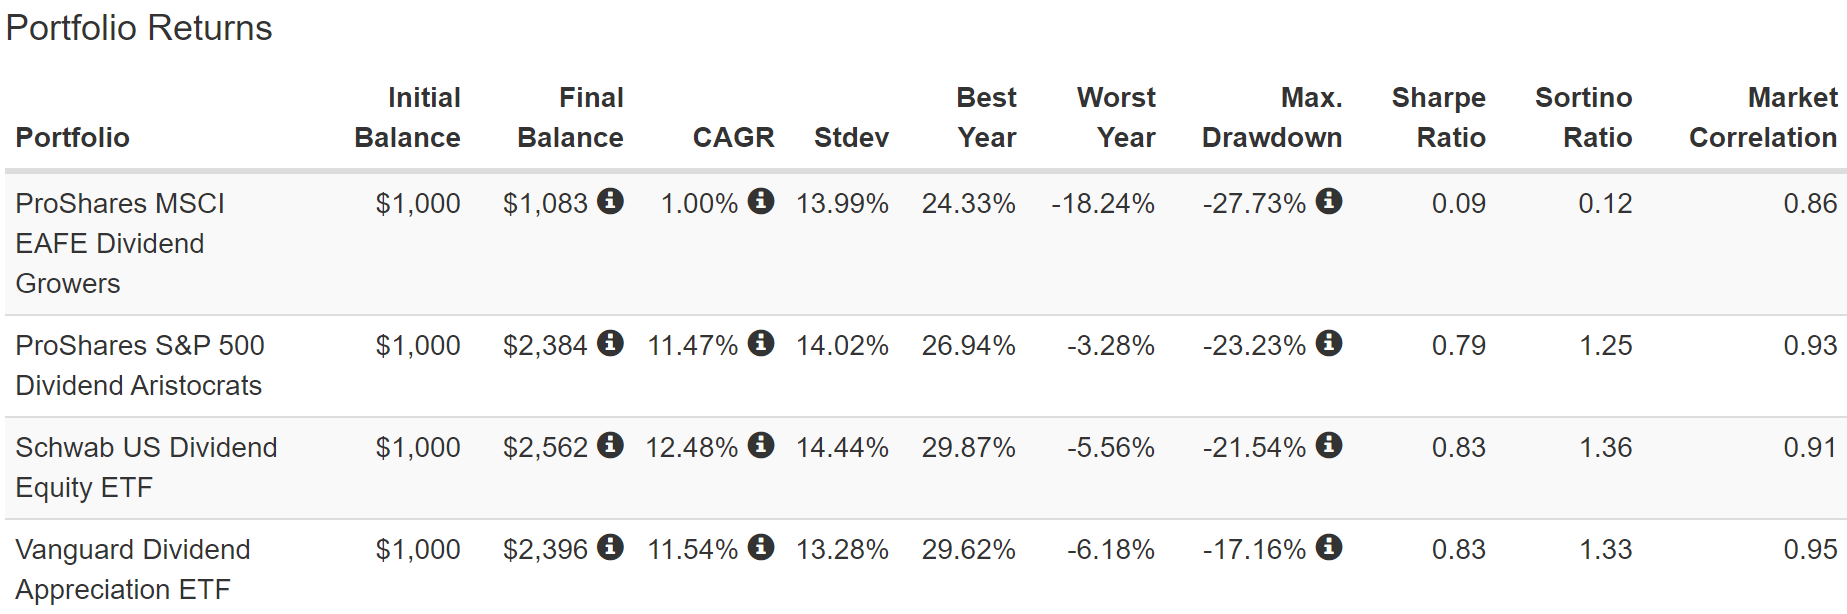
Believe it or not, international aristocrats performed even worse over the last eight years, with just 1% annual returns and 90% lower negative volatility-adjusted returns than the US aristocrats.
And what about real, inflation-adjusted returns?
Portfolio Visualizer Premium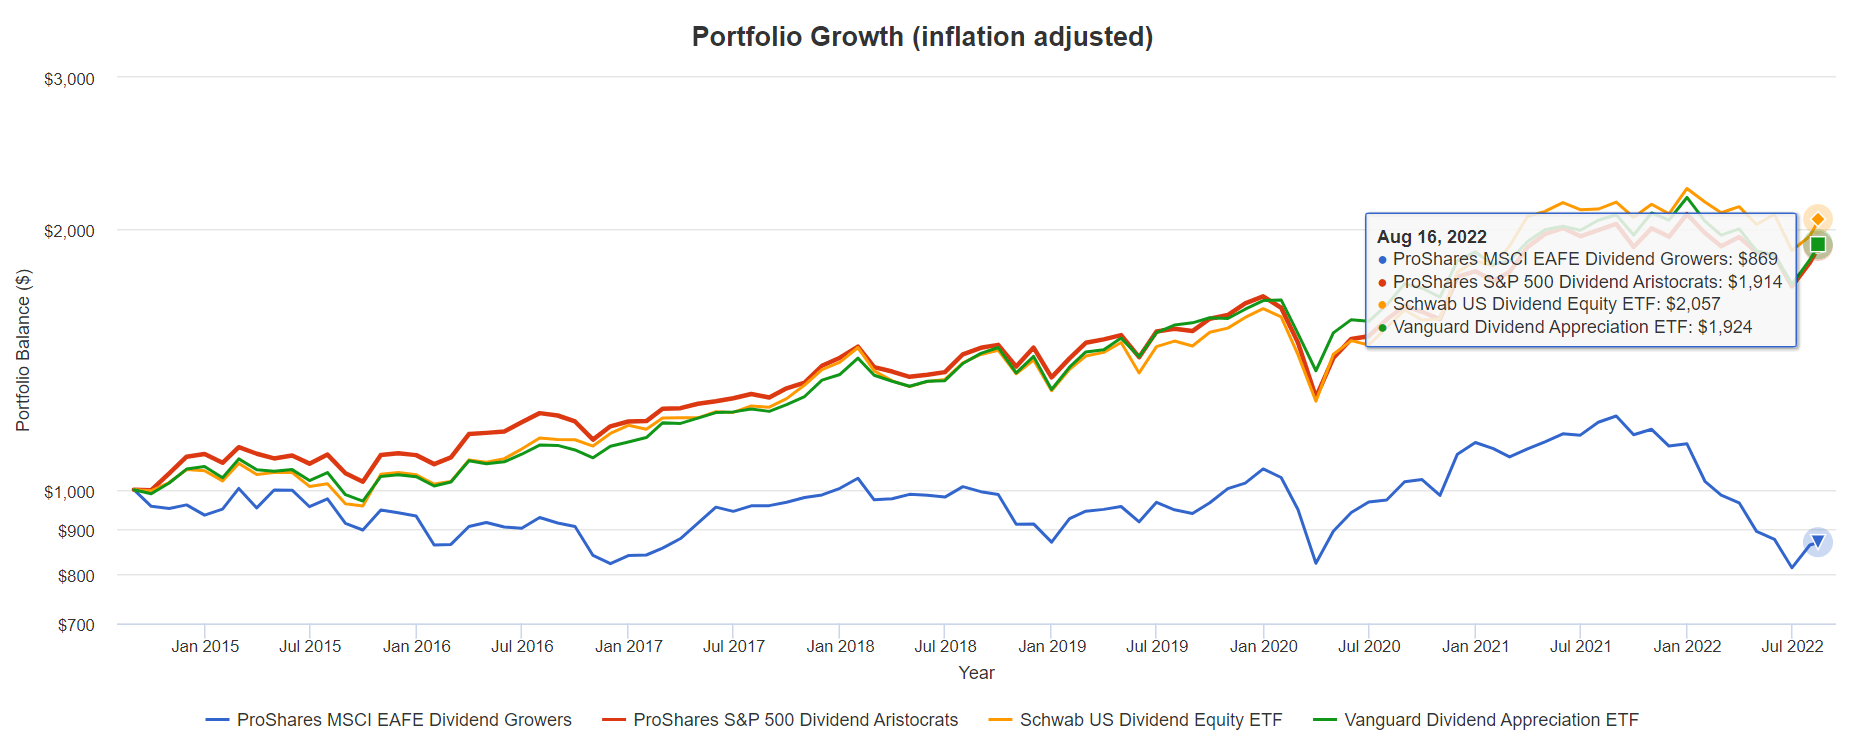
The international aristocrats have spent the last eight years in a bear market. Did a decade-long recession ravage the world? No, it experienced modest but relatively steady growth.
| Stock | Ticker | Inflation-Adjusted Return Since February 2016 |
Annual Real Return Since February 2016 |
| ProShares MSCI EAFE Dividend Growers | EFAD | -13.1% | -1.74% |
| ProShares S&P 500 Dividend Aristocrats | NOBL | 91.4% | 8.45% |
| Vanguard Dividend Appreciation ETF | VIG | 92.4% | 8.52% |
| Schwab US Dividend Equity ETF | SCHD | 105.7% | 9.43% |
(Source: Portfolio Visualizer Premium)
Negative 13% real returns after eight years compared to solid 8% to 9% real returns from the American dividend blue-chips.
OK, but maybe it’s all bad luck in measuring at the start of a bear market and ending in a bear market? So let’s check the average annual rolling return, which can give a more accurate assessment of this ETF over eight years.
Portfolio Visualizer Premium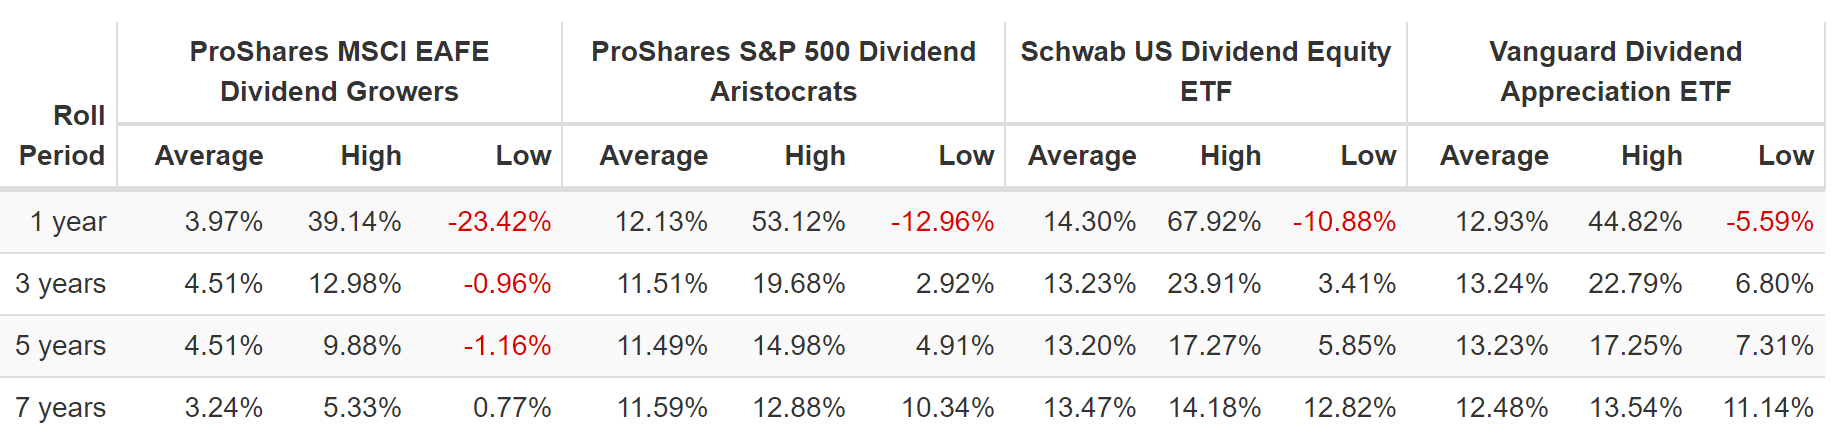
Nope, the average annual return is 4%, 2% adjusted for inflation. Guess what else delivered 2% real returns over these eight years? Bonds, but with 5X less volatility than European aristocrats.
But do you know what’s most shocking and horrifying for investors in International aristocrats? That the supposedly most dependable dividend growth stocks didn’t deliver very dependable income growth, except in one direction, down.
Portfolio Visualizer Premium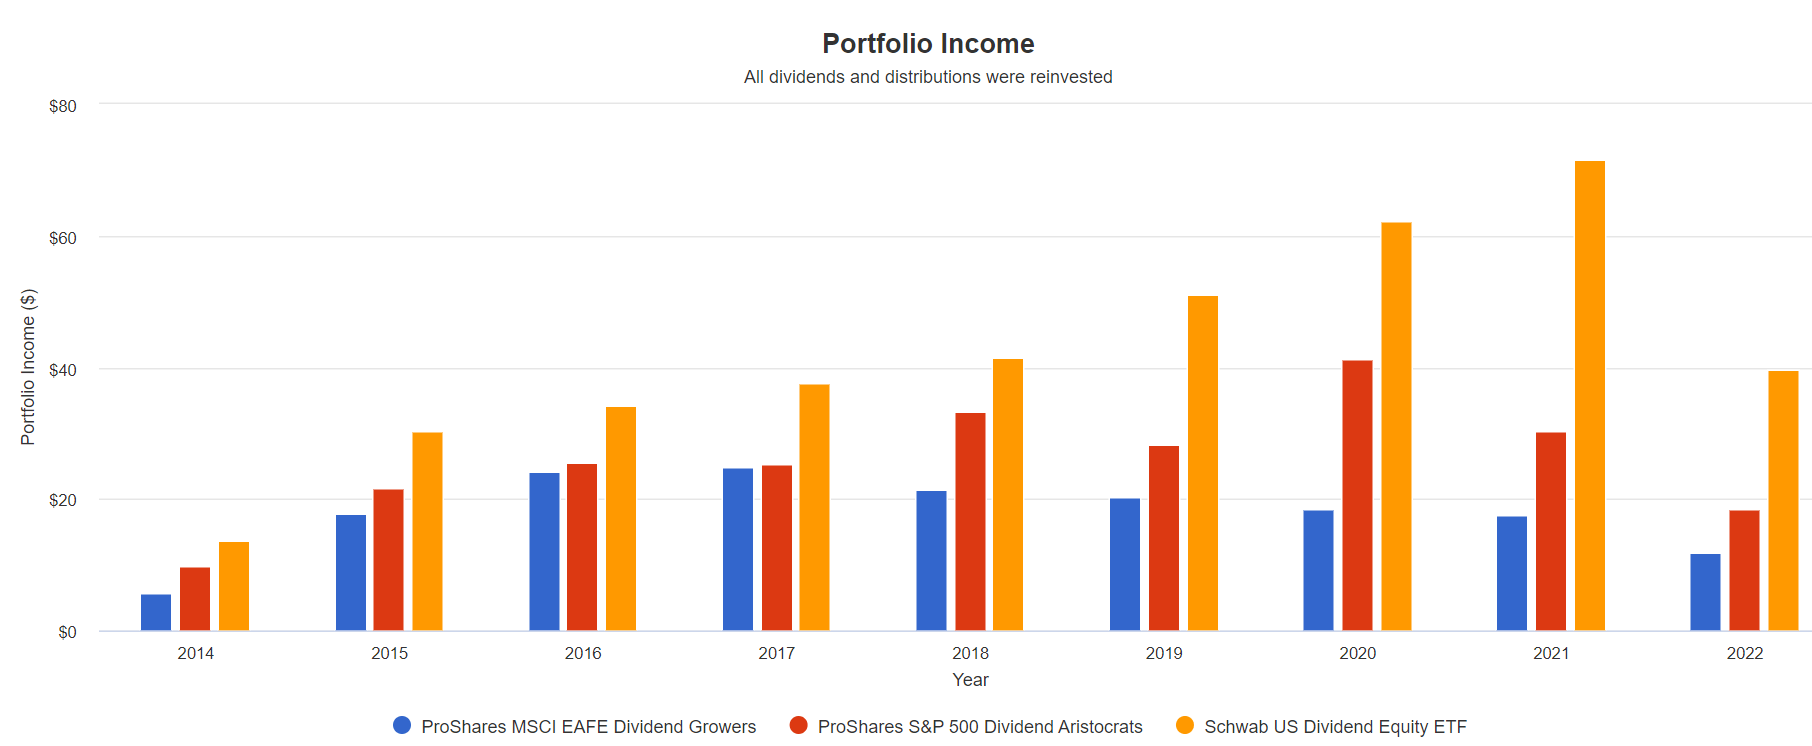
Since peaking in 2017, the international aristocrats have delivered steadily lower income until 2022, when they are on track to deliver the same annual income as in 2017.
- even with dividend reinvestment
- in a bear market, when dividend compounding works best
Cumulative Dividend Since 2015: $1,000 Initial Investment
| Metric | ProShares MSCI EAFE Dividend Growers |
ProShares S&P 500 Dividend Aristocrats |
Vanguard Dividend Appreciation ETF |
Schwab US Dividend Equity ETF |
| Total Dividends | $168 | $241 | $246 | $407 |
| Annualized Income Growth Rate | 3.66% | 6.35% | 7.25% | 13.04% |
| Total Income/Initial Investment | 0.17 | 0.24 | 0.25 | 0.41 |
| Inflation-Adjusted Income/Initial Investment | 0.13 | 0.19 | 0.19 | 0.32 |
| More Inflation-Adjusted Income Than EFAD | NA | 1.43 | 1.46 | 2.42 |
(Source: Portfolio Visualizer Premium)
That’s not to say the US aristocrats deliver annual income increases either. For a pure aristocrat portfolio, NOBL has surprising annual income volatility. But NOBL has never delivered two negative years of income growth in a row and has grown its dividends at 2X the rate of EFAD.
VIG is famous for the steadiest annual dividend growth of any ETF, never suffering an annual income decline even in the Great Recession.
SCHD is famous for the best and very dependable annual income growth, up every year since it began in 2011.
SCHD Annual Income Growth Since 2011: Gold Standard Dependability
(Source: Portfolio Visualizer Premium)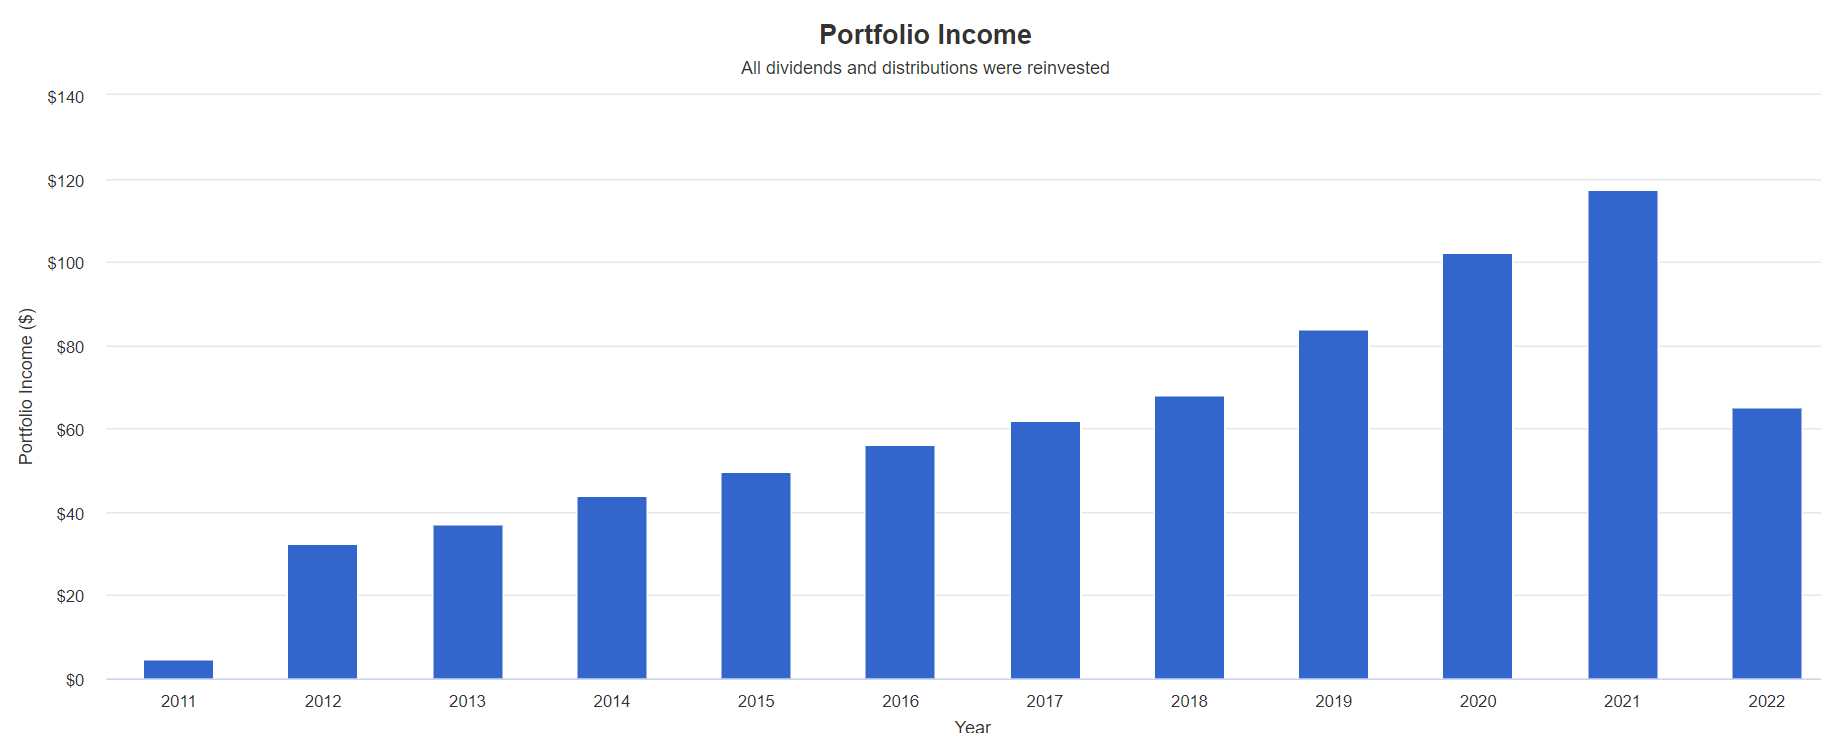
NOBL Annual Income Growth Since 2011: Dependable But Not Growing Every Year
(Source: Portfolio Visualizer Premium)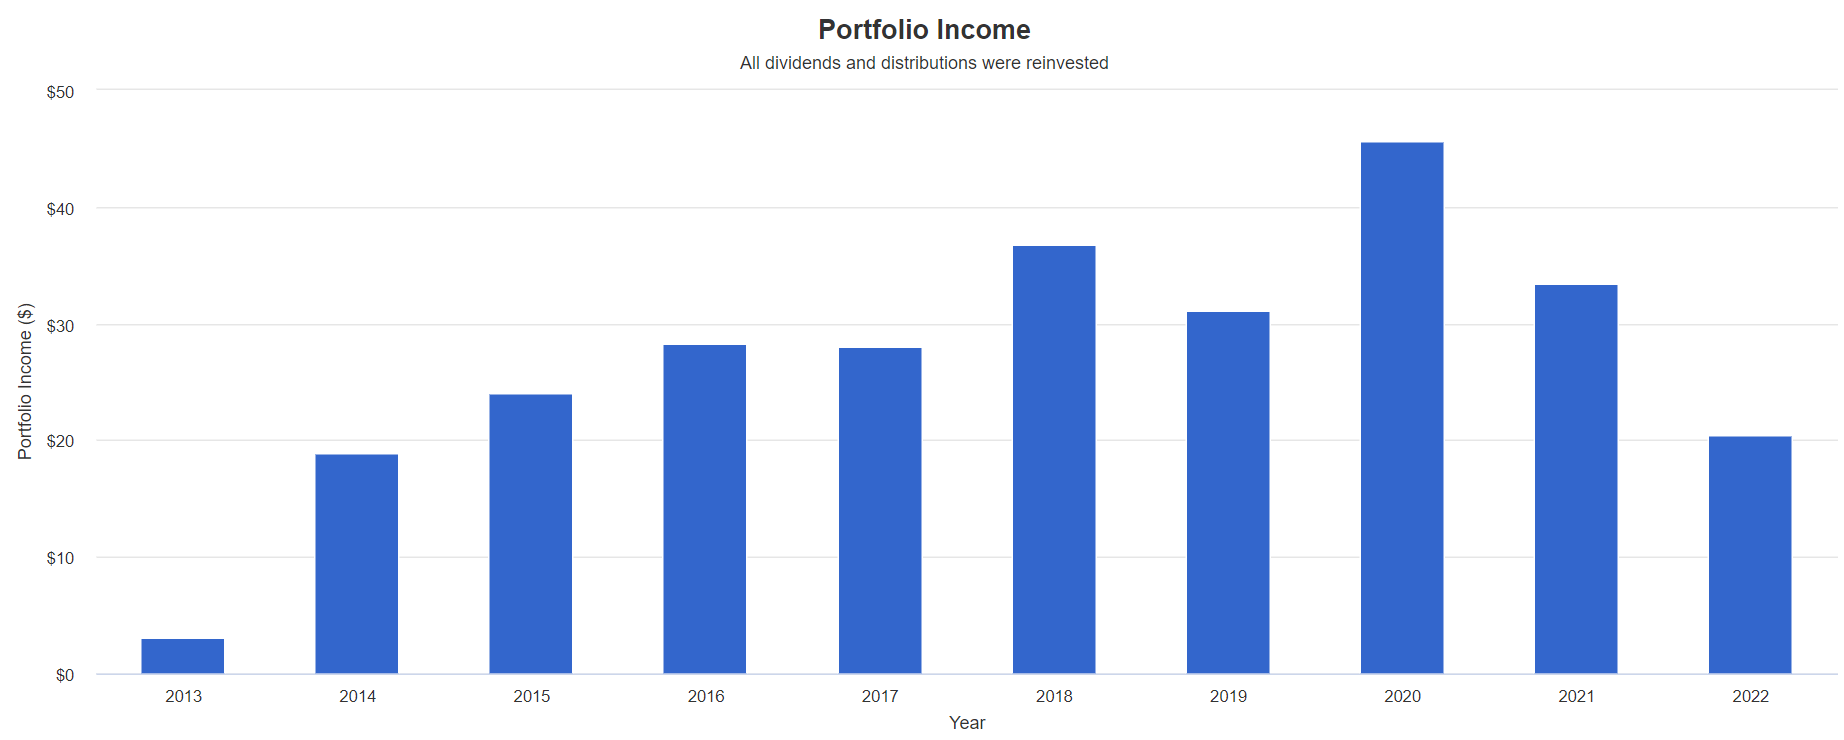
100% aristocrats don’t ensure your income rises every year.
VIG Annual Income Growth Since 2006: Gold Standard Income Dependability
(Source: Portfolio Visualizer Premium)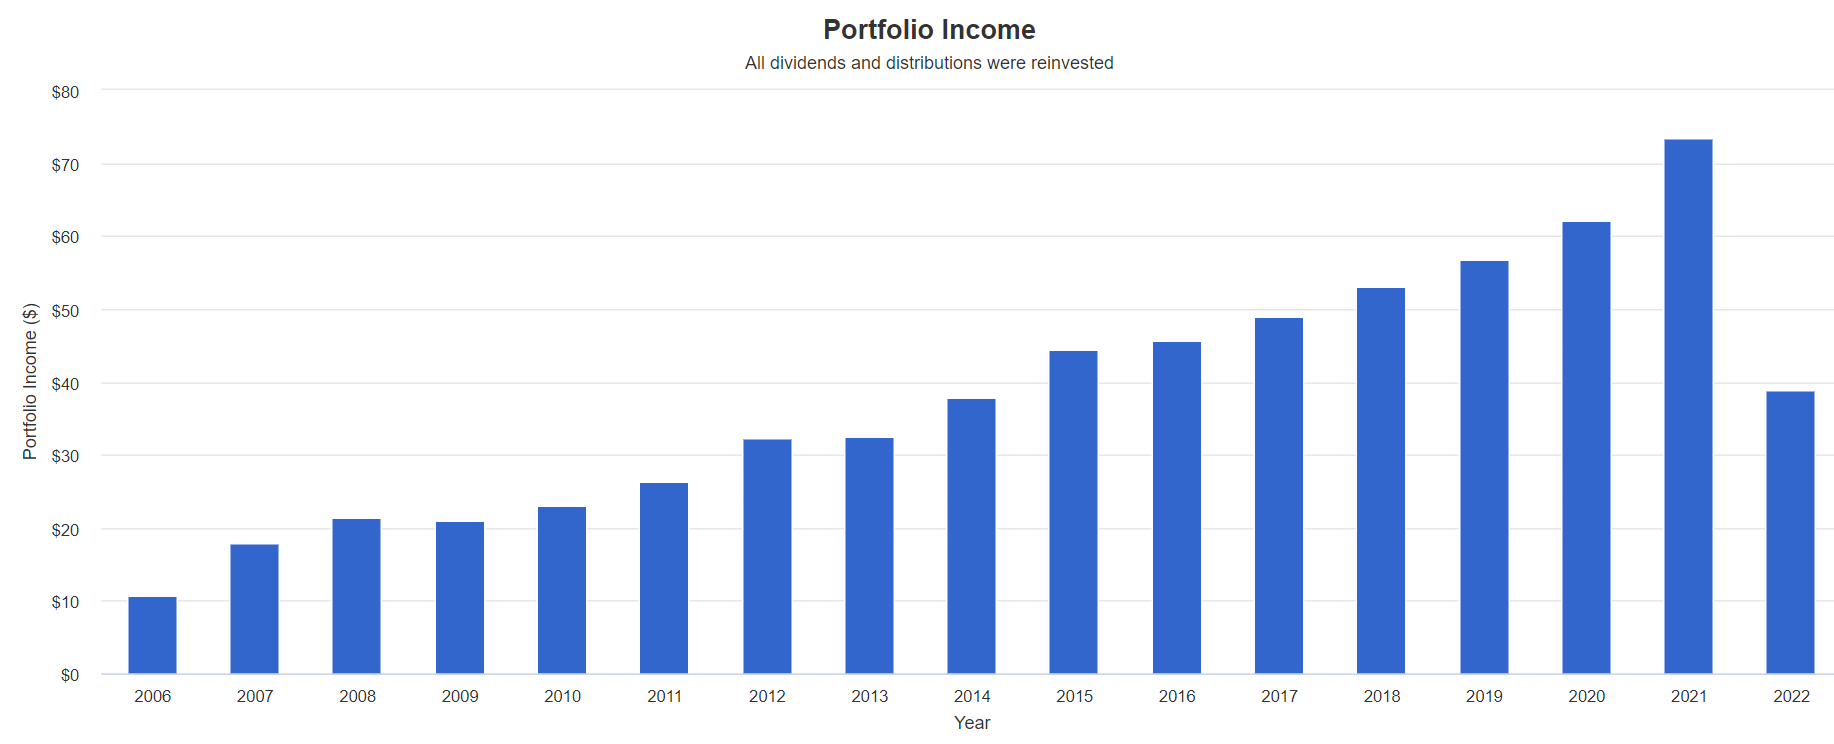
VIG doesn’t grow its dividends quickly, but this is an Ultra SWAN (sleep well at night)-packed portfolio that has never cut its annual dividends, not even in the Great Recession.
- Several bank aristocrats cut in the GFC
- NOBL, had it existed, would have experienced a sharp income decline
VYM Annual Income Growth Since 2006: Generally Dependable But Fell A Bit In The Great Recession
(Source: Portfolio Visualizer Premium)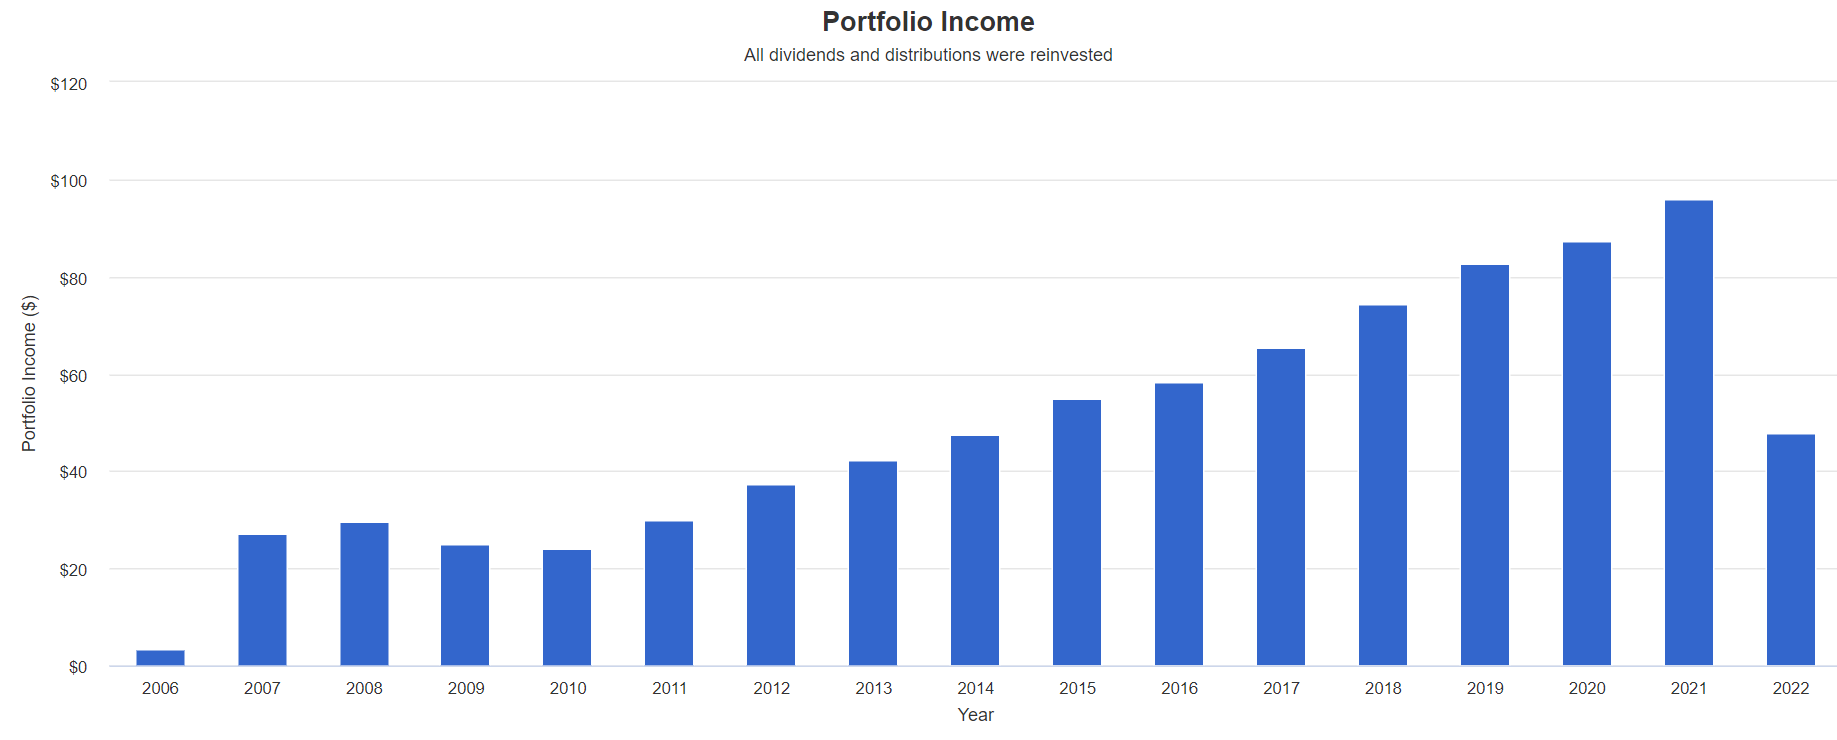
Vanguard’s high-yield ETF (VYM) is another gold standard dividend blue-chip ETF choice I can recommend.
As is the iShares Core Dividend Growth ETF (DGRO).
DGRO Annual Income Growth Since 2014: Very Dependable And Steady Income Growth
(Source: Portfolio Visualizer Premium)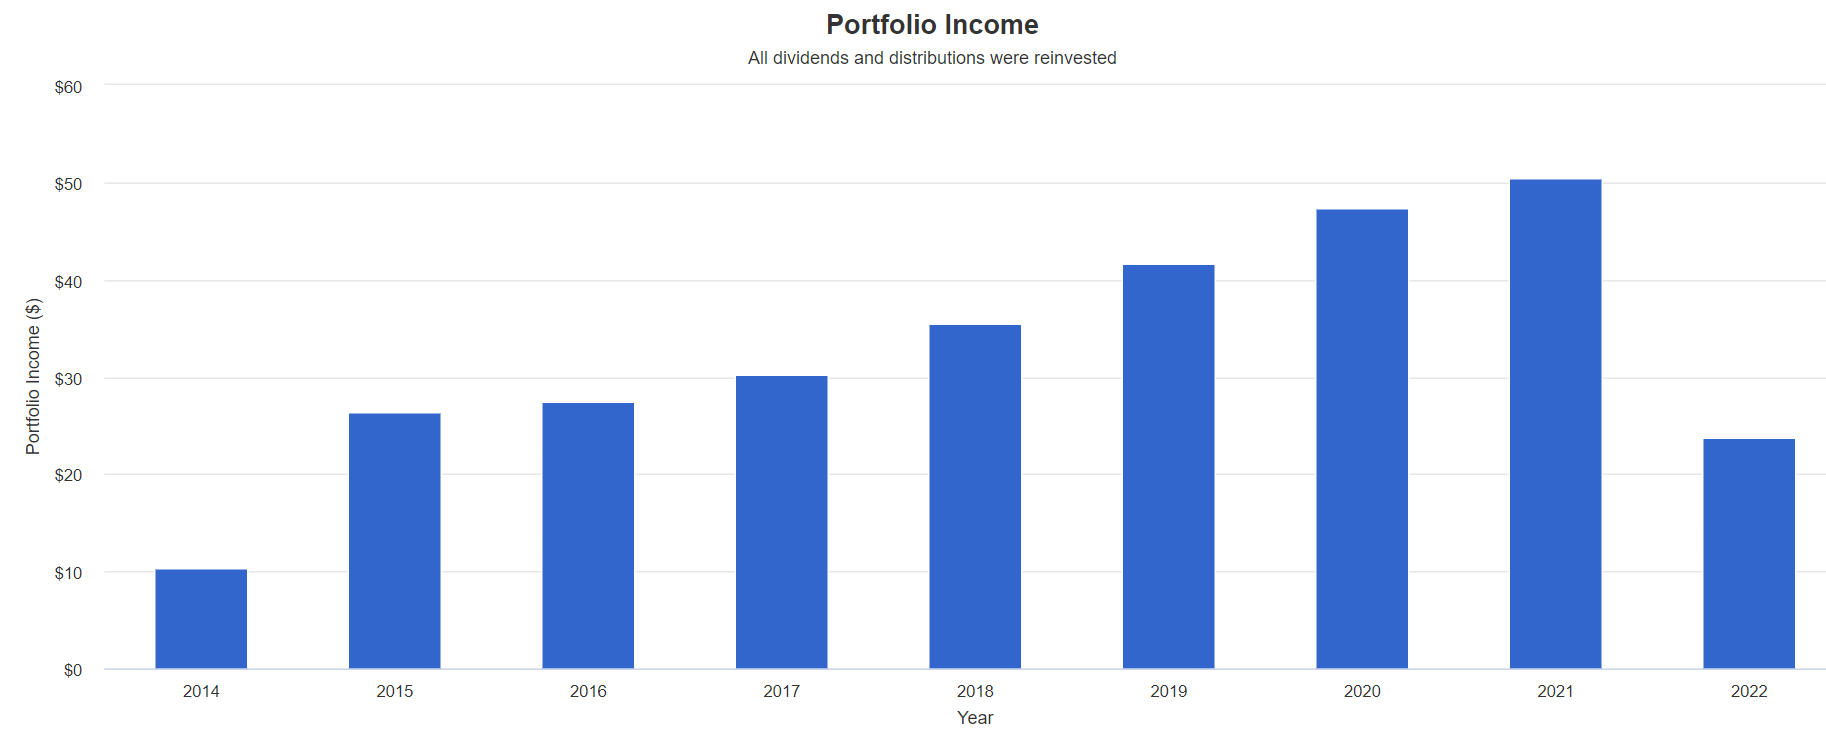
QQQ Annual Income Growth Since 2005: Dependable, Fast Income Growth
(Source: Portfolio Visualizer Premium)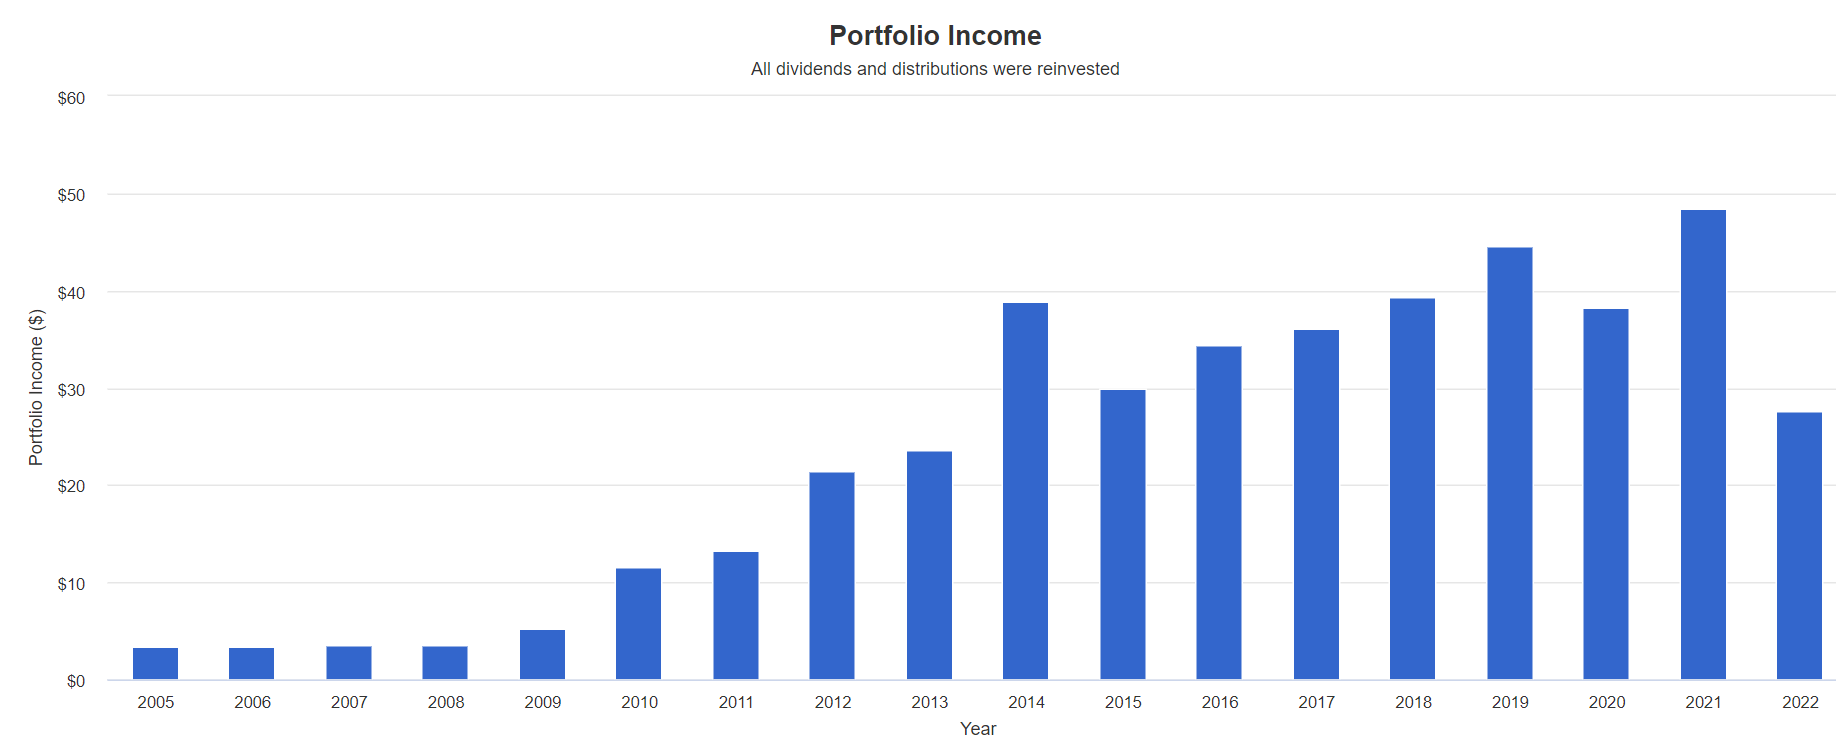
Now, look at the international aristocrat ETF.
EFAD Annual Income Growth Since 2014: 4 Consecutive Years Of Annual Income Declines From International Aristocrats
(Source: Portfolio Visualizer Premium)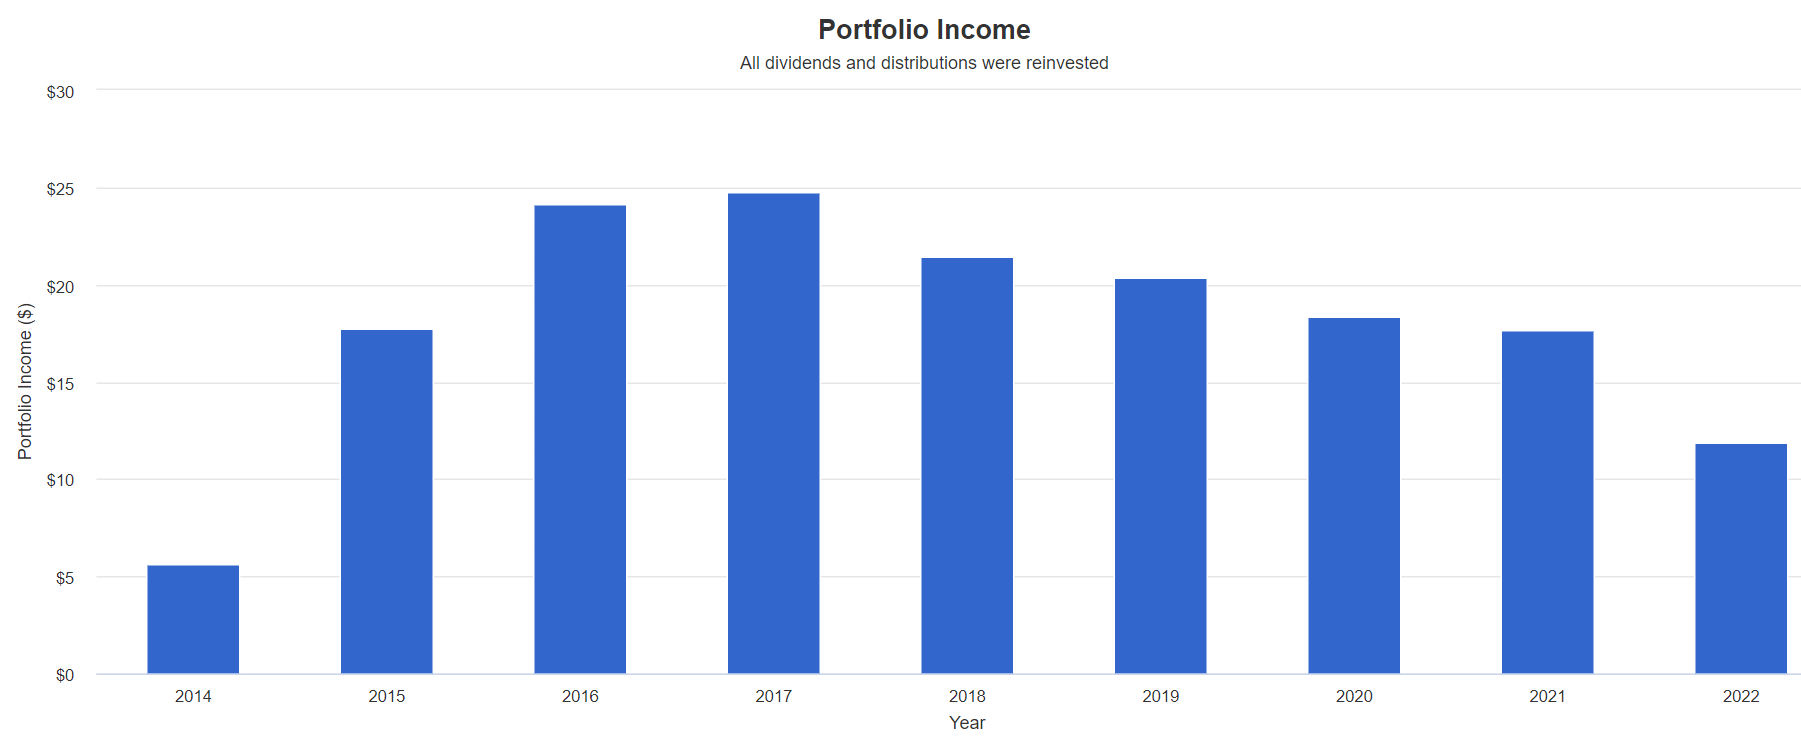
EFAD is an example of how a great idea can be sunk by fatally flawed execution.
EUDV Annual Income Growth Since 2015: European Aristocrats Have Failed To Deliver Steady Income Growth
(Source: Portfolio Visualizer Premium)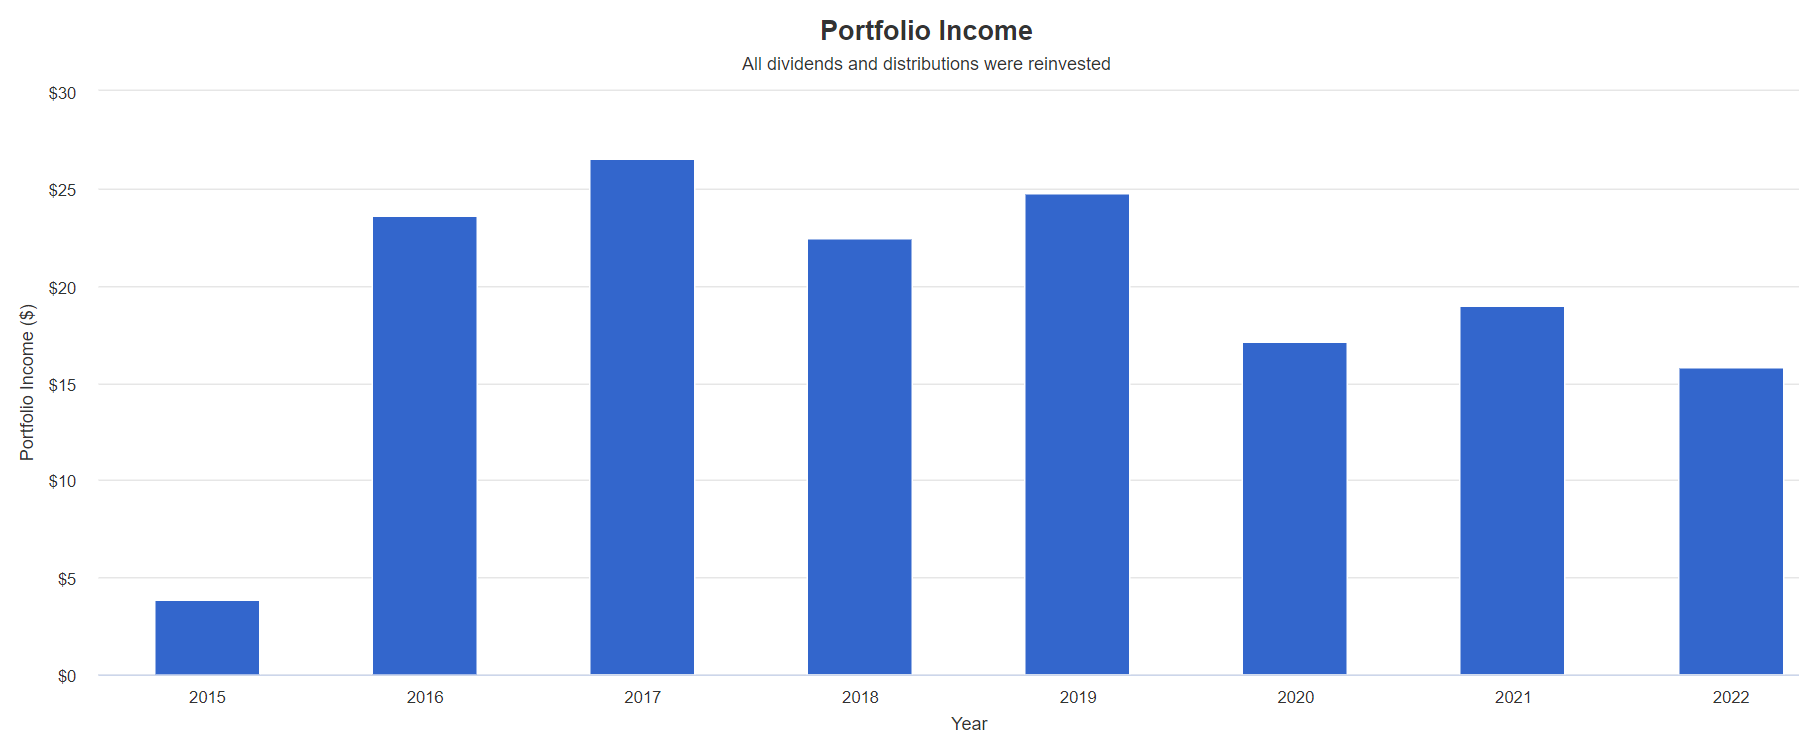
EMDV Annual Income Growth Since 2016: Catastrophic Income Declines From Emerging Market Aristocrats
(Source: Portfolio Visualizer Premium)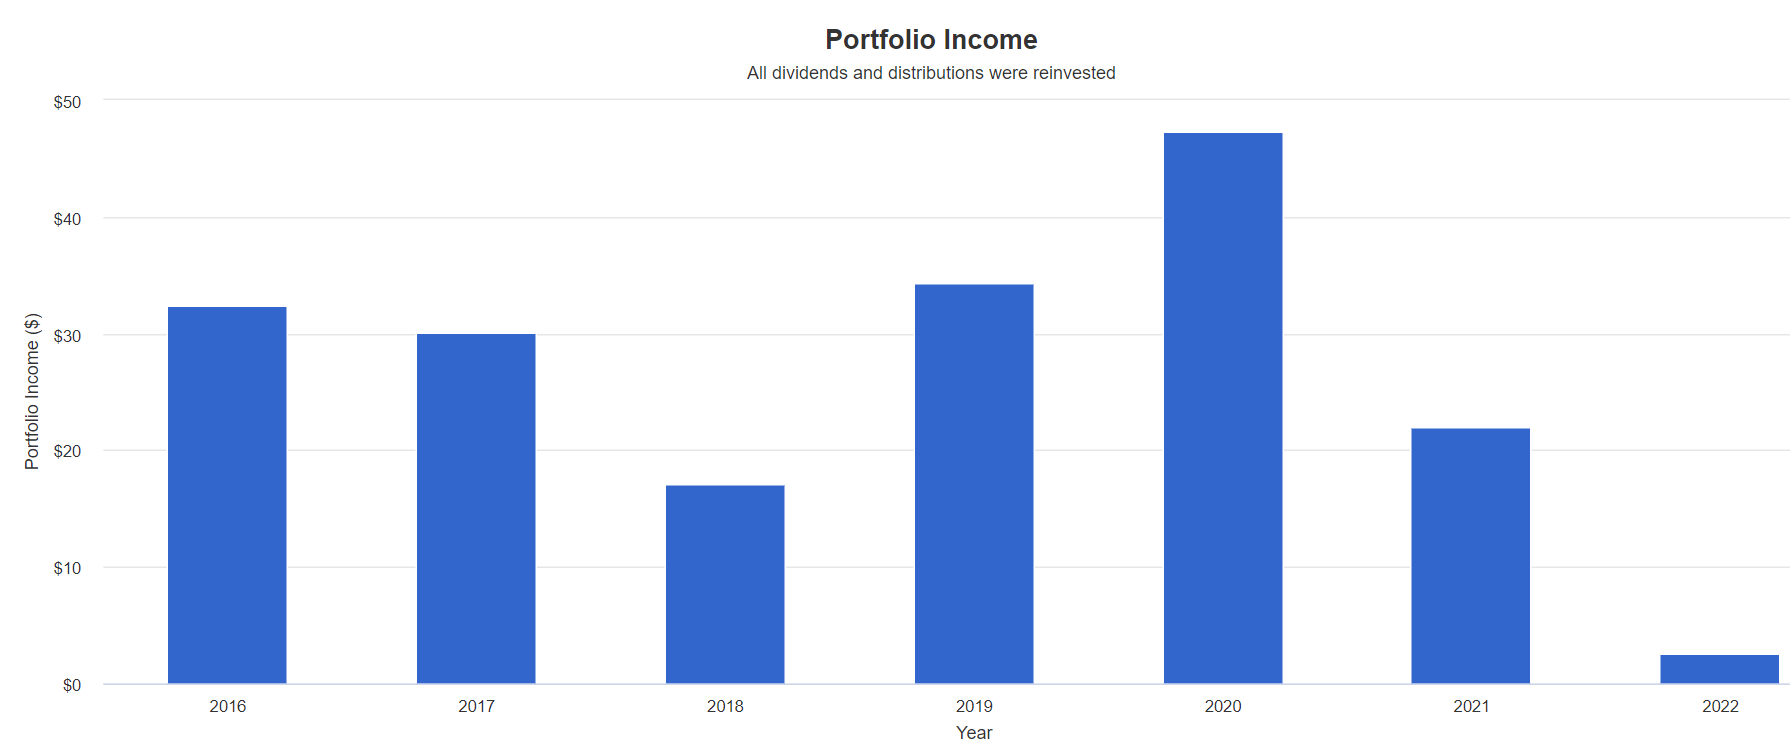
Do these international aristocrat ETFs seem like reliable sources of income growth? They aren’t, and here’s why.
What’s The Matter With International Aristocrat ETFs?
After studying the issue and many international and global ETFs, I’ve concluded the following.
MSCI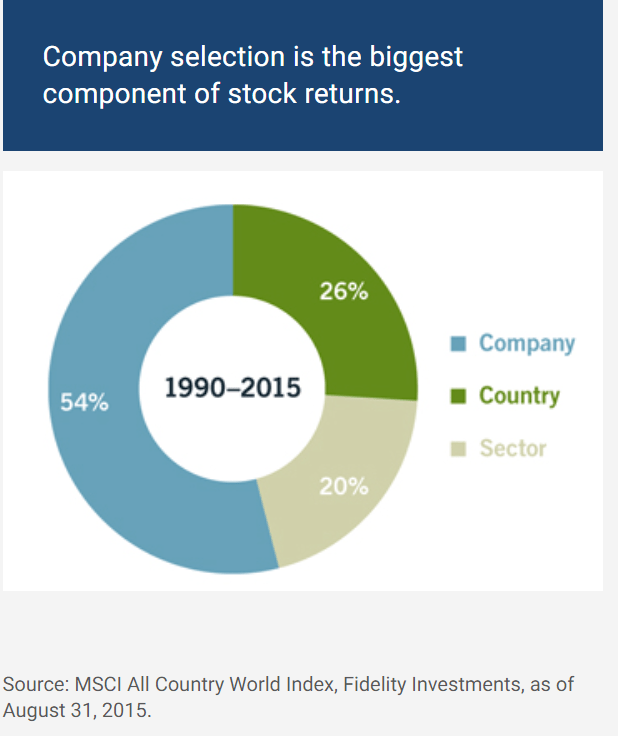
Companies, not countries, are what matter.
World-beaters, not de-worsification, is what you should strive for.
Don’t feel the need to “check a box” and own European or international funds or ETFs just because they are cheap relative to the US.
Don’t think Japanese stocks trading at 9X earnings will outperform US ones trading at a modest historical premium.
Ben Carlson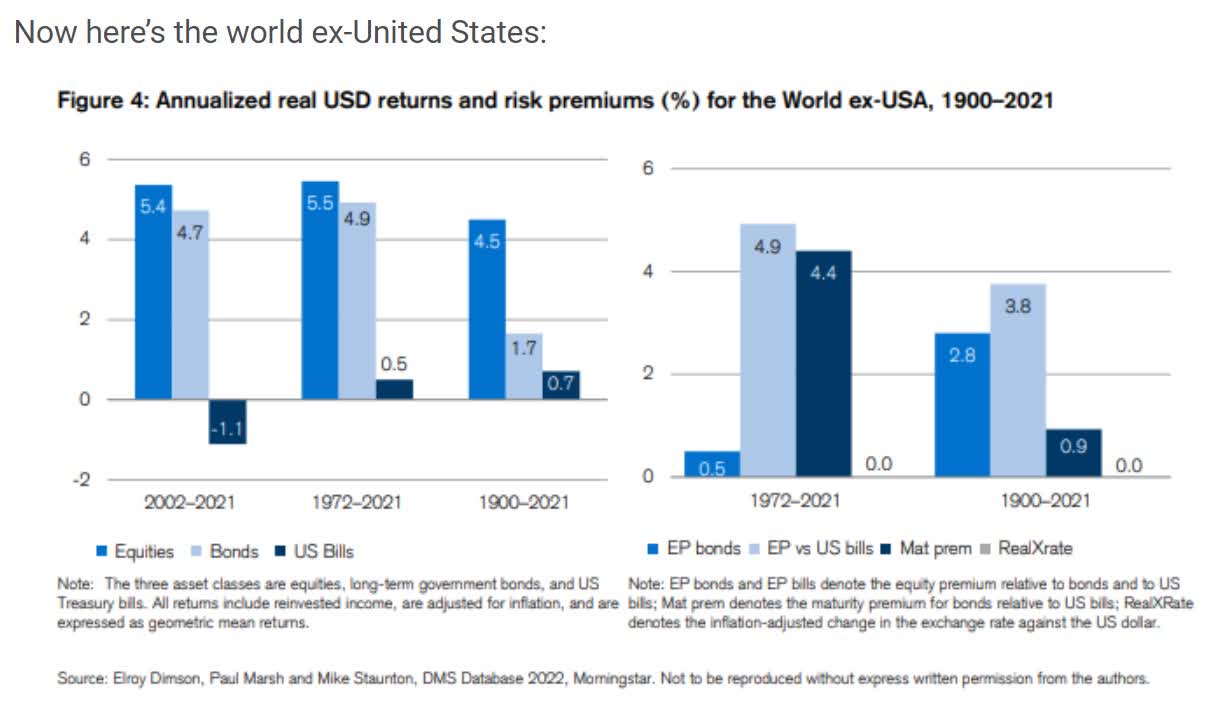
International stocks have delivered 4.5% inflation-adjusted returns since 1900 and 5.4% since 2002.
Ben Carlson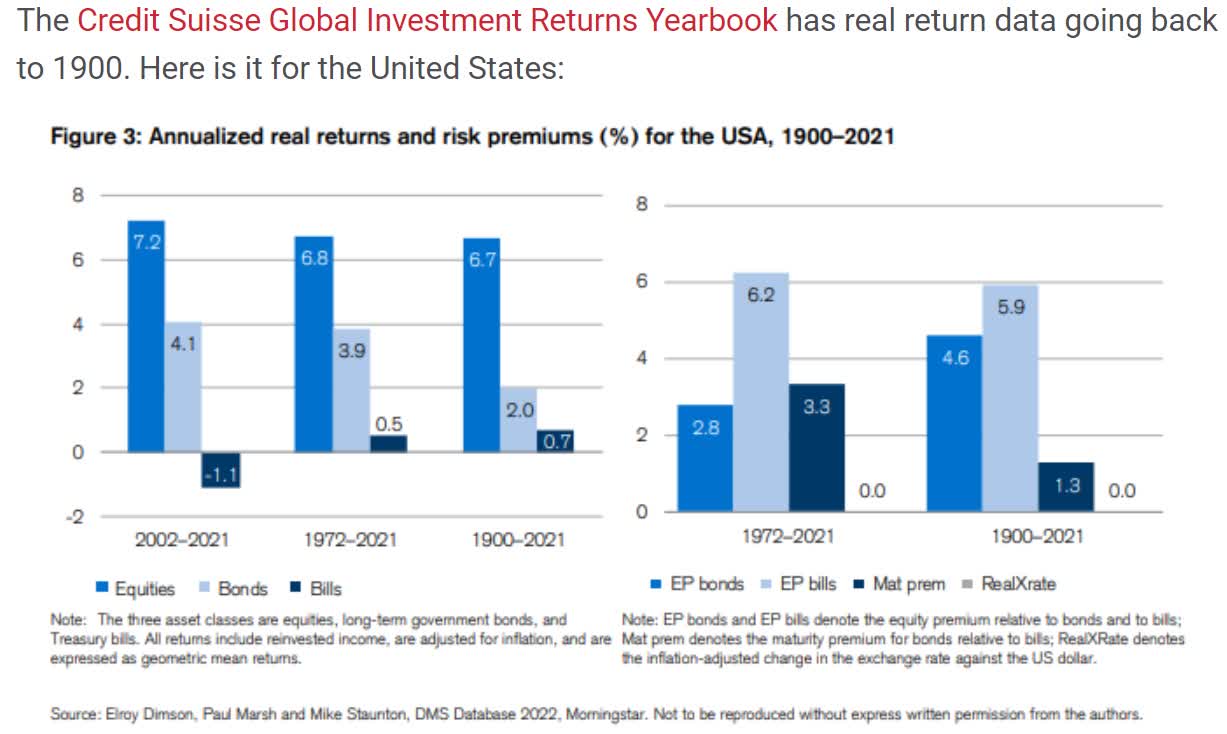
US stocks have very consistently delivered 6.7% to 7.2% inflation-adjusted returns.
- 122 years of outperformance = 97% statistical probability that something structural about US companies leads to outperformance
US stocks have also outperformed since:
You deserve the best companies protecting and growing your income and wealth.
(Source: Wisdom Tree)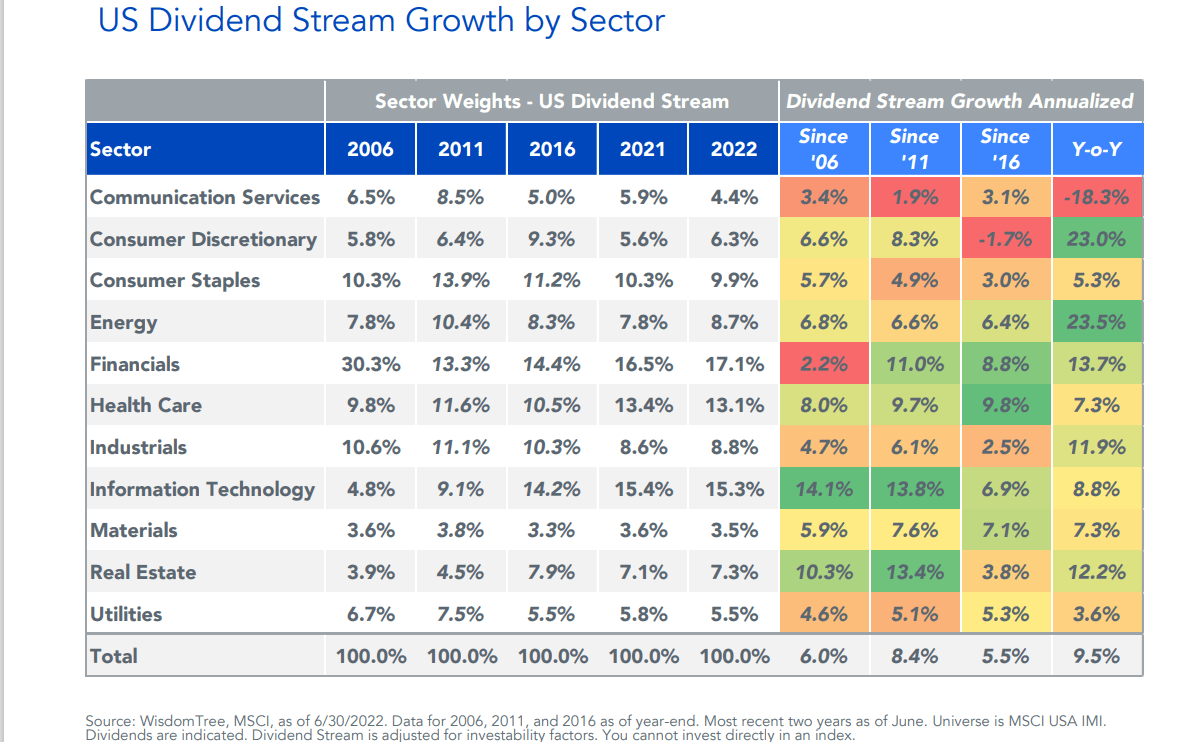
US dividends are not just safer; they grow faster too.
(Source: Wisdom Tree)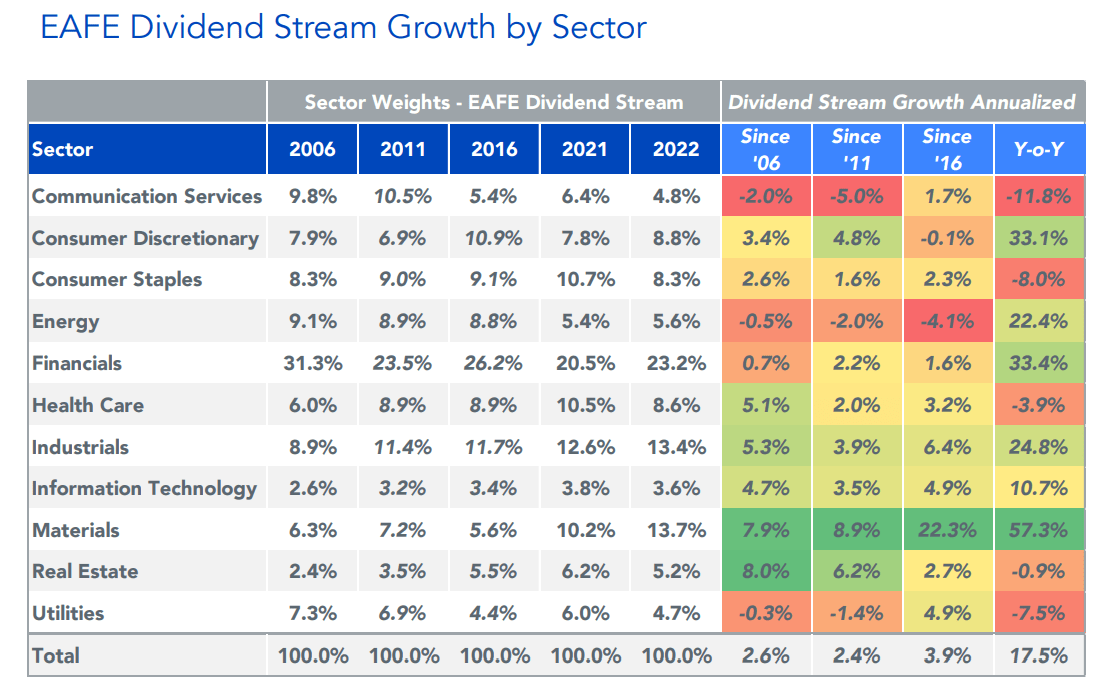
- US dividends are more stable
- growth faster and more consistently
- and the companies paying them outperform over the long-term
Why are the gold standard US dividend growth ETFs worth owning?
SCHD: Chock Full Of World-Beater Ultra SWANs
Morningstar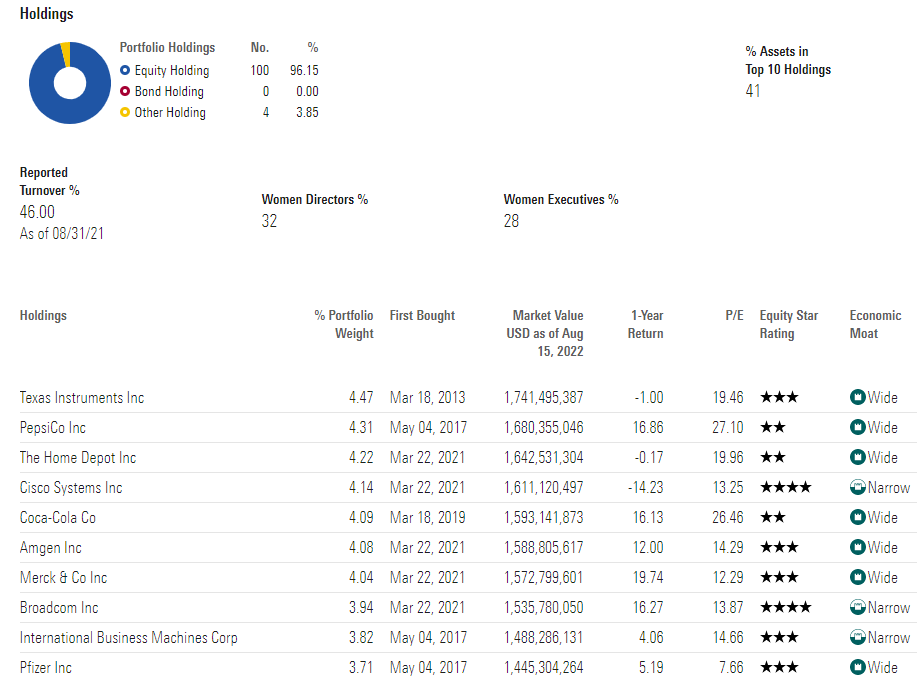
These are the kinds of companies high-yield income investors need.
Now take a look at what the international aristocrat ETF owns.
International Aristocrats: Very Few World Beater Ultra SWANs
Morningstar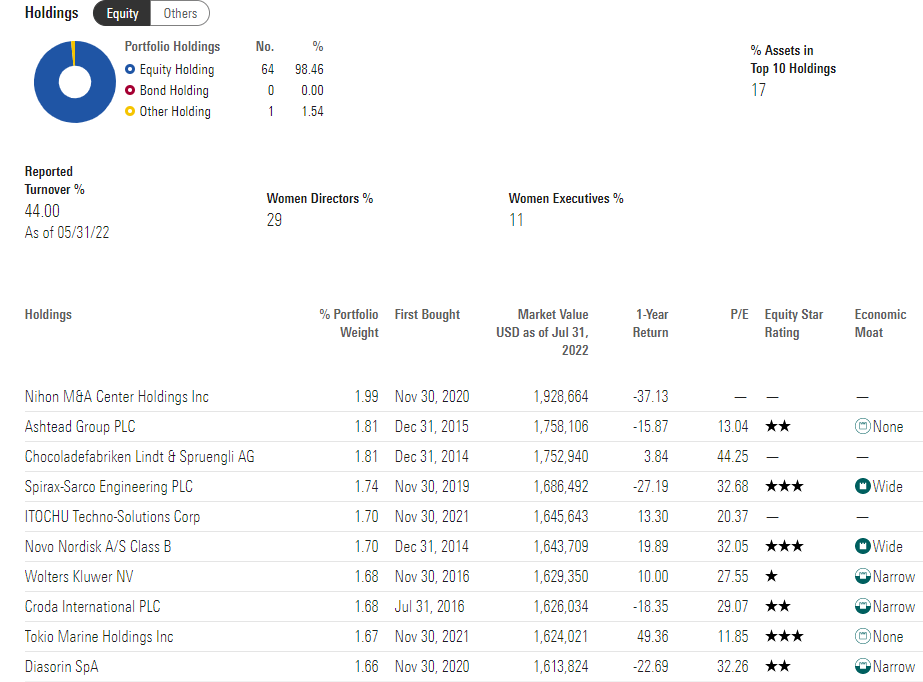
Besides Novo Nordisk, a world-beater Ultra SWAN aristocrat, have you heard of any of these companies? After seeing the terrible returns and dismal income growth dependability of EFAD, do you want to own any of them?
VIG: World-Beater Ultra SWANs And Aristocrats
Morningstar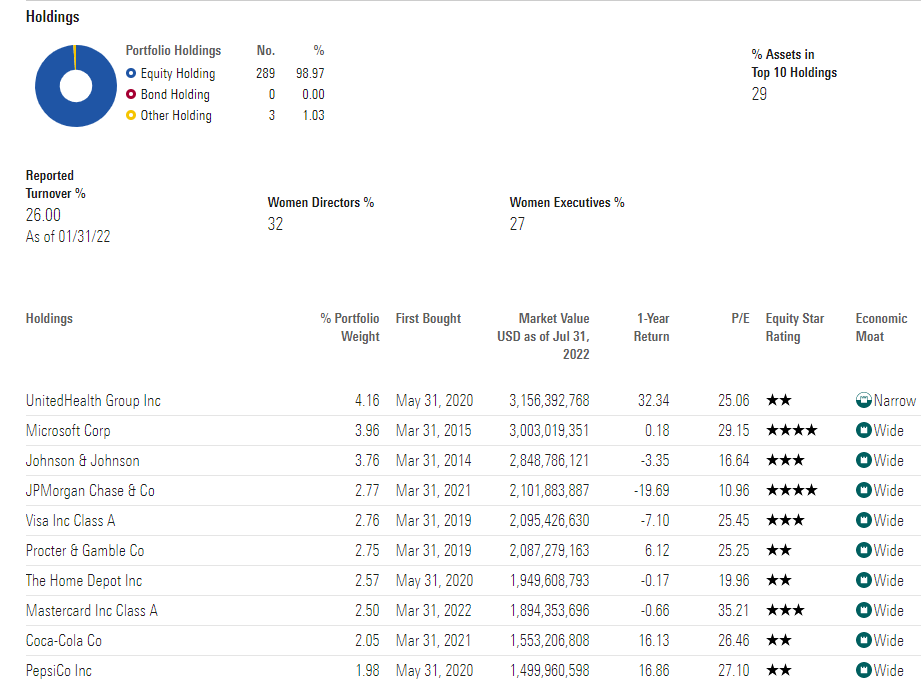
These are the kind of world-beater dividend growth blue-chips you need if you want to avoid a dividend cut even in the Great Recession.
European Aristocrat ETF: Not The Kind Of Companies You Want To Own
Morningstar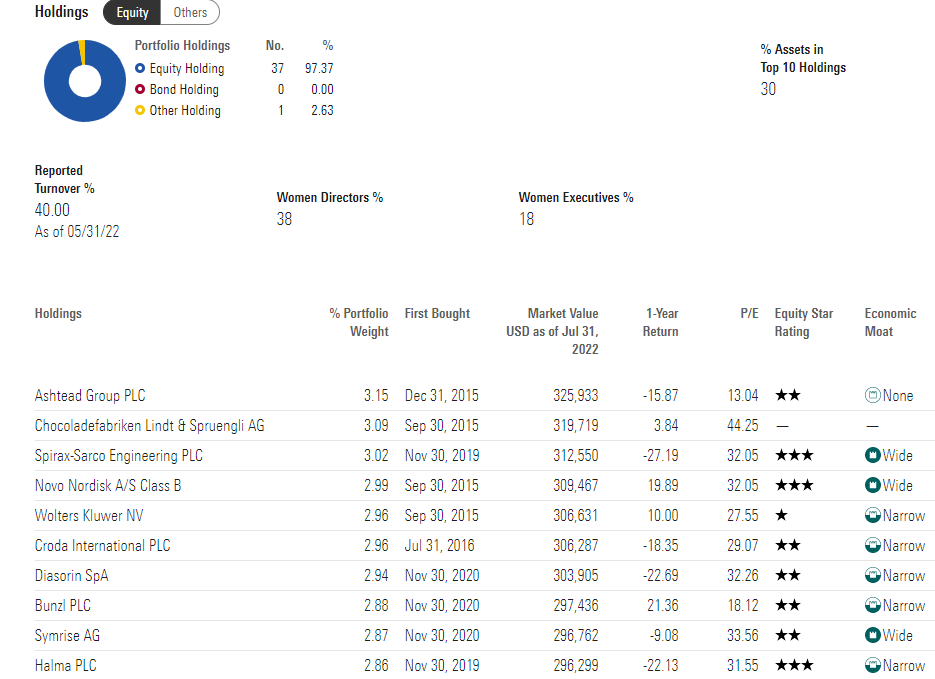
There are plenty of great European dividend growth blue-chips and aristocrats worth owning, but very few are actually in this ETF.
VYM: Hundreds Of High-Yield Blue-Chips Worth Owning
Morningstar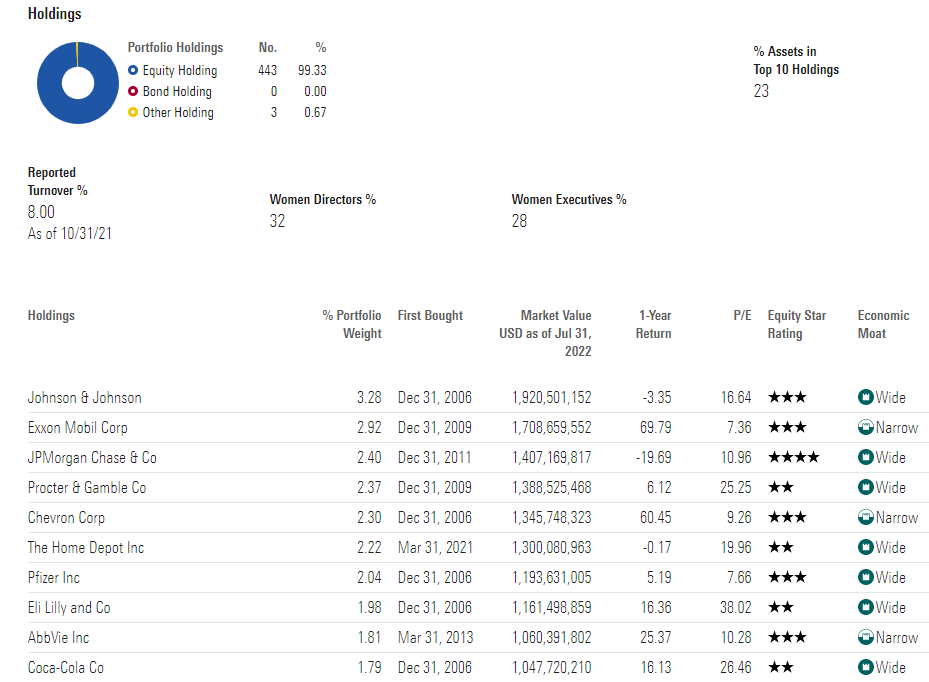
Emerging Market Aristocrat ETF: Not Companies Income Investors Can Trust
Morningstar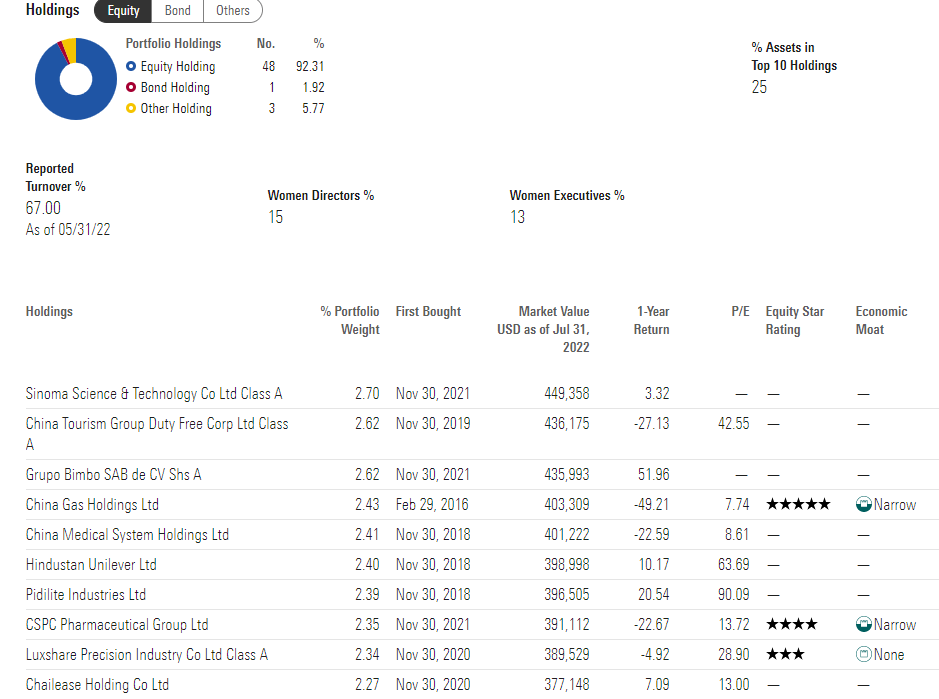
Want to know why emerging market aristocrats are delivering 80% less income this year? Look at the top 10 holdings and where these companies are located.
Dividends At The Mercy Of The Chinese Communist Party
Morningstar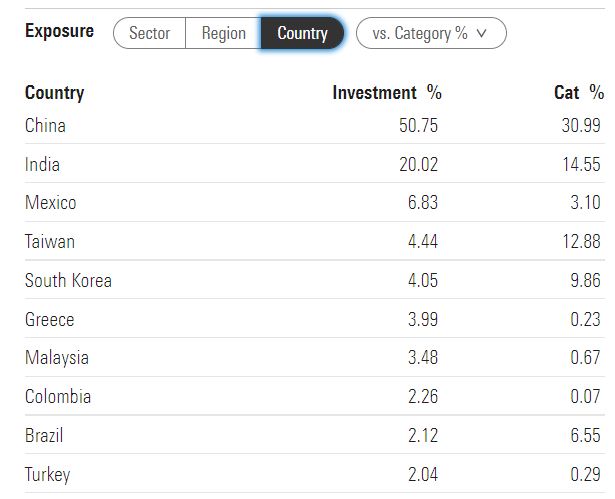
Safe dividends come from stable companies with good governance, stable cash flows, and proven dividend-friendly corporate cultures backed by a strong rule of law.
That’s exactly what you won’t’ find in emerging markets like China and India.
So does this mean that it’s not worth owning any international dividend blue-chips?
- Schwab recommends US investors own 20% to 30% international companies
Absolutely not; it just means you have to focus on world-beater blue-chips and not low-quality companies many of these international aristocrat ETFs own.
How To Find World Beater International Aristocrats Actually Worth Owning… In 3 Minutes
Here’s how I used the Dividend Kings Zen Research Terminal to find world beater international aristocrats that can help you retire rich and stay rich in retirement.
This is our flagship tool that runs off the Dividend Kings Master list.
The DK 500 Master List is one of the world’s best watchlists, including:
- every dividend aristocrat (S&P companies with 25+ year dividend growth streaks)
- every dividend champion (every company, including foreign, with 25+ year dividend growth streaks)
- every dividend king (every company with 50+ year dividend growth streaks)
- every foreign aristocrat (every company with 20+ year dividend growth streaks)
- every Ultra SWAN (wide moat aristocrats, as close to perfect quality companies as exist)
- 40 of the world’s best growth stocks
Let me show you the simple and easy screen to find international aristocrats that you can rely on for generous, very safe, and steadily growing income.
- Foreign dividend stock list: 65 companies remain
- reasonable or good buy or better (never overpay for stocks): 44 companies remain
- 3% yield or higher (about 2X the yield of the S&P 500): 31 companies remain
- 10+% long-term consensus return potential (matching the S&P 500): 25 companies remain
- add dividend growth streak column and sort by dividend growth streak
- select the companies with 20+ year dividend growth streaks (Ben Graham’s standard of excellence, 2X the S&P’s definition of global aristocrat): 6 companies remain
- use the Watchlist construction tool to select just these 6 world-beater international aristocrats
-
Total Time: 3 minutes
Now we can easily select 60 fundamental metrics and analyze these international aristocrats to see which ones are right for your needs.
6 World-Beater High-Yield International Aristocrats You’ll Want To Own
(Source: Dividend Kings Zen Research Terminal)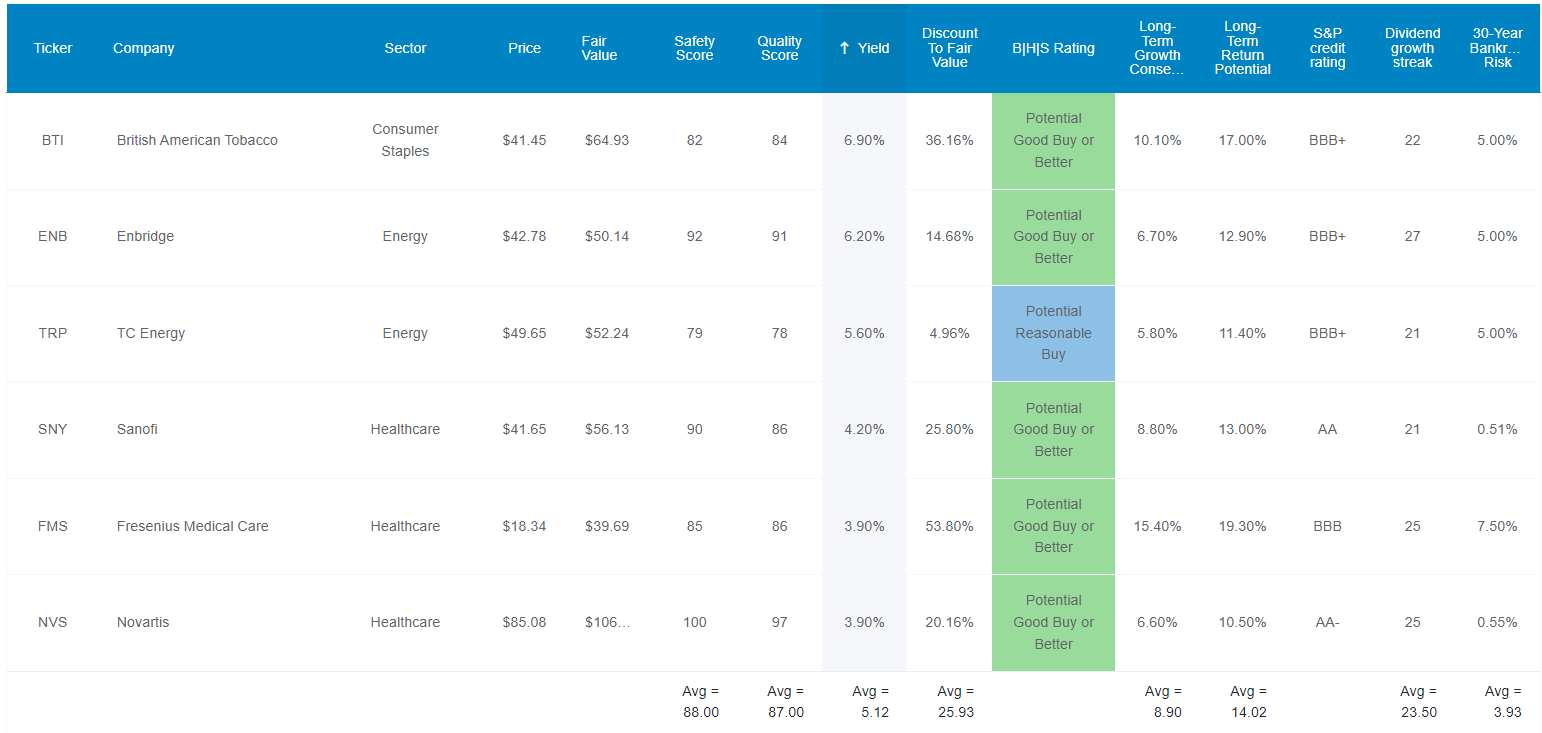
I’ve linked to articles covering each company’s investment thesis, growth prospects, risk profile, valuation and total return potential.
FAST Graphs Up Front
British American 2024 Consensus Total Return Potential
(Source: FAST Graphs, FactSet Research)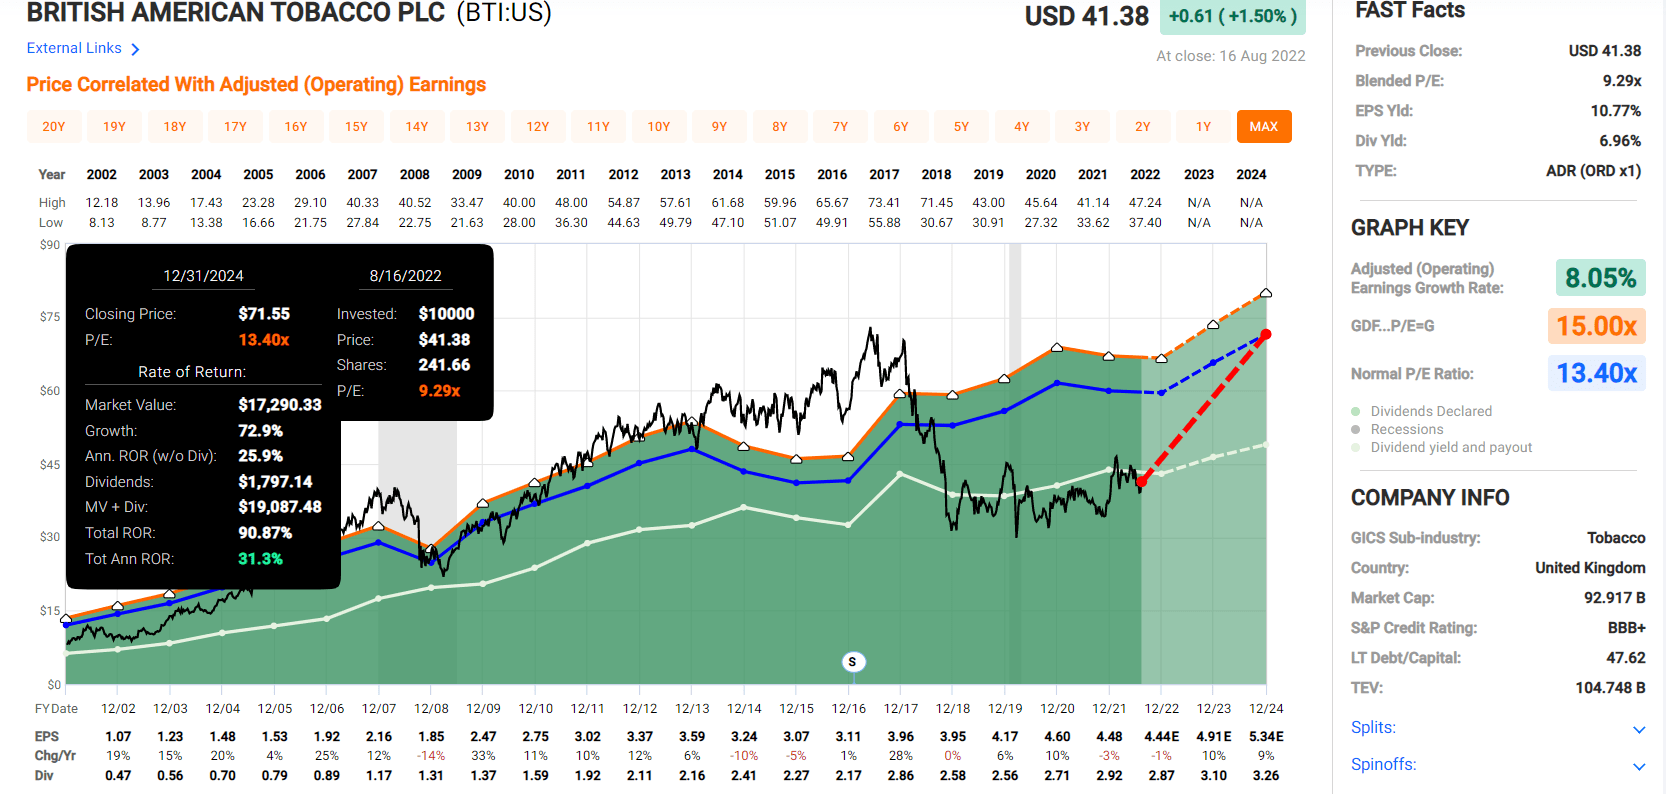
Enbridge 2024 Consensus Total Return Potential
(Source: FAST Graphs, FactSet Research)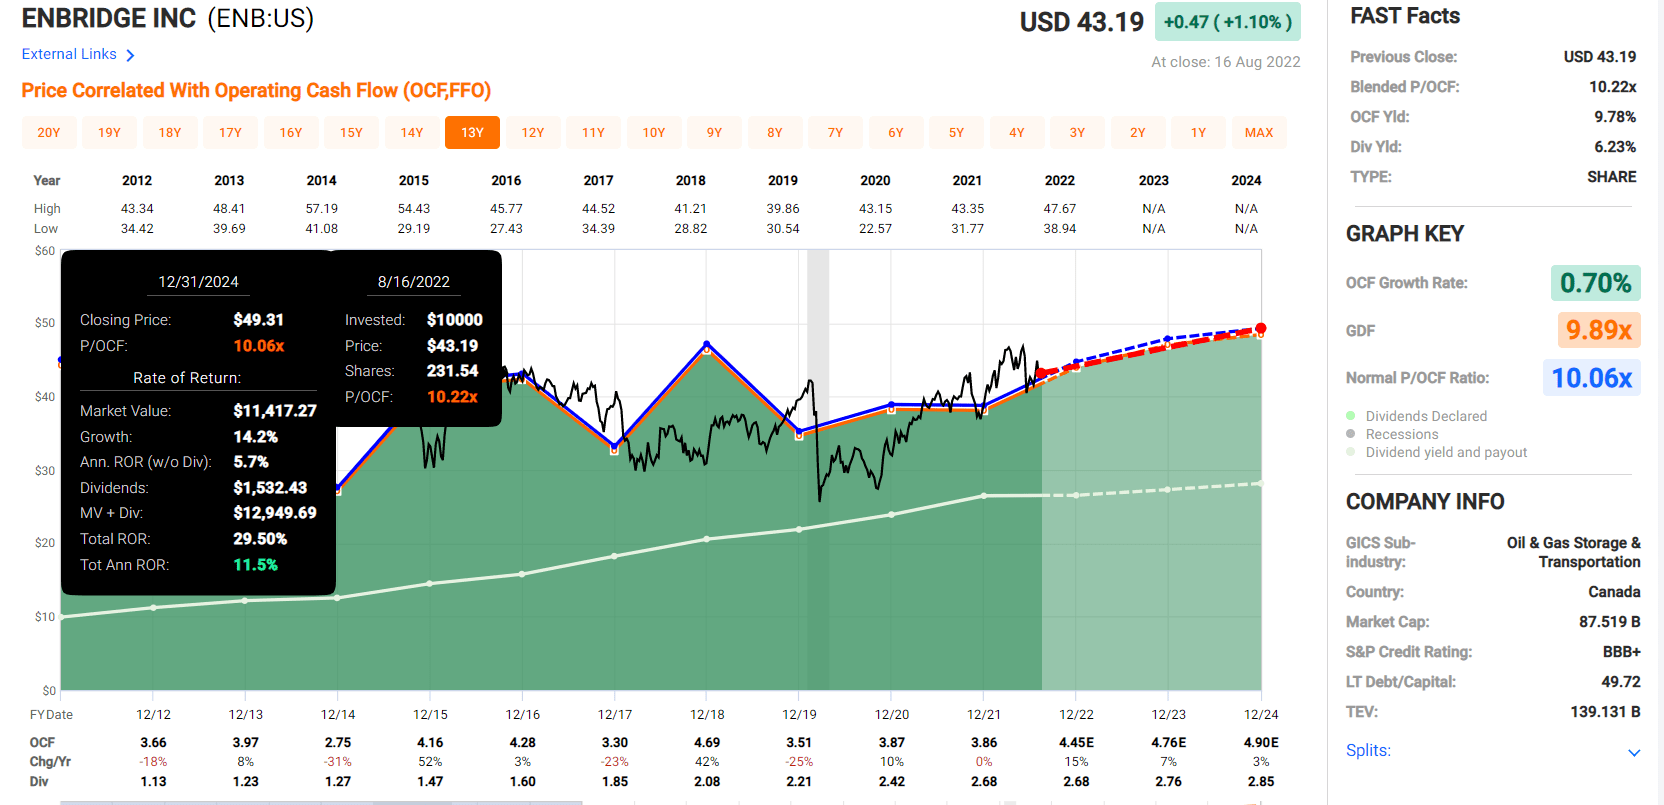
TC Energy 2024 Consensus Total Return Potential
(Source: FAST Graphs, FactSet Research)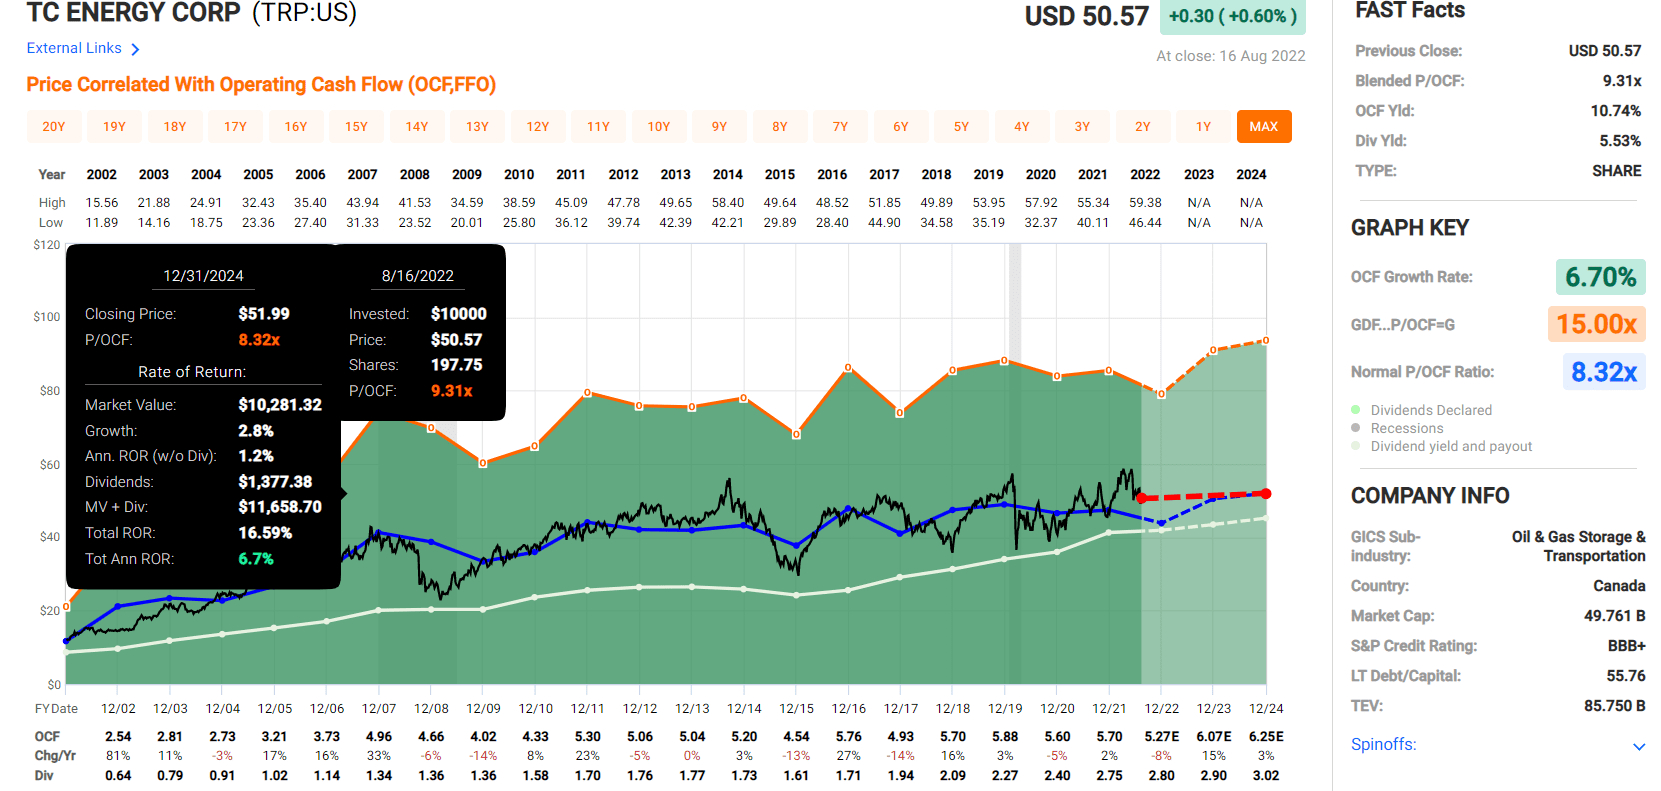
Sanofi 2024 Consensus Total Return Potential
(Source: FAST Graphs, FactSet Research)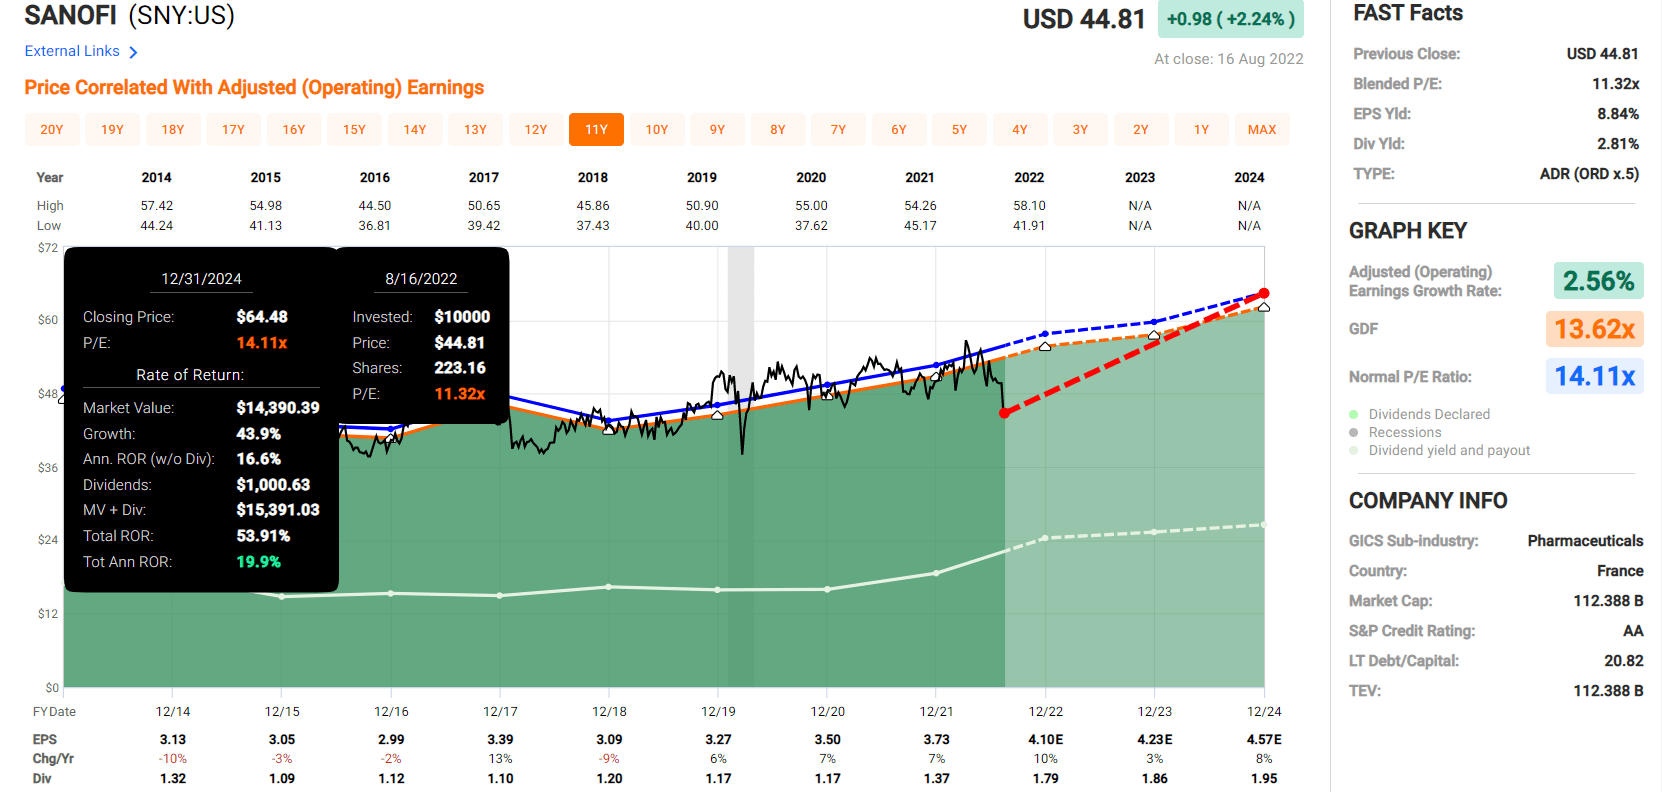
Fresenius Medical Care 2024 Consensus Total Return Potential
(Source: FAST Graphs, FactSet Research)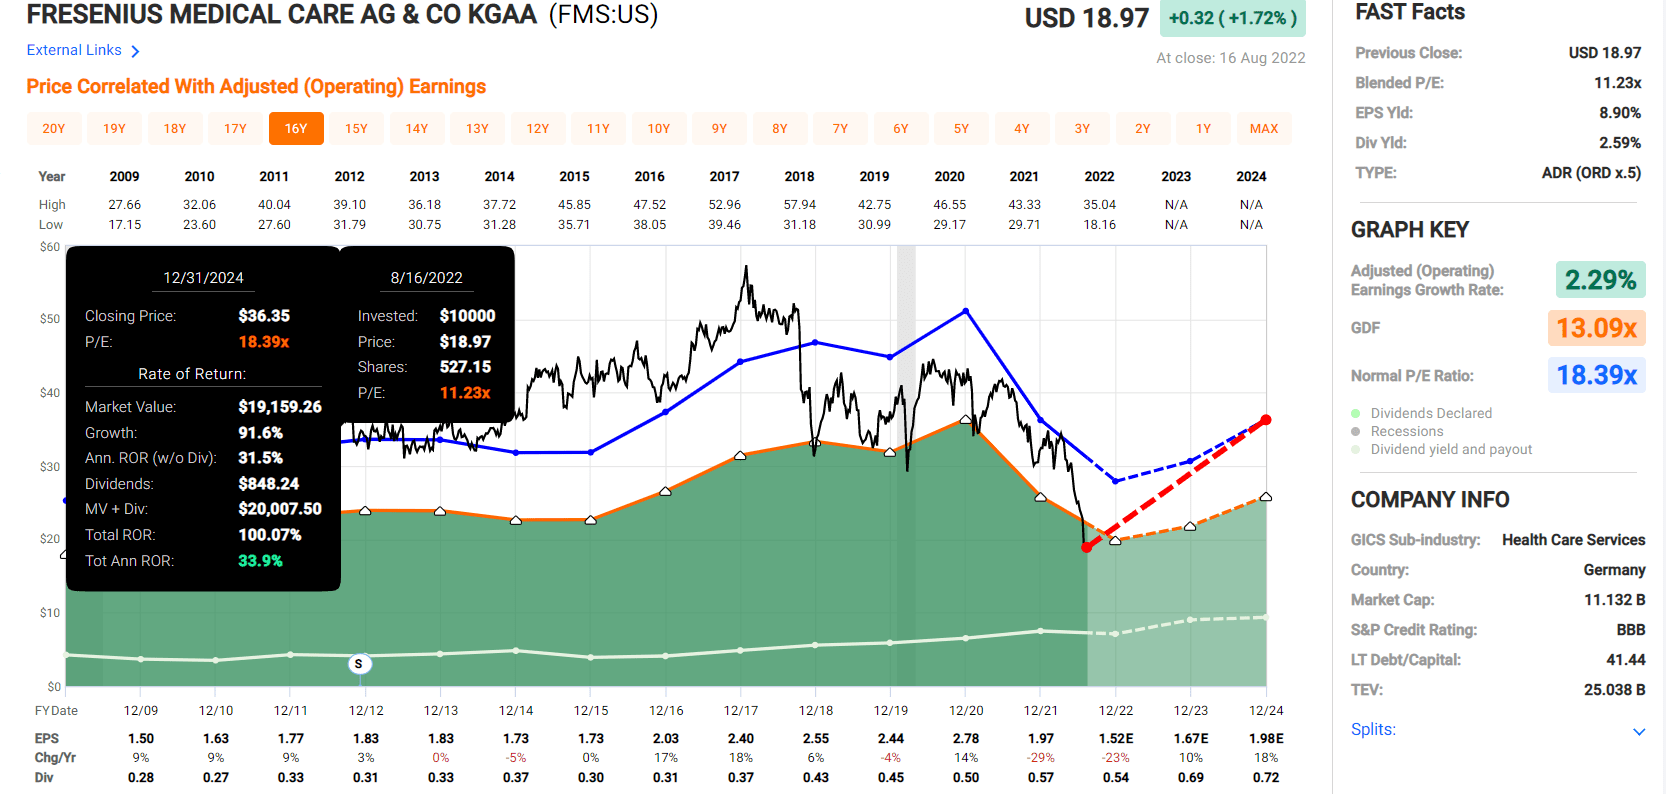
Novartis 2024 Consensus Total Return Potential
(Source: FAST Graphs, FactSet Research)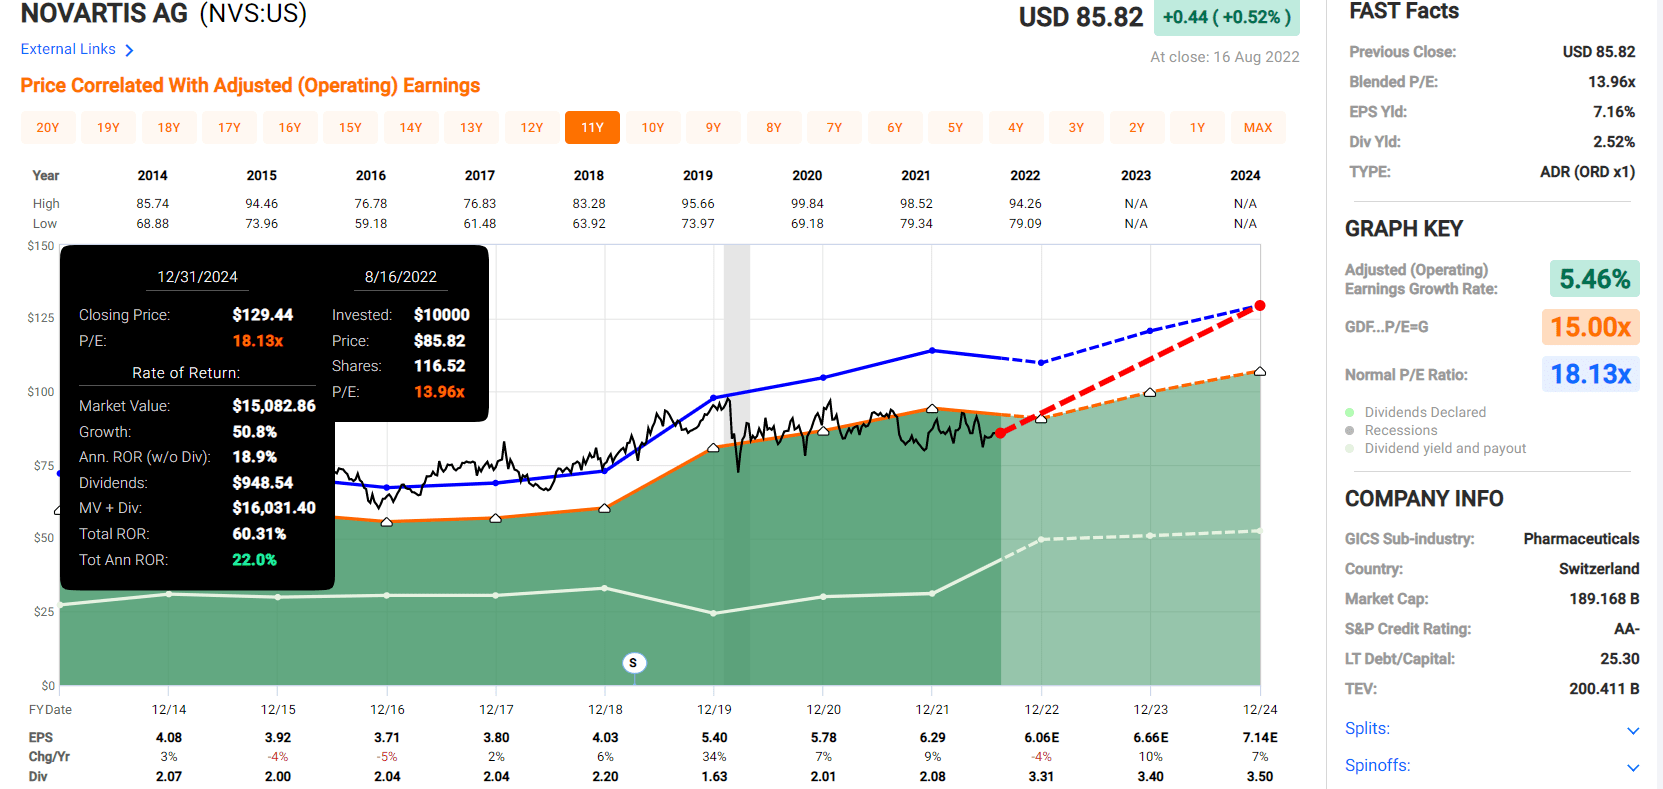
Now compare that to the S&P 500.
S&P 500 2024 Consensus Total Return Potential
(Source: FAST Graphs, FactSet Research)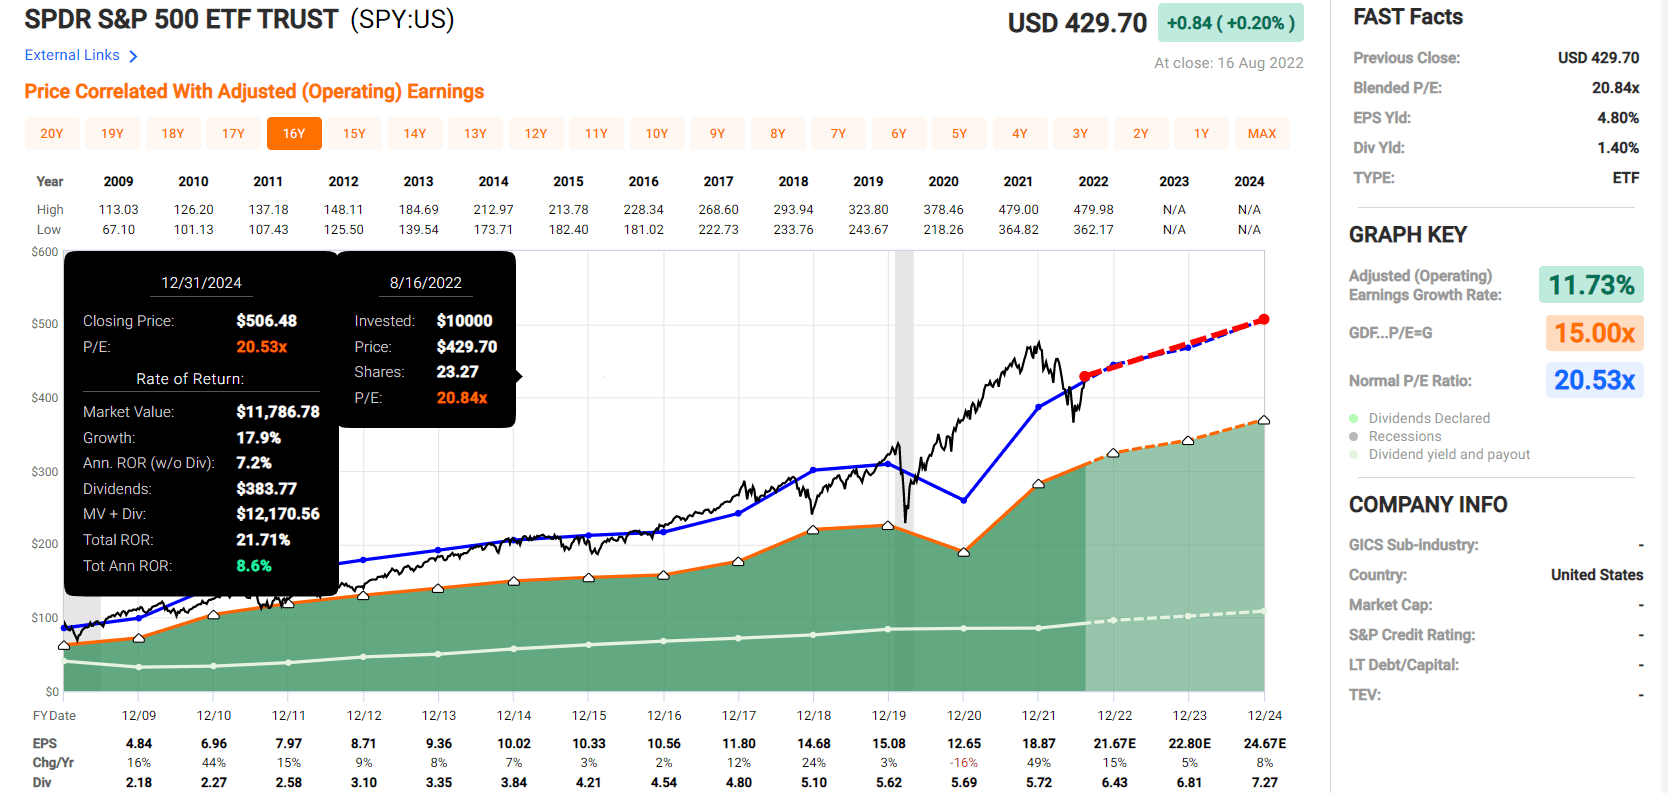
Analysts expect 22% total returns from the market over the next 2.5 years or 8.6% CAGR.
- 2022 growth estimates are falling by the week
- this figure is likely overly bullish
From these high-yield international aristocrats?
- 21% average 2024 consensus return potential
- literally, Buffett-like return potential from international high-yield aristocrat bargains hiding in plain sight
Why I Trust These World-Beater Aristocrats, And So Can You
(Source: Dividend Kings Zen Research Terminal)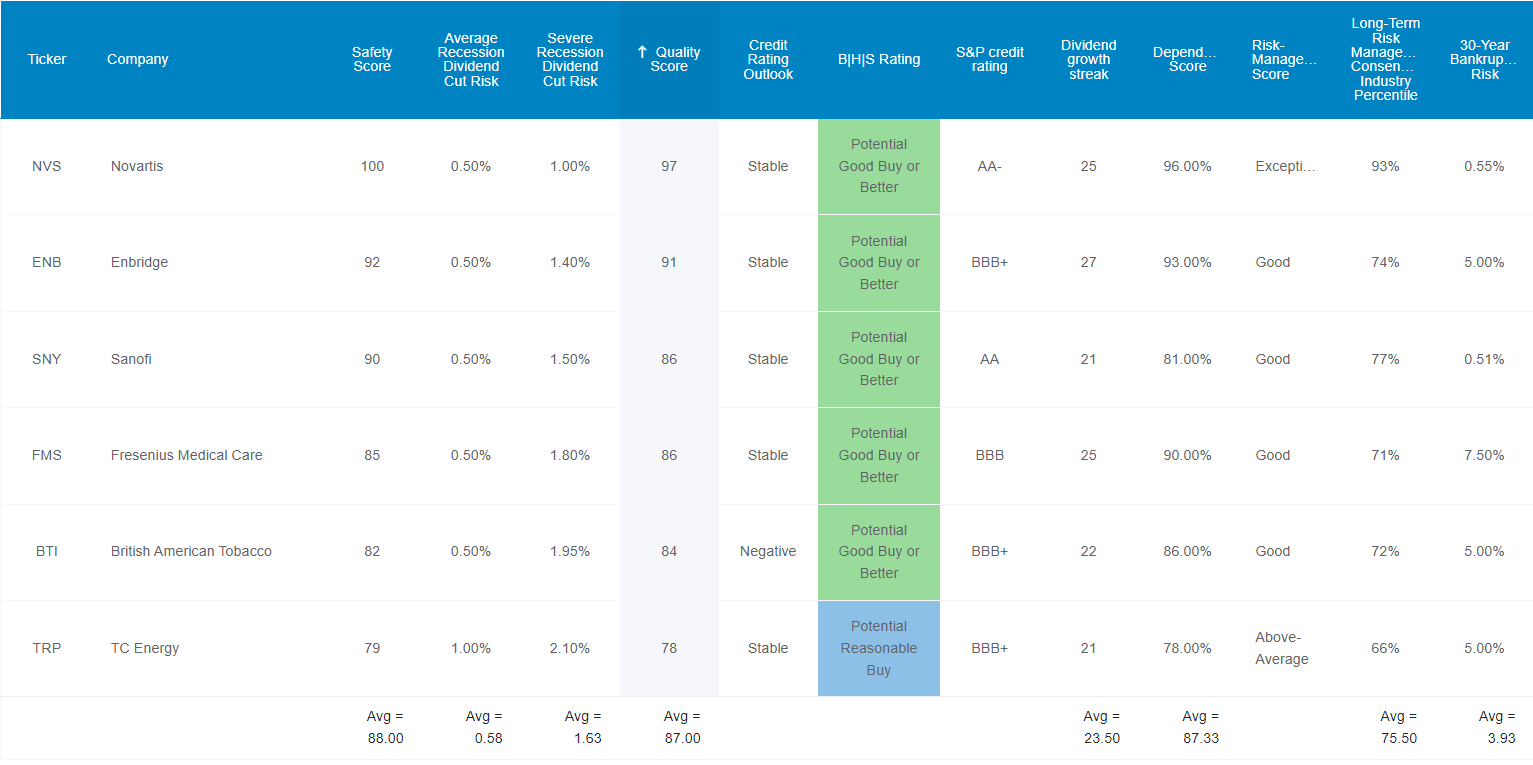
These aren’t just 5% yielding international aristocrats. They are Ultra SWAN world-beater aristocrats. How do I know? By comparing them to the US dividend aristocrats, the bluest of blue-chips.
Higher Quality And Better Investment Opportunities Than The Dividend Aristocrats
| Metric | Dividend Aristocrats | 6 World-Beater High-Yield International Aristocrats | Winner Dividend Aristocrats |
Winner 6 World-Beater High-Yield International Aristocrats |
| Quality | 87% | 87% | 1 | 1 |
| Safety | 90% | 88% | 1 | |
| Average Recession Dividend Cut Risk | 0.5% | 0.5% | 1 | 1 |
| Severe Recession Dividend Cut Risk | 1.5% | 1.6% | 1 | |
| Dependability | 84% | 87% | 1 | |
| Dividend Growth Streak (Years) | 44.8 | 23.5 | 1 | |
| Long-Term Risk Management Industry Percentile | 67% Above-Average, Low-Risk |
76% Good, Low-Risk |
1 | |
| Average Credit Rating | A- Stable | BBB+ Stable | 1 | |
| Average Bankruptcy Risk | 3.04% | 3.93% | 1 | |
| Average Return On Capital | 88% | 195% | 1 | |
| Average ROC Industry Percentile | 69% | 82% | 1 | |
| 13-Year Median ROC | 74% | 84% | 1 | |
| Forward PE | 21.0 | 10.1 | 1 | |
| Discount To Fair Value | -4% | 26% | 1 | |
| DK Rating | Hold | Very Strong Buy | 1 | |
| Yield | 2.4% | 5.1% | 1 | |
| LT Growth Consensus | 8.7% | 8.9% | 1 | |
| Total Return Potential | 11.1% | 14.0% | 1 | |
| Risk-Adjusted Expected Return | 7.5% | 9.4% | 1 | |
| Inflation & Risk-Adjusted Expected Return | 5.3% | 7.2% | 1 | |
| Conservative Years To Double | 13.6 | 10.0 | 1 | |
| Total | 7 | 13 |
(Source: Dividend Kings Zen Research Terminal)
These high-yield international aristocrats match the US aristocrats on quality and average recessionary dividend cut risk (0.5%).
They basically tie the aristocrats for dividend safety and severe recessionary cut risk (1.6% Vs. the aristocrats’ 1.5%).
They have a 23.5-year-average dividend growth streak, surpassing the Ben Graham standard of excellence.
- S&P and most ETF providers consider 10+ year streaks to be “aristocrats.”
Pandemic Dividend Cuts By Dividend Streak
Justin Law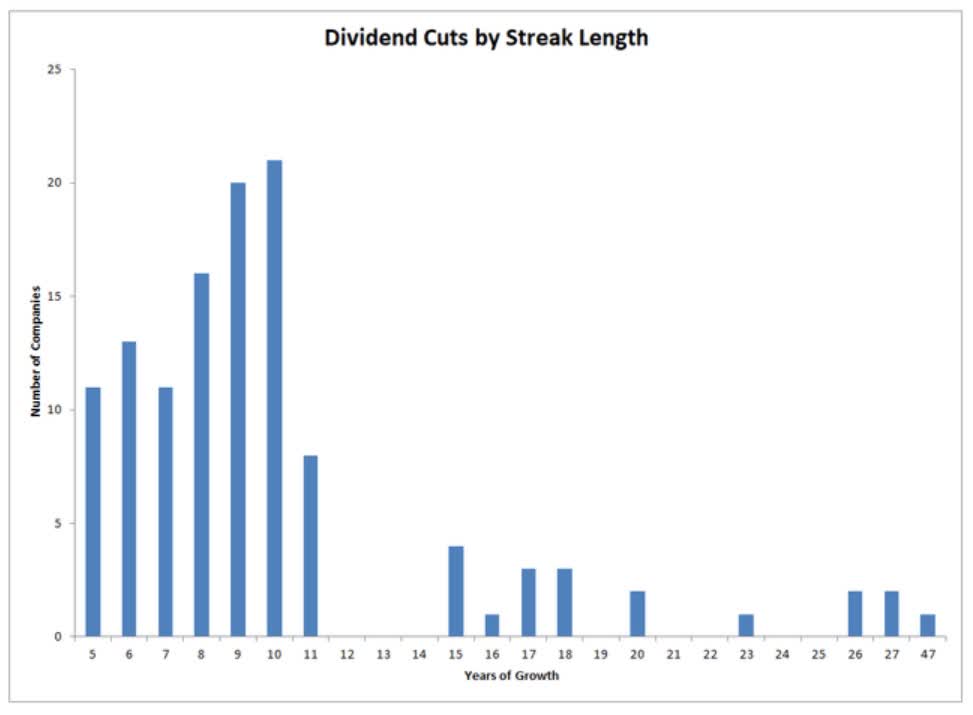
Guess why international aristocrat ETFs aren’t great? Because 10 years isn’t a significant sign of safety or quality, 12+ years is, as proven by the Pandemic.
Joel Greenblatt considers return on capital his gold standard proxy for quality and moatiness.
- ROC = annualized pre-tax profit/the cost of running the business for a year
- S&P 500’s 2021 ROC was 14.6%
The aristocrats have averaged 88% ROC in the last 12 months. These international aristocrats averaged 195%, more than 2X as much.
The aristocrat’s average ROC in the 67th percentile of their respective industries, and these international aristocrats 82nd percentile.
The aristocrats’ 13-year median ROC is 74%, and these international aristocrats 84%.
According to one of the greatest investors in history, these international aristocrats are more than 2X higher quality than the US aristocrats and 13X higher quality than the average S&P 500 company.
S&P estimates the average aristocrats’ 30-year bankruptcy risk at 3% and these international aristocrats’ at 3.9%.
- US aristocrats: A – stable credit rating
- these international aristocrats: BBB+ stable credit rating
Six rating agencies consider the average aristocrat’s long-term risk-management in the 67th industry percentile.
These six international aristocrats? 76th percentile. What does that mean?
Long-Term Risk Management That’s The 105th Best In The DK 500 Master List: 81st Percentile
| Classification | Average Consensus LT Risk-Management Industry Percentile |
Risk-Management Rating |
| S&P Global (SPGI) #1 Risk Management In The Master List | 94 | Exceptional |
| Strong ESG Stocks | 78 |
Good – Bordering On Very Good |
| 6 World-Beater High-Yield International Aristocrats | 76 |
Good |
| Foreign Dividend Stocks | 75 | Good |
| Ultra SWANs | 71 | Good |
| Low Volatility Stocks | 68 | Above-Average |
| Dividend Aristocrats | 67 | Above-Average |
| Dividend Kings | 63 | Above-Average |
| Master List average | 62 | Above-Average |
| Hyper-Growth stocks | 61 | Above-Average |
| Monthly Dividend Stocks | 60 | Above-Average |
| Dividend Champions | 57 | Average |
(Source: DK Research Terminal)
Their risk-management consensus is in the top 19% of the world’s highest quality companies and similar to that of such other blue-chips as:
- Philip Morris International (PM): Ultra SWAN dividend king
- Canadian National Railway (CNI): Ultra SWAN dividend aristocrat
- Texas Instruments (TXN): Ultra SWAN
- Royal Bank of Canada (RY): Ultra SWAN
- Bank of Montreal (BMO): Ultra SWAN
- Toronto-Dominion Bank (TD): Ultra SWAN
- Canadian Imperial Bank of Commerce (CM): Ultra SWAN
- Qualcomm (QCOM): Ultra SWAN
- Visa (V): Ultra SWAN
How do we know how well these international aristocrats manage their risk?
How We Monitor These International Aristocrat’s Risk Profile
- 134 analysts
- 4 credit rating agencies
- 9 total risk rating agencies
- 143 experts who collectively know this business better than anyone other than management
- and the bond market for real-time fundamental risk assessments when news breaks
When the facts change, I change my mind. What do you do, sir?” – John Maynard Keynes
There are no sacred cows at iREIT or Dividend Kings. Wherever the fundamentals lead, we always follow. That’s the essence of disciplined financial science, the math behind retiring rich and staying rich in retirement.
OK, now that you understand why these are some of the highest quality and safest international aristocrats, here’s why you might want to buy them today.
Wonderful Companies At Wonderful Prices
(Source: Dividend Kings Zen Research Terminal)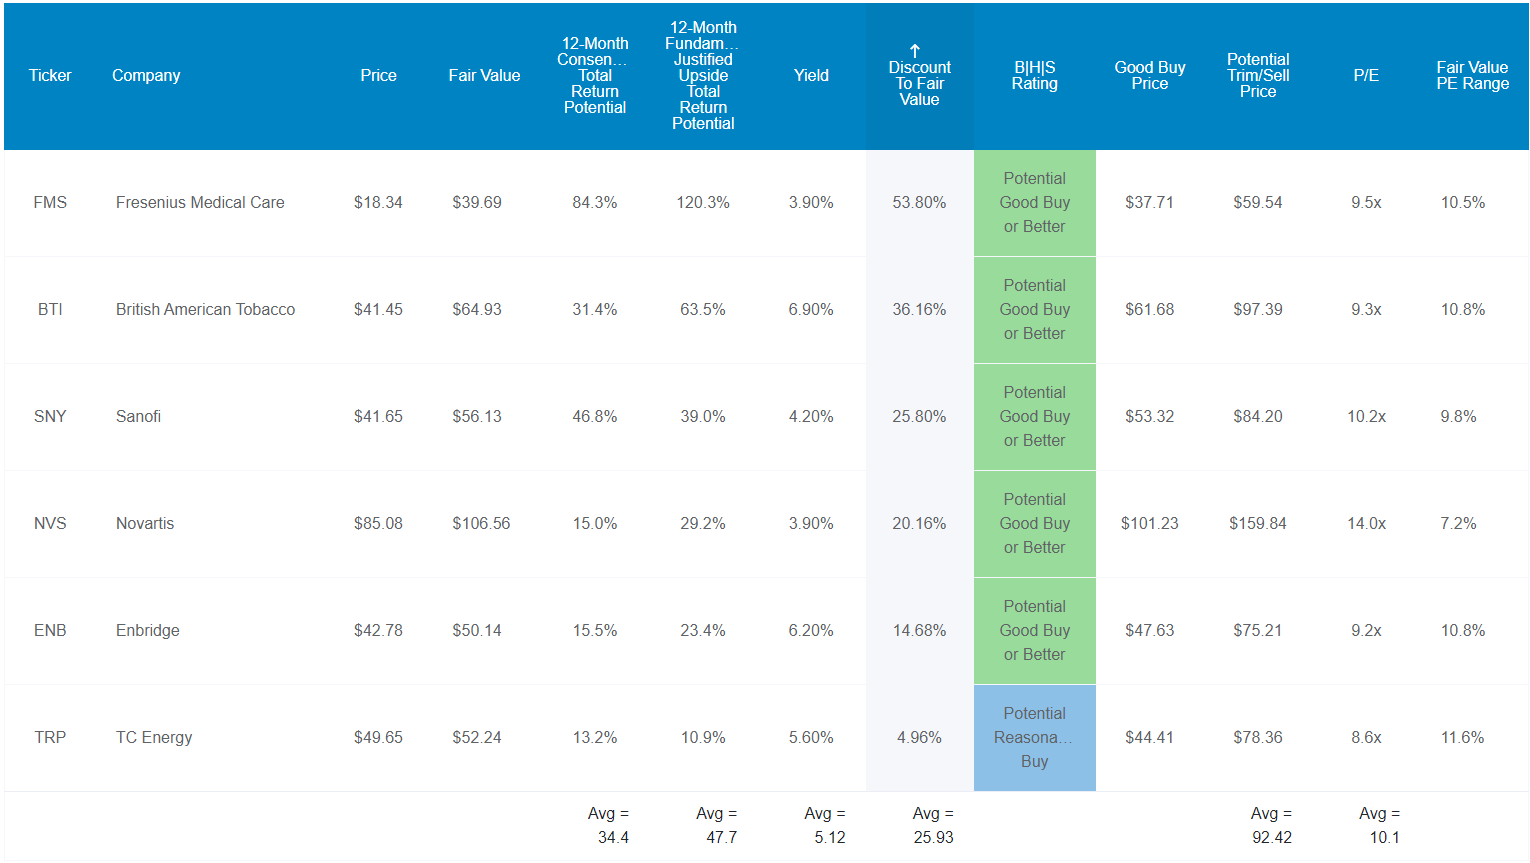
The S&P 500 is full of world-beater blue-chips and trades at 18.3X forward earnings, a 9% historical premium.
The dividend aristocrats are the bluest of blue-chips, and trade at 21X forward earnings, a 4% historical premium.
These international aristocrats are higher quality are more than 2X higher quality than the aristocrats and 13X higher quality than the S&P 500 according to Joel Greenblatt.
And yet they trade at just 10.1X forward earnings. Do you know the last time the S&P traded at 10.1X earnings? The Pandemic crash? 13.5X earnings.
The Great Recession bottom? 10.3X earnings.
The last time the S&P 500 was 10.1X earnings was 28 years ago, in 1984.
- today you can buy these world-beater international aristocrats at a PE that the S&P 500 hasn’t seen in 28 years and is never likely to ever see again
That’s why analysts 34% total returns from these international aristocrats in just the next 12 months. But do you know what their 12-month fundamentally justified total return is? 48%.
- if they all grow as expected in the next year and return to mid-range historical market-determined fair value you will make 48%.
But my goal isn’t to help you score a quick 34% return, or even a 50% return in just a year.
My goal is to help you achieve over decades 10X to 340X inflation-adjusted returns. And here’s how these international aristocrats can do that.
How These Aristocrats Can Help You Retire In Safety And Splendor
(Source: Dividend Kings Zen Research Terminal)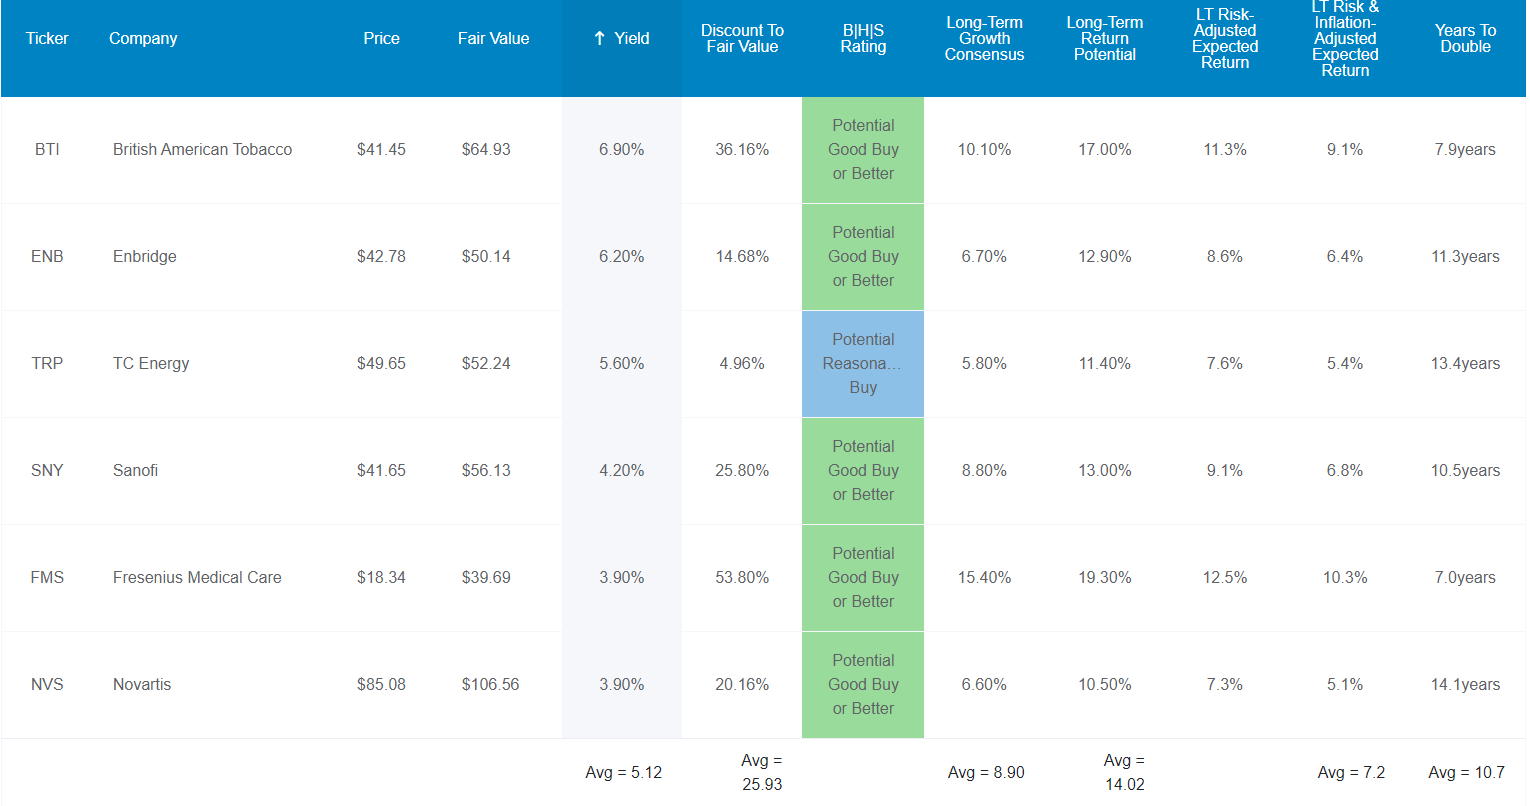
These Ultra SWAN international aristocrats offer one of the world’s safest 5.2% yields, and analysts expect them to grow almost 9% annually over time, potentially delivering 14.0% CAGR long-term returns.
| Investment Strategy | Yield | LT Consensus Growth | LT Consensus Total Return Potential | Long-Term Risk-Adjusted Expected Return | Long-Term Inflation And Risk-Adjusted Expected Returns | Years To Double Your Inflation & Risk-Adjusted Wealth |
10-Year Inflation And Risk-Adjusted Expected Return |
| 6 World-Beater International Aristocrats | 5.1% | 8.9% | 14.0% | 9.8% | 7.6% | 9.5 | 2.08 |
| Dividend Aristocrats | 2.4% | 8.6% | 11.0% | 7.7% | 5.5% | 13.2 | 1.70 |
| S&P 500 | 1.6% | 8.5% | 10.1% | 7.1% | 4.9% | 14.8 | 1.61 |
| Nasdaq | 0.9% | 12.6% | 13.4% | 9.4% | 7.2% | 10.0 | 2.00 |
(Sources: Morningstar, FactSet, Ycharts)
That’s not only more than the aristocrats and S&P 500; it’s potentially better than the Nasdaq.
The risk-adjusted expected returns are 9.8%, still better than three of the most popular investment strategies.
The risk and inflation-adjusted expected return, a conservative estimate of the returns you will experience, is a 7.6% CAGR, still better than the S&P, aristocrats, and Nasdaq.
- even factoring in companies not growing as expected
- recessions
- bear markets
- bad luck
- valuations not returning to historical fair value
- even going bankrupt
Inflation-Adjusted Consensus Total Return Potential: $1,000 Initial Investment
| Time Frame (Years) | 7.9% CAGR Inflation And Risk-Adjusted S&P Consensus | 8.9% Inflation-Adjusted Aristocrat Consensus | 11.8% CAGR Inflation-Adjusted 6 World-Beater High-Yield International Aristocrats Consensus | Difference Between Inflation-Adjusted 6 World-Beater High-Yield International Aristocrats And S&P Consensus |
| 5 | $1,461.18 | $1,530.17 | $1,745.10 | $283.92 |
| 10 | $2,135.06 | $2,341.43 | $3,045.38 | $910.32 |
| 15 | $3,119.71 | $3,582.79 | $5,314.49 | $2,194.78 |
| 20 | $4,558.47 | $5,482.29 | $9,274.32 | $4,715.85 |
| 25 | $6,660.75 | $8,388.86 | $16,184.62 | $9,523.87 |
| 30 Retirement Time Frame | $9,732.58 | $12,836.40 | $28,243.80 | $18,511.22 |
| 35 | $14,221.09 | $19,641.92 | $49,288.28 | $35,067.19 |
| 40 | $20,779.62 | $30,055.54 | $86,013.02 | $65,233.41 |
| 45 | $30,362.83 | $45,990.17 | $150,101.40 | $119,738.57 |
| 50 | $44,365.65 | $70,372.93 | $261,942.08 | $217,576.42 |
| 55 | $64,826.35 | $107,682.76 | $457,115.33 | $392,288.98 |
| 60 Investing Lifetime | $94,723.18 | $164,773.26 | $797,712.35 | $702,989.17 |
(Source: DK Research Terminal, FactSet)
Stocks are the best-performing asset class in history, and the aristocrats beat the market, and these international aristocrats are expected to beat the aristocrats. That means potentially life-changing long-term returns from some of the best 5.2% yielding companies on earth.
| Time Frame (Years) | Ratio Aristocrats/S&P Consensus | Ratio Inflation-Adjusted 6 World-Beater High-Yield International Aristocrats vs. S&P consensus |
| 5 | 1.05 | 1.19 |
| 10 | 1.10 | 1.43 |
| 15 | 1.15 | 1.70 |
| 20 | 1.20 | 2.03 |
| 25 | 1.26 | 2.43 |
| 30 | 1.32 | 2.90 |
| 35 | 1.38 | 3.47 |
| 40 | 1.45 | 4.14 |
| 45 | 1.51 | 4.94 |
| 50 | 1.59 | 5.90 |
| 55 | 1.66 | 7.05 |
| 60 | 1.74 | 8.42 |
(Source: DK Research Terminal, FactSet)
Analysts think these international aristocrats could run circles around the US variety and put the S&P 500 to shame in the coming decades.
What evidence is there that these aristocrats can break the curse of international aristocrats and deliver double-digit market-beating returns?
Historical Total Returns Since December 1996: Equal Weighting And Annual Rebalancing
Let’s look at how 5.2% yielding Ultra SWAN world-beater aristocrats performed over the last 26 years when about 94% of total returns were the result of fundamentals, not luck.
(Source: Portfolio Visualizer Premium)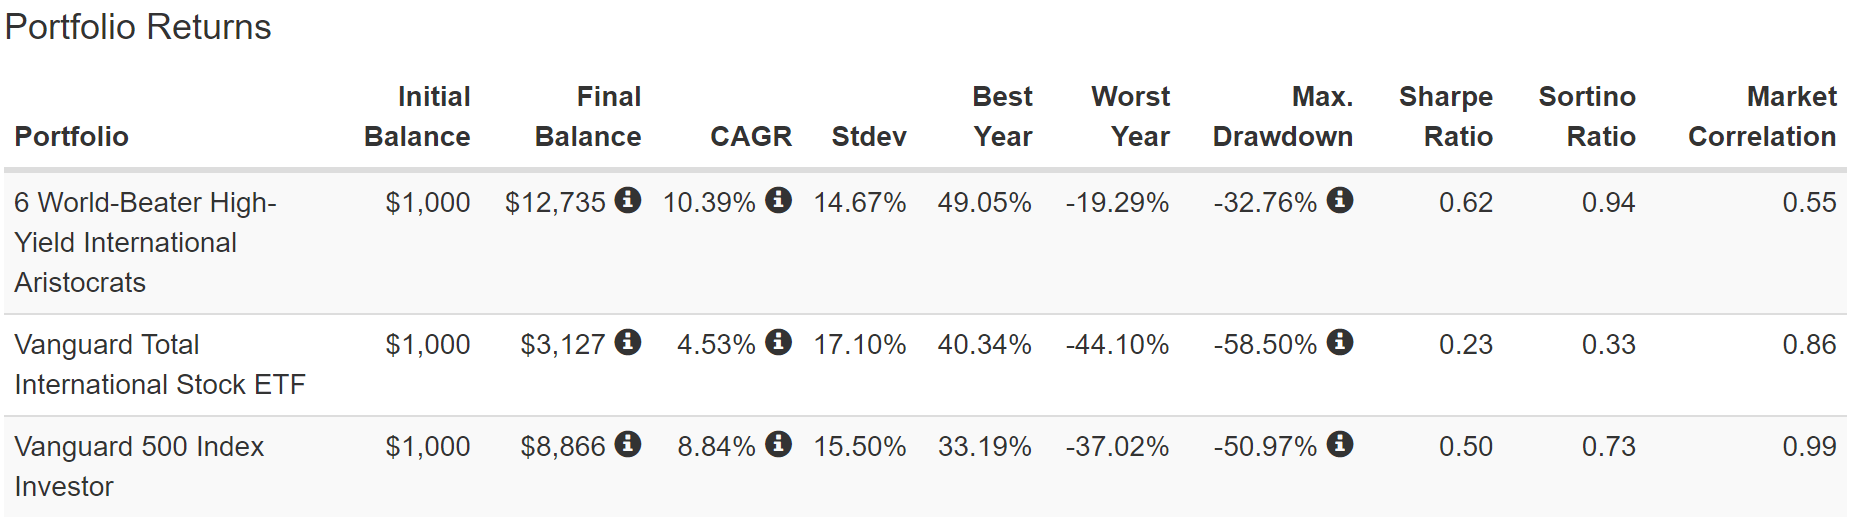
The S&P 500 is full of world-beaters, and that’s why it doubled the annual returns of the rest of the world for the last 26 years.
These world-beater aristocrats beat the S&P 500 by a modest amount but with less volatility, including a 33% peak decline in the Great Recession.
These world-beater aristocrats delivered 3X the negative volatility-adjusted returns of international stocks, as seen by their Sortino ratio.
- 29% better negative volatility-adjusted returns than the S&P 500
(Source: Portfolio Visualizer Premium)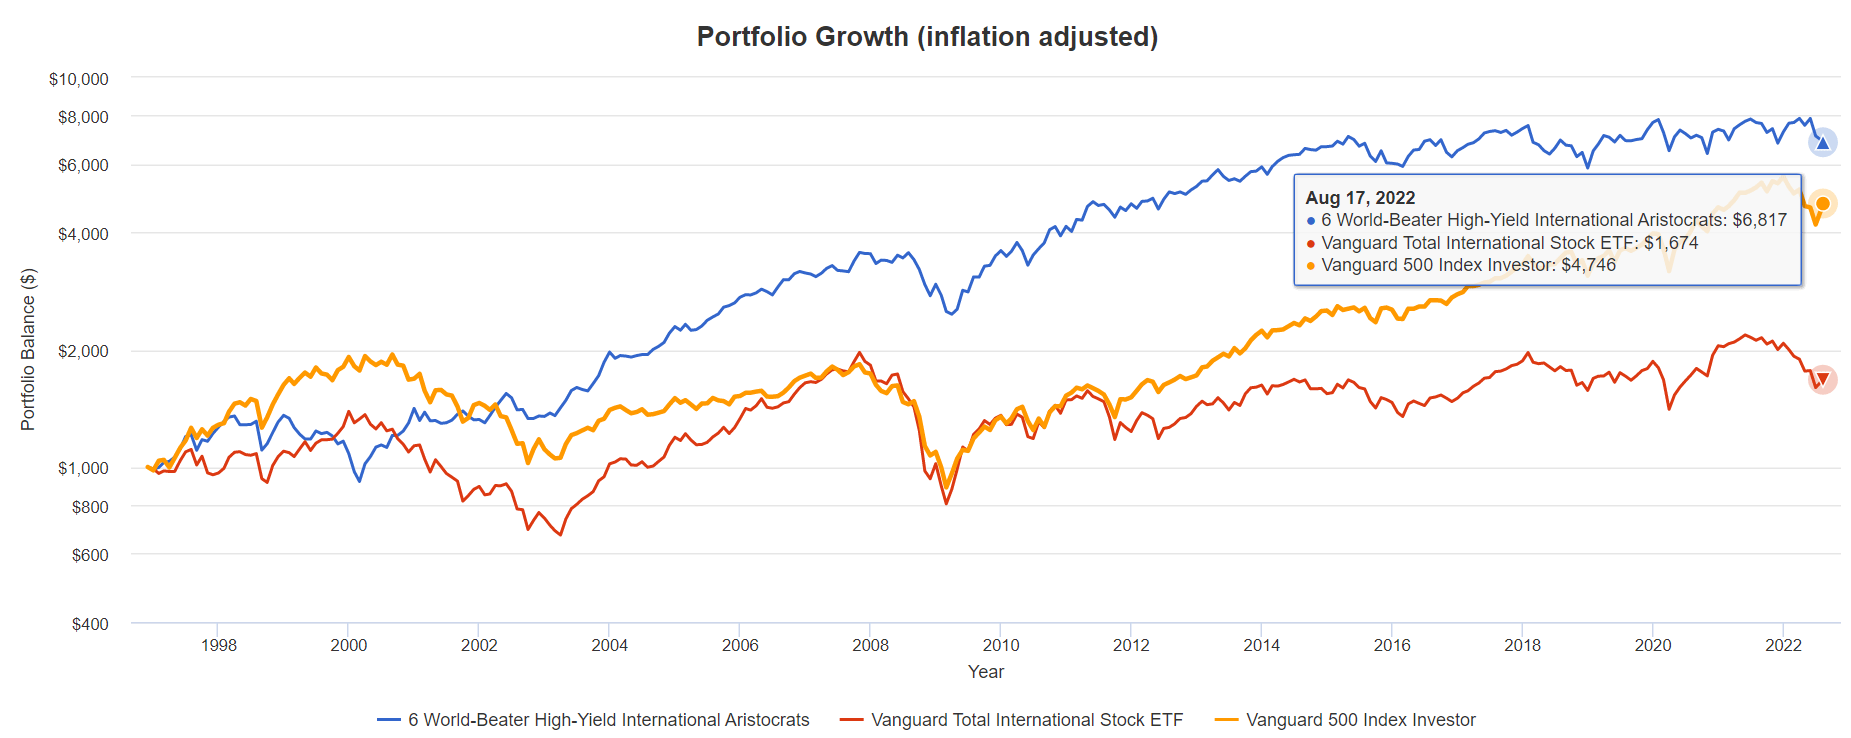
Inflation-Adjusted Returns Since 1996
| Stock | Ticker | Inflation-Adjusted Return Since February 2004 |
Annual Real Return Since February 2004 |
| 6 World-Beater High-Yield International Aristocrats | BTI, ENB, TRP, SNY, NVS, FMS | 582% | 7.7% Vs. 7.6% CAGR risk and inflation-adjusted expected return |
| Vanguard Total International Stock Fund | VGTSX | 67% | 2.0% |
| S&P 500 | VOO | 375% | 6.2% |
(Source: Portfolio Visualizer Premium)
These world-beater aristocrats delivered 44% better inflation-adjusted returns than the S&P 500. Compared to international stocks? They delivered 4X better inflation-adjusted returns over the last 26 years.
And let’s not forget the most important part of owning aristocrats, income safety and growth over time.
Income Growth Legends You Can Trust
(Source: Portfolio Visualizer Premium) dividends reinvested, income in USD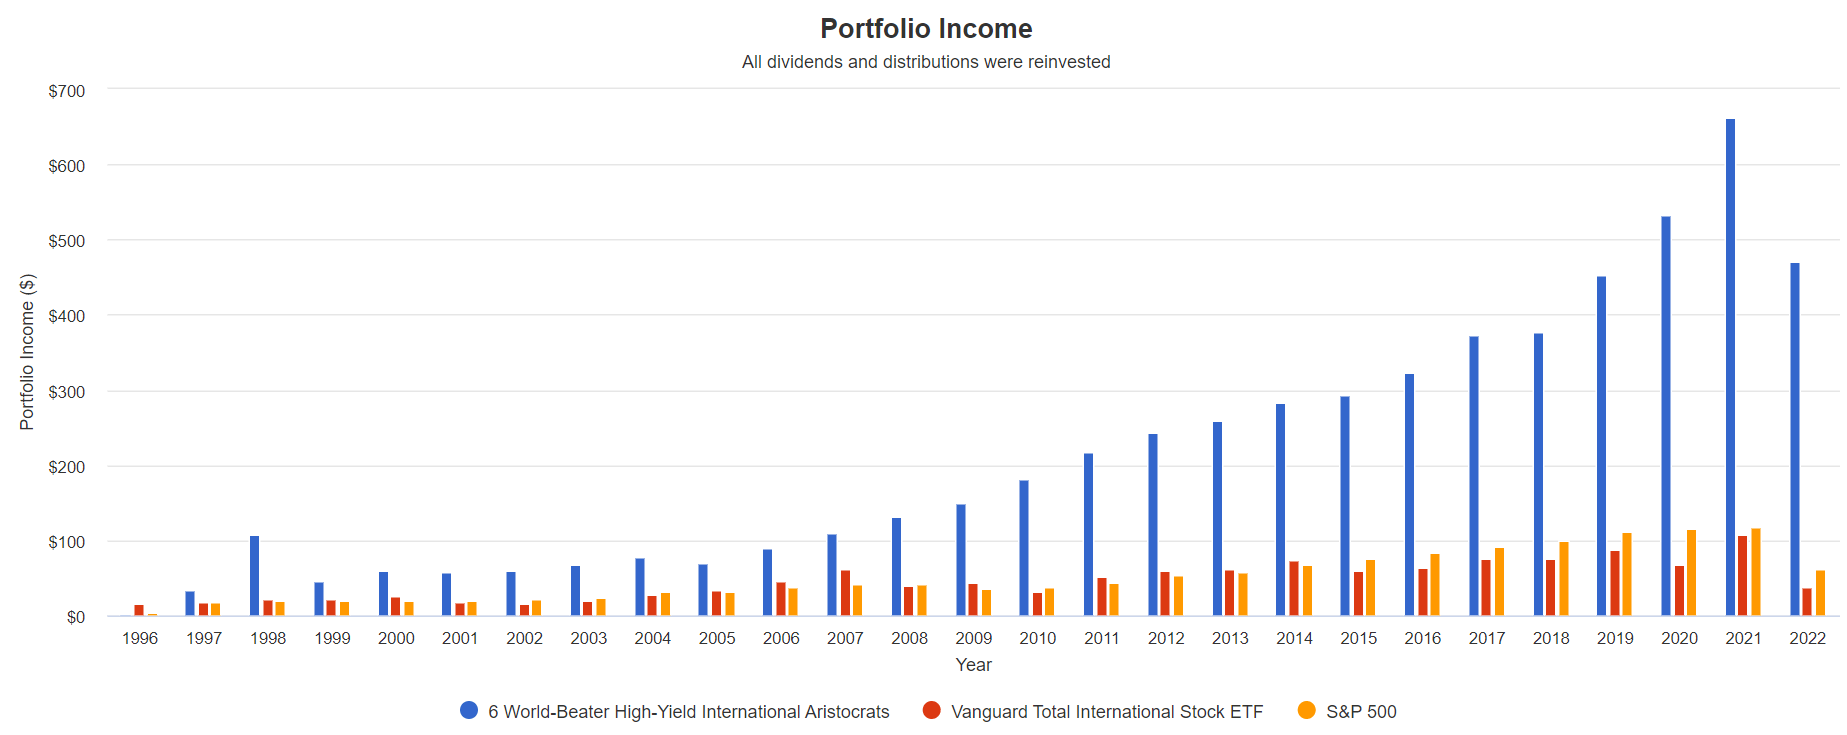
Want to know the power of high-yield aristocrat investing over decades? Behold the glory of a quarter century of world-class dividend compounding.
Cumulative Dividends Since 1997: $1,000 Initial Investment
| Metric | S&P 500 | Vanguard Total International Stock Fund |
6 World-Beater High-Yield International Aristocrats |
| Total Dividends | $1,441 | $1,289 | $6,199 |
| Annualized Income Growth Rate | 8.0% | 5.7% | 14.1% |
| Total Income/Initial Investment | 1.44 | 1.29 | 6.20 |
| Inflation-Adjusted Income/Initial Investment | 0.77 | 0.69 | 3.33 |
| More Inflation-Adjusted Income Than International Stocks | 1.12 | NA | 4.81 |
| Starting Yield | 1.8% | 1.9% | 3.5% |
| Yield On Cost | 12.2% | 7.6% | 94.0% |
(Source: Portfolio Visualizer Premium) dividends reinvested, income in USD
International stocks grew dividends at a reasonable 6%. The S&P 500 at 8% and these world-beater aristocrats at 14% annually… for 25 years.
They delivered 6X your initial investment, 3X adjusted for inflation, and 5X more inflation-adjusted income than international stocks.
Their yield was 3.5% in 1997, almost 2% less than it is today. Yet thanks to a decade of dependable and rapid dividend growth, the yield on cost is 94% today.
- in the next year, you’ll get 94% of your initial investment back in dividends
- and still growing at an exponential rate
What about the future? Thanks to some of the best growth prospects in decades and a 2% higher starting yield, here is what analysts expect in the future.
Consensus Future Income Growth Potential
| Analyst Consensus Income Growth Forecast | Risk-Adjusted Expected Income Growth | Risk And Tax-Adjusted Expected Income Growth |
Risk, Inflation, And Tax-Adjusted Income Growth Consensus |
| 17.0% | 11.9% | 10.1% | 7.9% |
(Source: DK Research Terminal, FactSet)
Analysts think these world-beater aristocrats could deliver 17% annual income growth in the future, which, adjusted for the risk of the company not growing as expected, inflation, and taxes, is 7.9% real expected income growth.
Now compare that to what they expect from the S&P 500.
| Time Frame | S&P Inflation-Adjusted Dividend Growth | S&P Inflation-Adjusted Earnings Growth |
| 1871-2021 | 1.6% | 2.1% |
| 1945-2021 | 2.4% | 3.5% |
| 1981-2021 (Modern Falling Rate Era) | 2.8% | 3.8% |
| 2008-2021 (Modern Low Rate Era) | 3.5% | 6.2% |
| FactSet Future Consensus | 2.0% | 5.2% |
(Sources: S&P, FactSet, Multipl.com)
- 1.7% post-tax inflation-adjusted income growth from the S&P 500
- S&P 500’s historical post-tax inflation-adjusted income growth rate (current tax code) is 5.8% CAGR
S&P is now dominated by companies favoring buybacks over dividends, potentially explaining the slower income growth in the future.
What about a 60/40 retirement portfolio?
- 0.5% consensus inflation, risk, and tax-adjusted income growth.
In other words, these world-beater aristocrats could generate about 4.5X faster real income growth than the S&P 500 and 16X faster income growth than a 60/40.
- And a 3.3X higher and safer yield on day one
This is the power of world-beater international aristocrat investing in a bear market.
Bottom Line: World-Beater Blue-Chips Are Your Ticket To A Rich Retirement
Why are world-beater blue-chips so important?
Between 1926 and 2015, only 43% of equities carried a return higher than Treasury Bills. Only 86 of 26 000 stocks made half the return.” – Quantified Strategies
Because since 1926, out of 26,000 companies you could buy, just 4% of them delivered 100% of the market’s net returns.
- 1,150X inflation-adjusted return
- and 50% of those returns were from the top 86 companies
This is why a “core and explore” strategy combining the best blue-chip ETFs (like SCHD, VIG, VYM, DGRO, and QQQM) alone with individual world-beaters is the lowest risk way to reach your rich retirement goals.
- the appropriate diversification and asset allocation for your goals
- with superior yield, growth, and total returns potential than any individual ETF can offer
EFAD, EUDV, and EMDV represent three dangerous aristocrat ETFs that sound great in theory. But just like market timing, they don’t actually deliver good returns, and can rob you of the time that true world-beater blue-chips need to help you retire in safety and splendor.
In contrast, BTI, ENB, TRP, SNY, NVS, and FMS are six high-yield international aristocrats that dominate their respective industries.
They aren’t just good dividend growth blue-chips; they are Ultra SWAN (sleep well at night) quality world-beater aristocrats that have minted millionaires over the last 20 years.
And I can say with very high confidence that if you buy them today, as part of a diversified and prudently risk-managed portfolio, you’ll be very happy with the results in 5+ years.
Why?
- 5.2% very safe yield
- BBB+ stable average credit rating (5% fundamental risk)
- 76% long-term risk management percentile (Good risk-management, low risk, 9% better than the US aristocrats)
- quality similar to the US aristocrats
- 26% undervalued (10.1X earnings)
- 34% consensus 12-month return potential
- 48% fundamentally justified 12-month total return potential
- 19% CAGR consensus return potential through 2024
- 14% CAGR long-term return potential
- 14% CAGR historical income growth rate
- 17% CAGR consensus future income growth rate
It’s far better to buy a wonderful company at a fair price, than a fair company at a wonderful price.” – Warren Buffett
Are international stocks cheaper than US stocks? You bet. But they are cheaper for a reason.
- 122 years of underperforming US stocks indicates a 97% probability of a structural superiority to American companies that’s likely to continue
And when you can buy unquestionably wonderful international aristocrats like these for 10.1X earnings? That’s not just wonderful companies at a fair price, that wonderful quality at a wonderful price.
The bottom line is this. Don’t settle for mediocrity with your portfolio.
Don’t try to “check a box” and invest in just any dividend ETF.
International companies are wonderful if you buy world-beaters at wonderful prices. They not only can help you pay the bills today, but their safety and quality, and superior fundamentals can help you retire rich and stay rich in retirement.
Be the first to comment