

PashaIgnatov
Introduction
The first half of 2022 has proven to be a demanding period for investors as most asset classes have witnessed double-digit losses; with the exception of the energy (+47%) and the agricultural markets (+7%), domestic equities (-21%), international equities (-19%), bonds (-11%), inflation-protected securities (-13%), and industrial metals (-12%) have all proven to be avenues of severe value destruction. Precious metals too may have failed to make any money for their stakeholders, but in light of a broadly pessimistic backdrop, a low single-digit negative return profile is hardly distressing.
YCharts
After having weathered the storm, I believe a couple of precious metals are relatively better-positioned than the rest and will highlight two ETFs that can be pursued to potentially exploit these attractive themes. The first product is the Aberdeen Standard Physical Platinum Shares ETF (NYSEARCA:PPLT), and the second one is the SPDR Gold MiniShares Trust (NYSEARCA:GLDM).
A Few Reasons To Consider The PPLT ETF
The Aberdeen Standard Physical Platinum Shares ETF is a product whose movements are linked to platinum spot prices. With AUM of over $1bn and a listing history of 12 years, PPLT is the largest and oldest ETF that offers exposure to physical platinum. Investors could also pursue the GraniteShares Platinum Trust product (PLTM) which is slightly cheaper than PPLT (expense ratio of 0.5% vs 0.6% for PPLT), but I wouldn’t be too keen on that product as the average 60-day spreads are just too wide for my liking (0.35% vs 0.18% for PPLT).
Then, on the weekly charts, for over a year now, PPLT has been trending lower in the shape of a descending channel. Currently, it is perched at the lower end of the boundary of the descending channel, offering good risk: reward at current levels.
Investing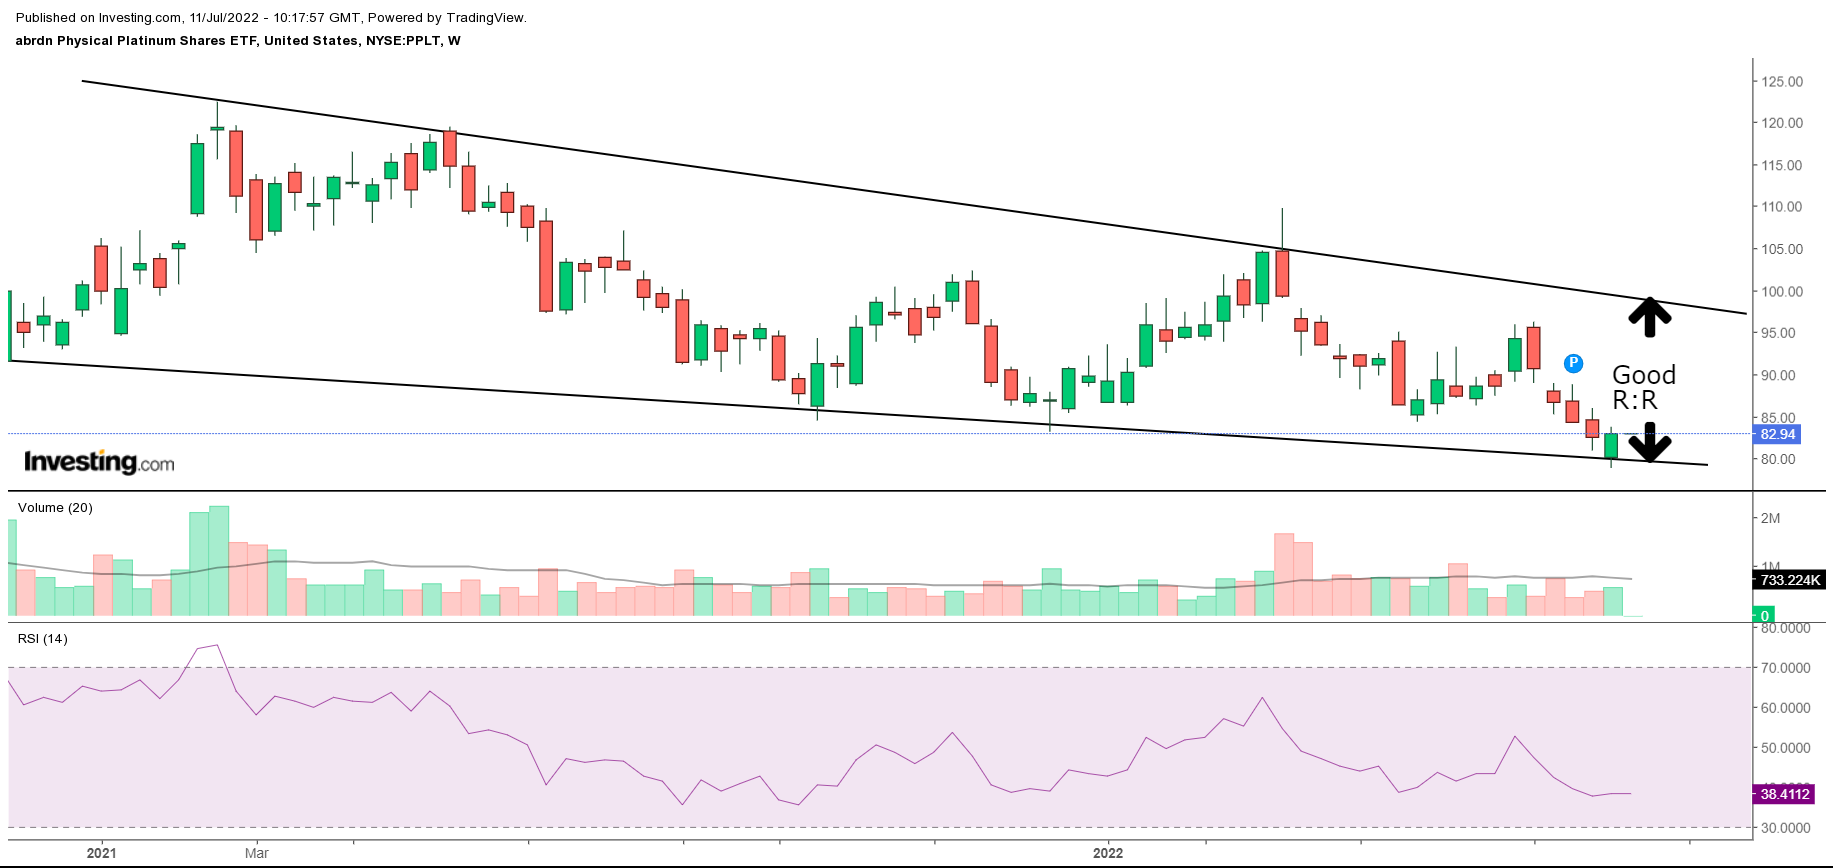
With platinum, the investment case is “primarily” driven by short and long-term developments tied to the automobile sector. Granted, over the last few decades, platinum’s sister metal- palladium has largely been the preferred choice for gasoline-based automobile producers (key components of catalytic converters). I believe we’ve now reached a point where the economics should dictate a sustained pivot in favor of platinum (over palladium) as the latter is trading at a price differential of around 2.5x the former.
This is reiterated across both the long-term and short-term relative strength charts which highlight platinum’s compelling value relative to palladium.
The long-term chart over the last 10 years shows that after a prolonged decline, things have flattened out in recent years and look finely set to reverse course.
Stockcharts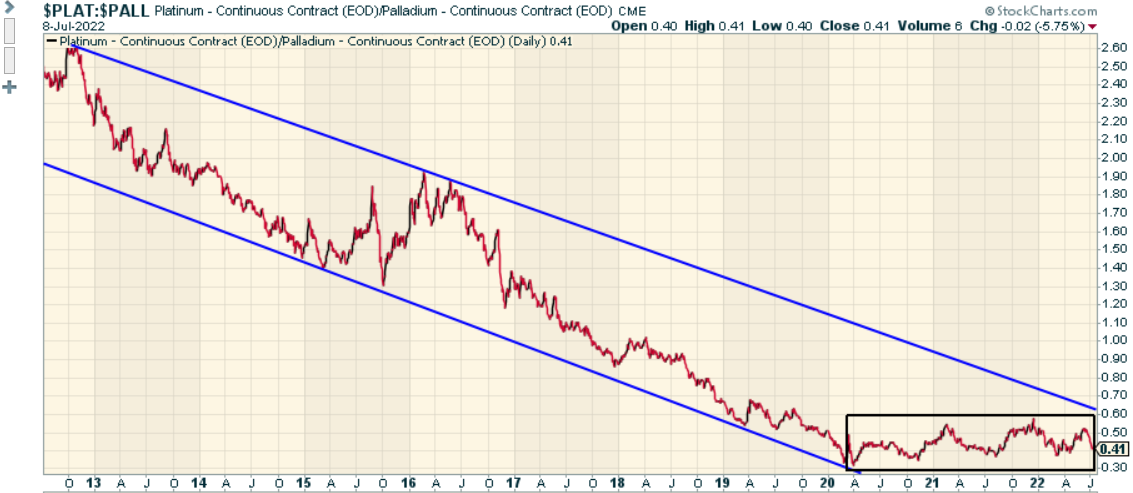
Over the short-term chart as well, note that this platinum to palladium ratio is now trading closer to its lower boundary, even as the RSI signals oversold conditions.
Stockcharts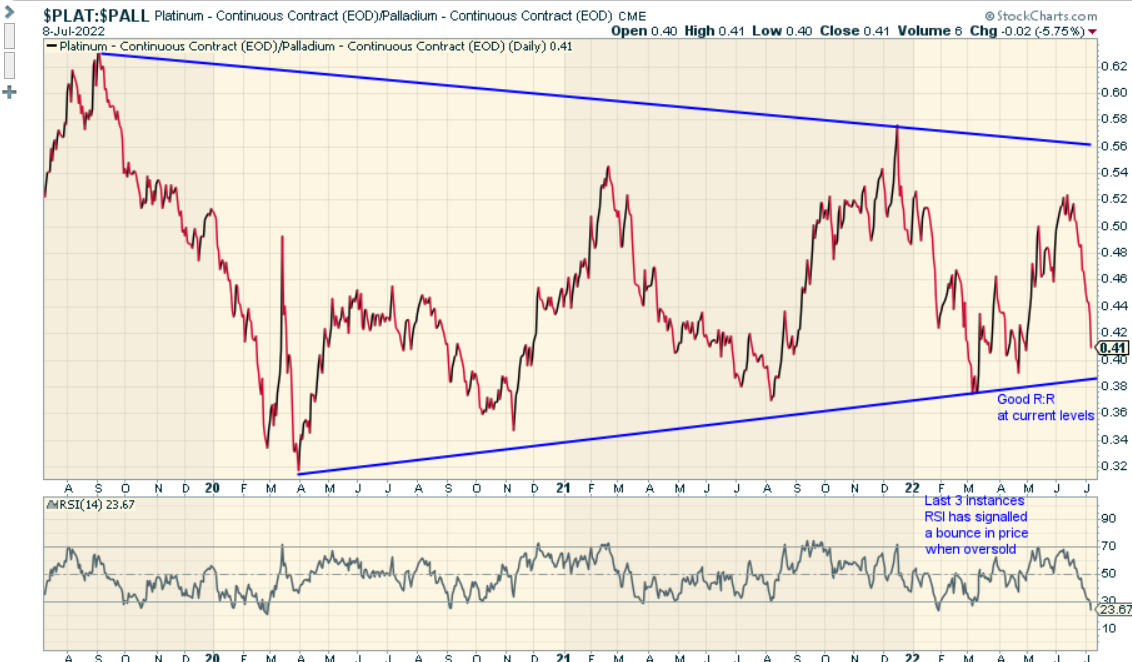
What has also increased the prospects of higher platinum to palladium substitution in autos, is developments related to Russia, which could be curtailed as an important source of palladium (it accounts for almost 40% of global palladium supplies, but just 11% of global platinum supplies).
WPIC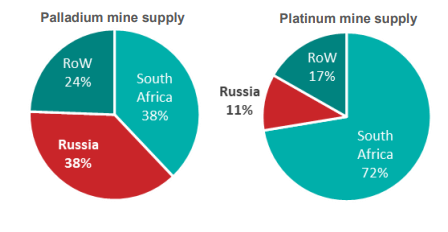
Difficulties in sourcing pricey palladium should tilt sentiment towards platinum. The World Platinum Investment Council (WPIC) believes that up to 75% of palladium in gasoline vehicle catalytic converters could be substituted by platinum without loss of thermal stability. If we assume a more conservative substation rate of 30-50%, auto companies could save anything between $670 and $1120 per year, even as this gives a fillip to platinum demand by 512-853 Koz. Crucially, a 50% substitution rate for potentially 12m new vehicles in a year, could transform the platinum supply-demand dynamics from a surplus scenario to a deficit scenario.
WPIC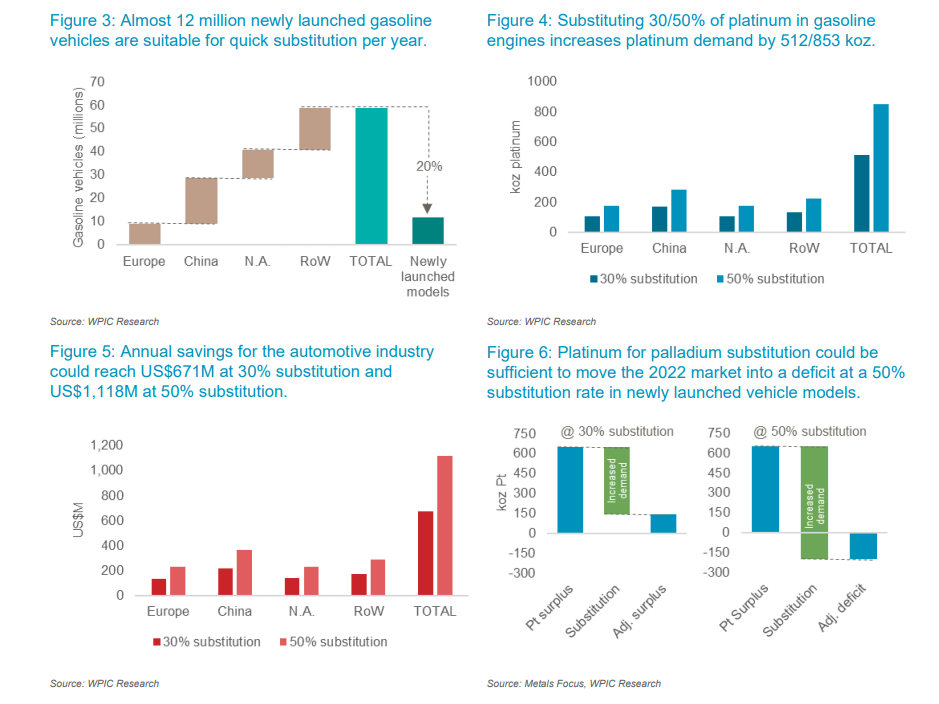
There are also other favorable consequences for platinum tied to the EU’s decision to replace 25-50 billion m3 of Russian gas with green hydrogen (carbon-free and developed through water electrolysis) sources. This could boost Europe’s electrolyzer capacity from 40GW to levels of 115GW (by 2030). Now, these electrolyzers could be either alkaline-based or PEM (Proton Exchange Membrane) based, and platinum’s fortunes are tied to the favorable penetration of the latter. Assuming an equal split between the two, and platinum loadings of 450g/MW (which could vary from 350-550g/MW), we could see incremental platinum demand of close to 240 Koz.
WPIC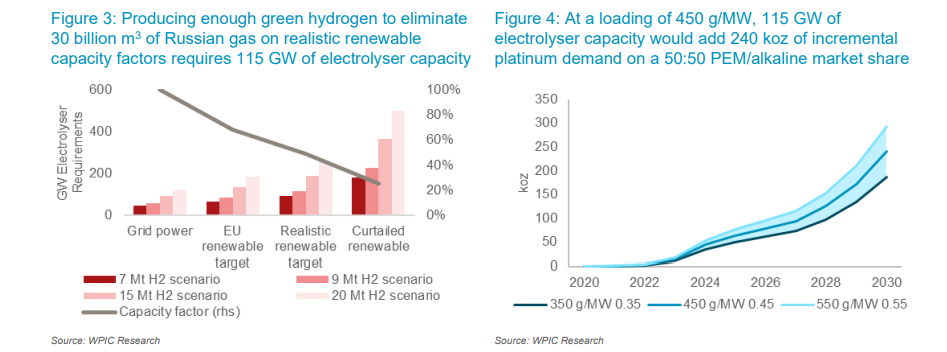
Then one also ought to consider what a fillip this could be for the impetus of FCEVs (Fuel Cell EVs) in Europe. For the uninitiated, PEM fuel cells are laced with platinum catalysts on the anode and the cathode. So far, automakers have not shown a great deal of alacrity in deepening their FCEV IP, as the hydrogen refueling infrastructure remains sub-par, but this could well change now on account of these Russian-related developments in Europe, and it certainly puts FCEVs in a much better position to make it commercially.
In the short-term as well, some encouraging factors may boost platinum’s prospects. After months of chip-induced shortages and lockdowns in some of the largest auto markets, it appears that the worst may be behind us. Take, for instance, the Chinese market which is the largest auto market in the world accounting for 30% of total sales. In June auto sales were up by an impressive 23% and analysts expect auto production in July to come in at the 20% levels (these forecasts have been lifted by 1.2% vs. the May report). In North America as well, another larger market, production appears to be rebounding with a 12.5% annual growth expected this year.
Near-term risks to the story could be tied to what happens in South Africa, the largest source of platinum. Note that the top 3 producers- Anglo American Platinum, Impala Platinum, and Northam Platinum had all flagged production challenges by the end of Q1 (refined supply was down 16%) and scaled-down their estimates.
WPIC WPIC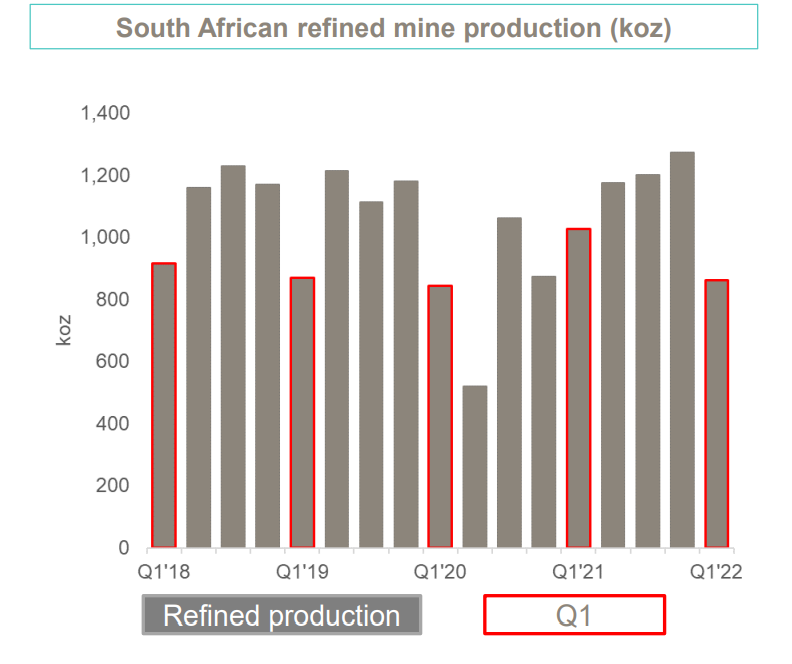
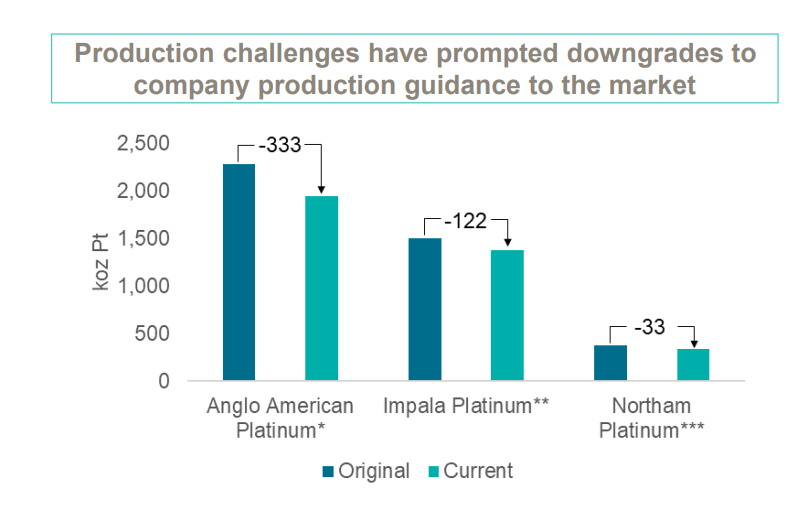
Labor-related challenges had rumbled on in Q1, as strikes became a dominant theme with workers clamoring for better wage agreements. It now appears that these issues were resolved towards the fag end of Q2, and we could see production come back quickly.
A Few Reasons To Consider The GLDM ETF
The SPDR Gold MiniShares Trust is marketed by State Street, whose flagship product happens to be the SPDR Gold Shares Trust (GLD). Ideally, I would have suggested GLD (which is also the first US-listed ETF backed by physical gold), as it is the most popular gold ETF in the world, with AUM of $58bn (which is more than 2x greater than the next biggest gold themed ETF), and an extremely low average spread % of 0.01% (GLDM:0.03%). However, the “substantial” cost-efficiency differential makes GLDM the preferred bet; GLDM’s gross expense ratio of 0.18% is more than 2x lower than GLD’s corresponding figure.
Investing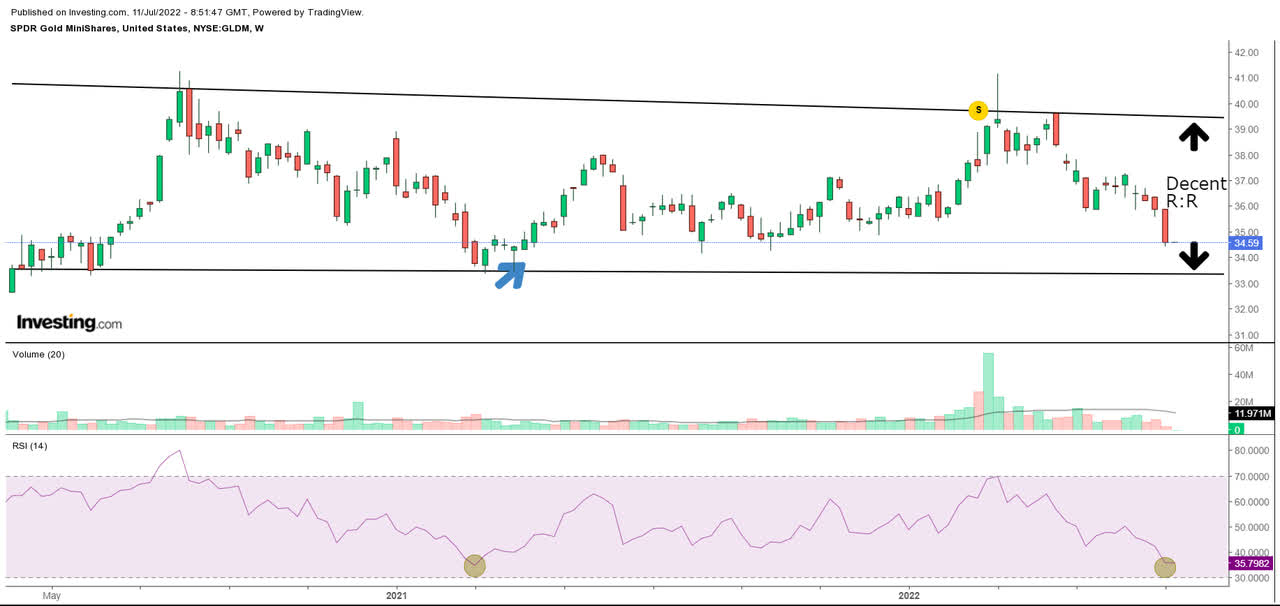
Besides that, if one looks at the GLDM’s larger-time frame weekly chart we can see that over the last 27 months it has traded within a rough range of $33-40. Currently, the price is closer to the lower boundary of this range (implying decent risk-reward), even as the RSI has dropped to levels where it previously signaled a bounce in the price action.
Inflation and geo-political risks have been the talk of the town for the last six-nine months. If these were the only dominant themes, there’s a reasonable probability that gold would have fared a lot better (it delivered less than +1% returns in H1), as it has previously (not always) served as a useful inflation hedge and as a haven during political and market turmoil.
Unfortunately, what we’ve also seen in recent months is an aggressive pivot towards higher interest rates by the US Fed (75bps in June and another potential 75bps in July), which has also boosted the dollar’s prospects, the currency in which gold is priced. Needless to say, higher interest rates also make bonds another compelling safe haven option for investors to gravitate towards.
As we move into H2-22, I’d like to believe that interest rate expectations have now largely been priced in (Fed futures imply a potential peak of 3.4% by Feb) and if anything, we may actually see a cut in rates in 2023 by the end of 2023 (by 70bps). Data compiled by Bloomberg for over 4 decades show that when investors begin to price in expectations of rate cuts by 40bps or more, an economic downturn tends to follow suit over the next 18 months.
Bloomberg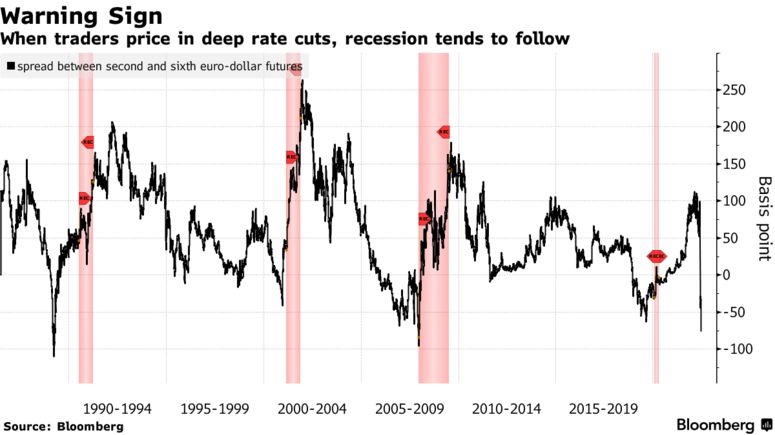
It may be early days, but the underlying data suggests that the economy is slowing. Consider conditions in the US; The Dallas Fed Manufacturing Index has been on a downward slide for the last 4 months, whilst the most two recent readings have been in negative territory.
Trading Economics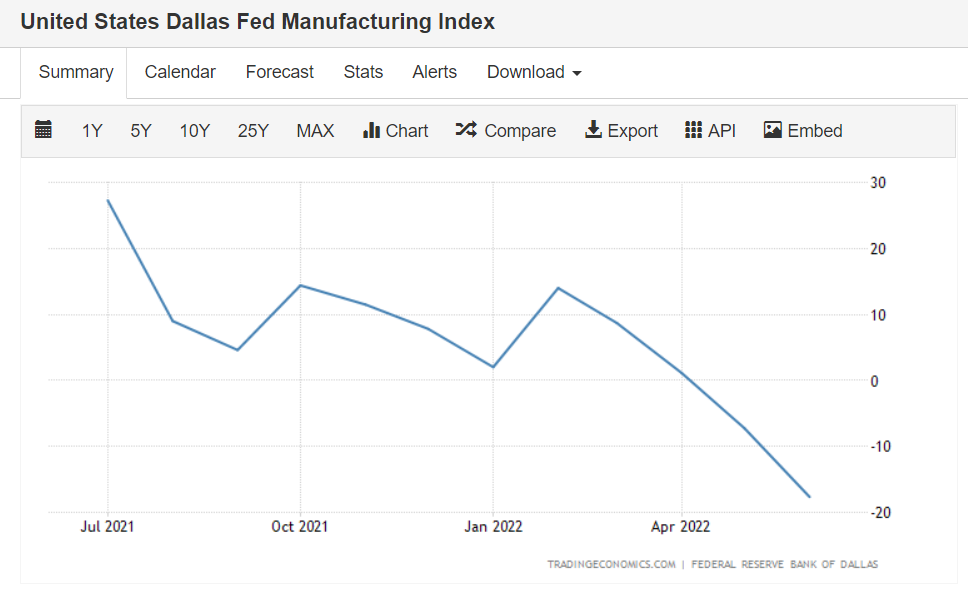
Risks in the employment market too appear to be inching up with the quantum of initial jobless claims trending up towards levels of 250K in recent weeks from levels of 170K a few months back.
Trading Economics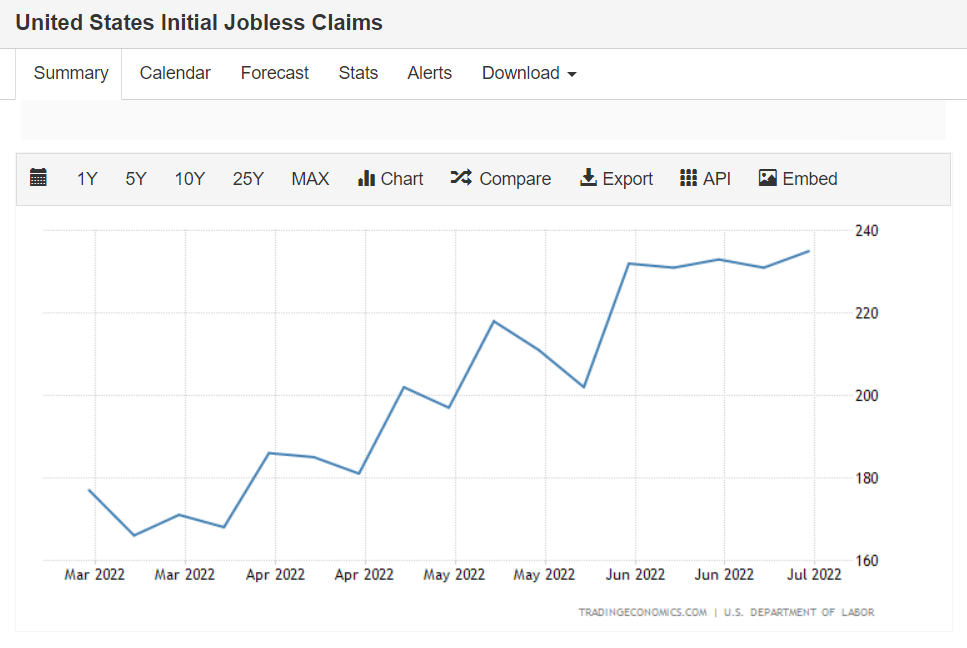
Meanwhile, consider something like the broad-based Leading Economic Index (LEI), which takes into consideration 10 diverse macro-economic metrics, including the employment market, the housing market, consumer expectations, interest rate spreads, etc., this index has now been sliding over the last months even as its YoY growth comes off.
Conference Board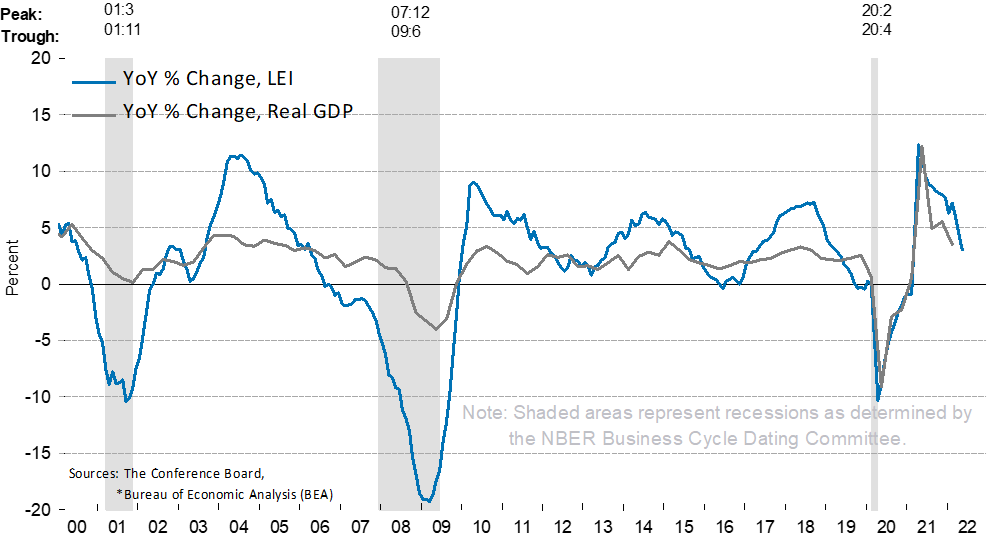
When interest rate expectations have likely peaked, growth is slowing and inflation is high, we have something akin to a stagflation environment. Data over the last five decades has shown that when faced with a stagflation landscape, gold has comfortably outperformed all the other major asset classes.
World Gold Council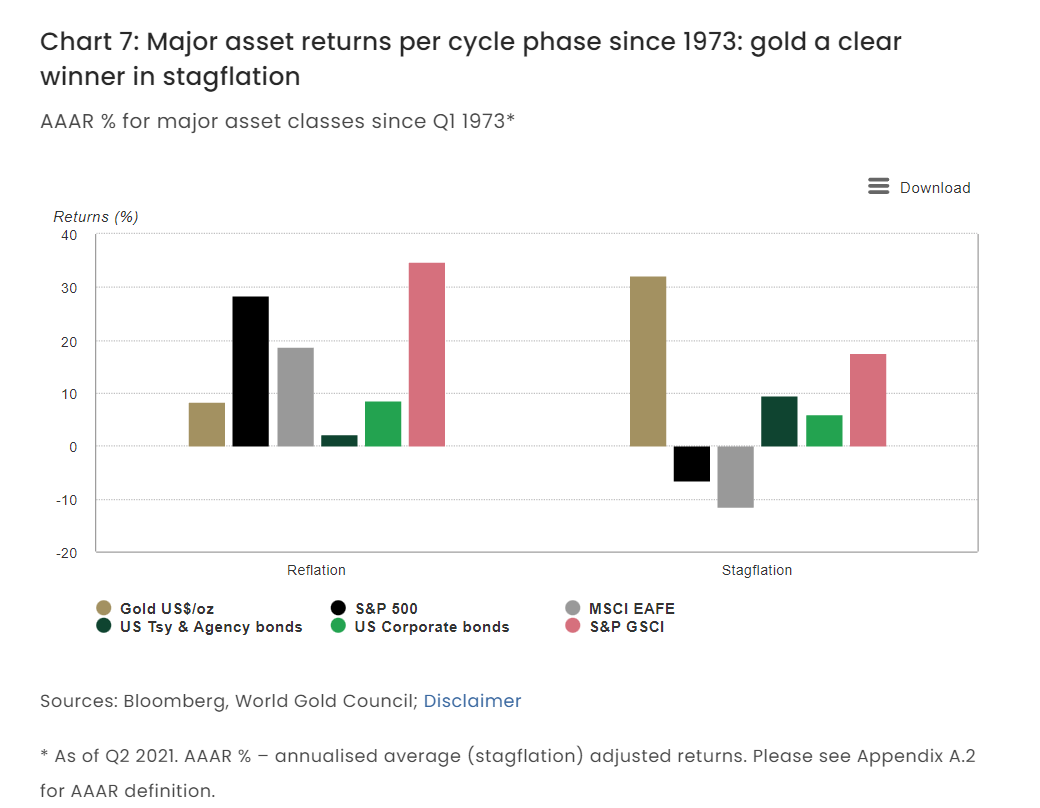
Meanwhile, also consider that central banks around the world, who are perhaps one of the most ardent holders of gold, are also poised to increase their gold holdings compared to last year.
World Gold Council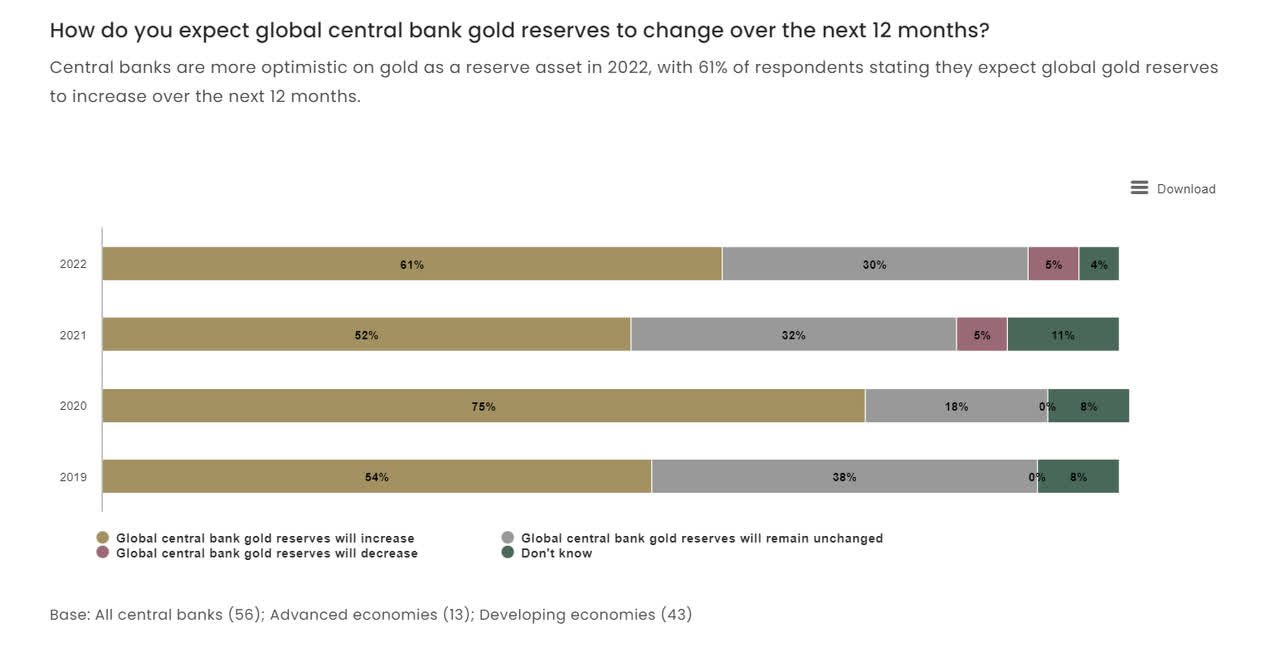
I also think that the price action on the daily gold chart looks rather overextended to the downside, even as it trends lower in the shape of a descending channel; The 14-day RSI hasn’t hit such lowly levels over the last year and we may see a bounce from here.
Trading View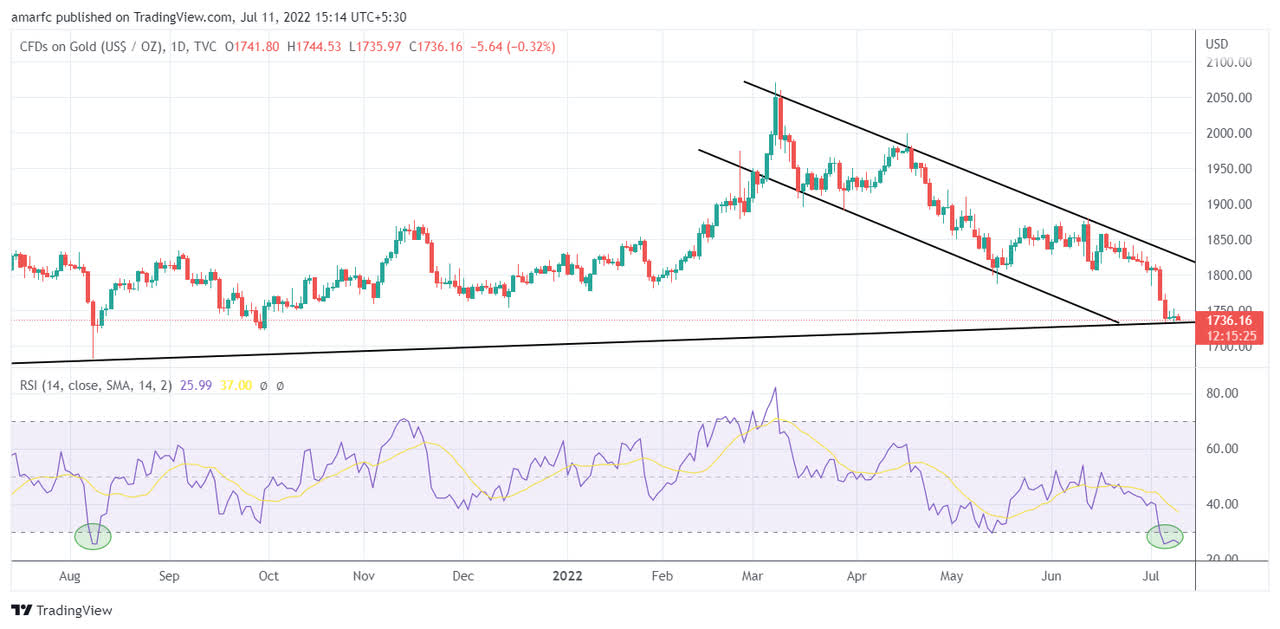
If there’s a slight concern over gold’s prospects, it is that India, a massive gold guzzler (the second-largest importer of gold last year)- has recently taken steps to curtail demand for this commodity. To curtail the pressure on the INR, the Indian government recently hiked import duty on gold by 425bps to 15%. This comes at a rather unfortunate time, as the country is not far away from the festival period that includes Dussehra and Diwali where gold demand tends to spike. This recent hike in duties could put a spanner in the works for Indian gold imports.
Be the first to comment