

akinbostanci
Co-produced with Treading Softly
Whenever I read a bearish article on a holding, I always remember to add a healthy dose of reality into the perspective.
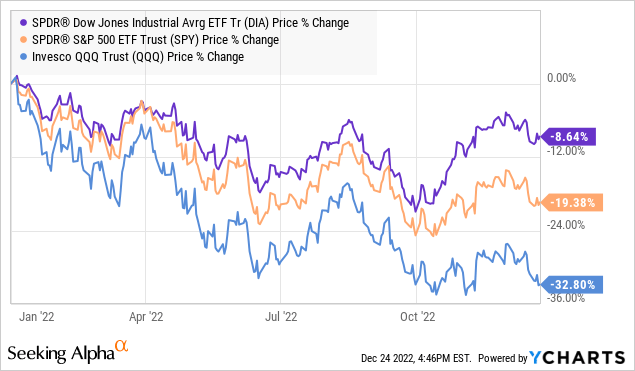
If the article explains XYZ company is down X% for the year but fails to remember the entire market is down between 8% and 32% as part of its analysis, they are likely overly myopic.
As an income investor, I am not absent-minded in regard to price movements. A common question from new investors or those adjusting to an income-investing mindset is how we can stomach price movements without getting tangled into knots.
I try to bring examples of the real world into their perspective. Why? Because all too often, we have nebulous ideas about the market. We forget that, at the end of the day, it’s made up of tangible assets. When you invest in a company, it’s not just dollars changing on a screen. It’s walls, cars, employees, equipment, etc. Every ticker is a business that is attempting to generate a profit following some strategy. You own part of something tangible.
One common reference that helps people understand the fluidity of value is a home. I own my home. I live there, and it protects me from the elements. It has a stated value. I can look up the market value of my home on sites like Zillow. I can get a better estimate by hiring a professional appraiser. I can hire two equally qualified appraisers on the same day and get two different estimates… Home value changes regularly. And to one particular buyer, my home might be worth a lot more than to another buyer.
I don’t sell my home when its price drops because I’m afraid it’ll drop further – that’s ridiculous! As long as my home provides its other benefits and I’m happy with them, I keep it.
I may decide this home is not the best option for me and move to another – be it larger or smaller – but the price change alone will not govern my decision. I would only consider selling my home if it was no longer the best option to suit my needs.
If my home value is falling in line with the housing market where I live, I would not let a panic-filled article on how home values are falling cause me to move under an overpass to avoid holding a falling knife!
So today, I want to highlight two homes that have dipped in value but continue to provide all the benefits I expect from them. We’ll take a look at their fundamental outlooks and show why I am not moving out – and why you may want to move in.
Let’s dive in!
Pick #1: OXLC – Yield 17%
Oxford Lane Capital (OXLC) invests in “CLO equity” positions. Collateralized loan obligations are vehicles that invest in bank loans, aka “leveraged loans”. These are first-lien, senior-secured loans made to corporations with B/B+ credit ratings.
A CLO manages a portfolio of these loans and sells rights to the cash flow using a “waterfall” style payment system. Those who are willing to pay the highest premium get the “AAA” tranches, which get paid first and get a low return. The equity tranche gets paid last and gets whatever is left. There is no defined obligation, hence the word equity—the equity tranche shares in the profits, this allows for a very high return.
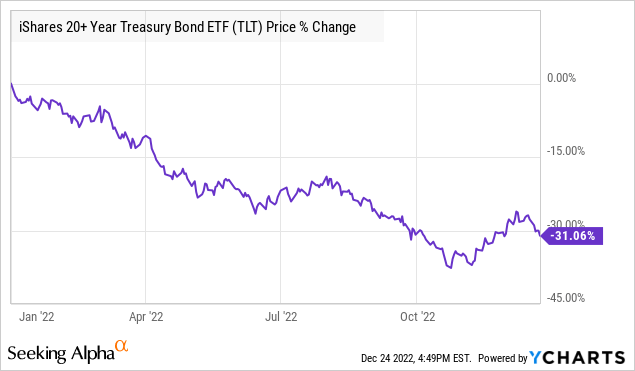
In 2022, debt prices have fallen across the board. An increasingly hawkish Fed has pushed prices of all loans lower. Even U.S. Treasuries have felt the wrath, and they are considered “risk-free”!
So it shouldn’t surprise anyone that corporate loans, which do carry the risk that the borrower might not repay as agreed, are also down in price. So OXLC is paying a nose-bleed yield, and its price is down both from a decline in NAV and from a decline in its premium to NAV which came into the year at a bullish 20% premium, and today OXLC is trading right around NAV.
Those realities have awoken all sorts of bears from their slumber. Allegations that OXLC is “destroying capital”, that it is “diluting shareholders”, and that it is paying for its dividends by selling assets. None of this is true; we can look at the numbers to confirm it.
Here is a look at the past five quarters. Note how OXLC’s “fair value of investments” is relatively flat. OXLC has $1.238 billion in the most recent quarter and $1.155 billion in the prior year. Source (Note that OXLC’s 2022 fiscal year ended on March 31st).
OXLC September Presentation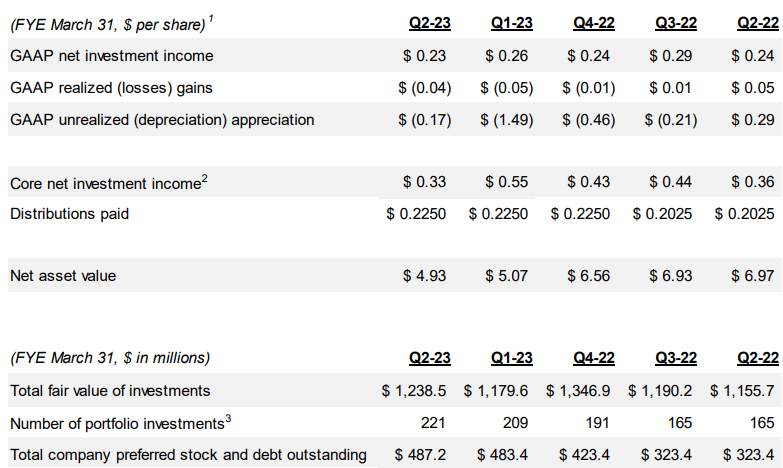
This appears rather anemic in the face of adding $164 million in preferred stock and debt. Looking at these numbers, one might conclude that OXLC has not been growing at all, and on a per/share basis, NAV has declined 30%. Bears will look at these headlines and weave their stories.
OXLC provides another way to look at its portfolio. They provide their investments at the original cost.
OXLC September Presentation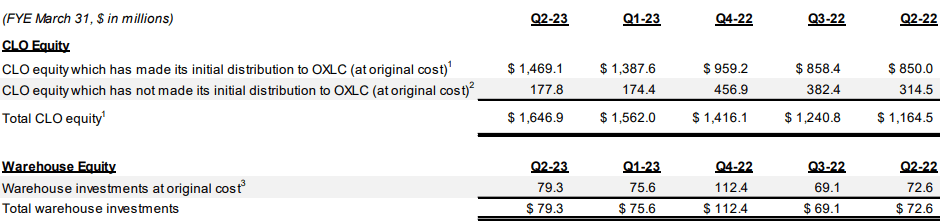
Note how OXLC’s total CLO equity expanded from $1.164 billion to $1.646 billion. A 40% increase! Remember, these are debt investments, so OXLC owns a lot more debt today than it owned a year ago.
If we go a step further, OXLC has $1.726 billion in cost basis invested in their investments (CLO Equity + warehouse investments), compared to $1.238 billion in fair value. That is a $488 million difference or approximately $3.07/share in unrealized losses.
A year earlier, OXLC had $1.237 billion in cost basis invested, and it was valued at $1.155 billion. This $82 million difference accounted for approximately $0.70/share in unrealized losses.
If we exclude unrealized losses, OXLC’s NAV in Q2 2022 would have been $7.67 ($6.97+ $0.70). In Q2 2023, NAV would have been $8.00 ($4.93 + $3.07). And OXLC paid out $0.8775 in dividends over the period.
In other words, this definitively proves that 100% of the decline in NAV is due to declining prices. It isn’t overpaying the dividend, it isn’t OXLC issuing equity at dilutive prices, it isn’t realized credit losses (realized losses are not carried in cost basis), or any of the other theories bears might come up with.
Now the only question that has to be answered is whether the unrealized losses are likely to become realized losses or whether that paper loss will likely recover at some point in the future.
We are solidly in the second camp. Keep in mind that OXLC has been paying below par for CLO equity positions and borrowers owe the full face value of the loan. In a typical CLO of, say, $100 million, the “debt” tranches might own the rights to $90 million in principal. The value of the equity tranche is based on the remaining $10 million. The ideal is obviously that $100 million is repaid, allowing the debt tranches to be paid in full and for the equity tranche to get a windfall of $10 million. In the real world, a certain number of that $10 million will be lost to default. The historical average is around 3%, which means that when the equity buyer invests, they should assume they will not recover more than $7 million. So equity buyers like OXLC are generally looking to buy at prices closer to $4-$6/$100 in principal.
Since they essentially are getting the last $10 of the loan, it is logical that when loan prices fall, equity CLO positions fall more. Here is a look at loan prices in the second half of 2022. Source
TCW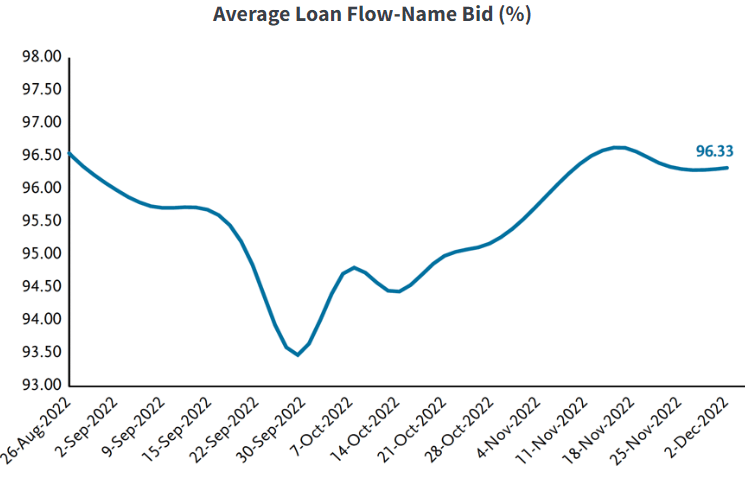
When you look at a loan trading at $96, you probably are not concerned about it, that is a discount, but it isn’t what most debt investors would call “distressed” and a warning sign that the market is expecting defaults. Instead, it is a discount caused by the reality that interest rates on newly issued debt are much higher today than on debt that originated 1-2 years ago. When the loans repay, they will repay $100. That extra $4? That goes directly into OXLC’s pocket to be reinvested at current (lower) prices or to be paid out as dividends.
Permanent losses occur when borrowers actually default. OXLC priced in that reality when it bought the equity positions. Defaults have been running at historic lows as companies spent 2020-2021 refinancing at historically low-interest rates. They also spent much of the pandemic building liquidity and shoring up their balance sheets. Some out of necessity, others out of being unwilling to invest in expansion. As a result, corporate balance sheets are much healthier than they have been in the past. We don’t see the indiscriminate leveraging up and irresponsible spending that has historically led to default spikes.
We believe that even in a recession, corporate defaults and bankruptcies will remain relatively low. In that case, OXLC will gain back its $3+ in unrealized losses as borrowers repay, plus extra upside if defaults remain at or below historical averages.
Pick #2: PFFA – Yield 10.8%
With prices of fixed-income so low, we are huge fans of buying preferred equity at these prices. The Fed is still semi-hawkish, yet there is light at the end of the tunnel. Furthermore, there are storm clouds of recession building up on the horizon, and exposure to preferred shares will help protect our income.
Preferred equity can be a great source of high yields, but preferred shares typically are not very liquid. Building a large portfolio requires patience and time. The HDO Model Portfolio has 48 preferred shares. I own them all, and owning all of them is a great goal. However, it is a goal that you shouldn’t rush. You should take your time, do your own due diligence, place limit orders, and buy shares at attractive prices.
While you take time to build your own portfolio, you can gain immediate exposure to preferred shares and start collecting your income right away. Virtus InfraCap U.S. Preferred Stock ETF (PFFA) is my go-to preferred ETF when I want to increase my exposure to preferred shares quickly. You get the benefit of much higher liquidity with an ETF, it consistently trades very close to NAV. This allows you to quickly increase or decrease your preferred position in a way that isn’t possible with a portfolio of individual picks.
PFFA is an ETF, but it has a few features that make it different and, in my opinion, better than its peers. First, PFFA uses leverage, targeting 20-30%. This enhances returns and allows it to pay an above-average dividend. Second, PFFA is actively managed.
This is rare for an ETF, as most ETFs just buy an index based on a predetermined set of rules. The manager rebalances once a month, then is gone. There is no commonsense check, no reaction to the news, thought, or determination. The formula tells the manager how much to buy or sell of what at any price.
For PFFA, you get the benefit of having an experienced manager, rebalancing the portfolio, selling investments, and buying new investments to maximize return.
The result? PFFA has had a significantly higher return than more traditional peers like iShares Preferred and Income Securities ETF (PFF) in its four years of existence.
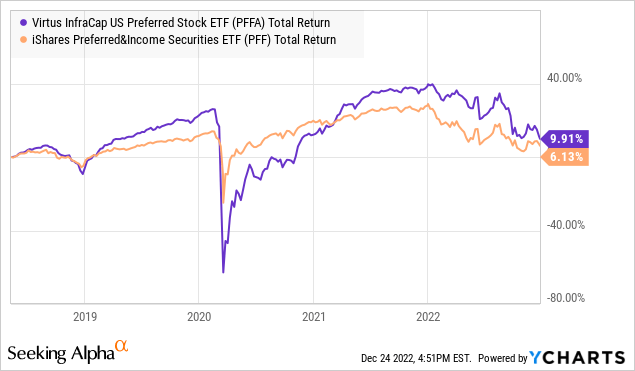
This was during four years that were brutal for preferred equity with COVID and now the most aggressive rate hiking cycle since Volcker. We are excited to see the upside PFFA will produce as interest rate conditions turn more favorable for all fixed income, including preferred equities!
Conclusion
While OXLC and PFFA have had negative returns this year, they continue to generate outsized income. With negative returns even on “risk-free” assets, it doesn’t take a deeply skilled analyst to expect other debt instruments to fall in value as well.
Within our High Dividend Opportunities Income Method, we seek income and high yields from the market. We are not swing traders or momentum gurus. We’re old-fashioned buy-and-hold fundamental investors. So when we see oversold income-generating opportunities, we buy them and hold them.
Like the house I live in, its value may move down and up, but if it’s providing its benefits and clearly can continue to do so, then there is little reason to run for the hills.
It’s frequently said that it’s easy to be bearish when everything is falling and easy to be bullish when everything is climbing.
I focus on the “why” behind my buy. I don’t let myself get scared easily when I’m happily living in my home. That’s a massive benefit from income investing.
Retirement should be a time of low stress and high enjoyment. Don’t let others scare you with their short-term backward-looking analysis. Understand what you hold and why then you can enjoy the sunset each night without living in the land of fear.
Be the first to comment