shapecharge/E+ via Getty Images
As of the close of April 14, 2022, the rules for the S&P 1500 scan were as follows:
- Stock is at new all-time highs.
- The five-day rate-of-change of the volume is positive.
Below are the results of the scan.
S&P 500 Scan Results (Price Action Lab Blog – Norgate Data)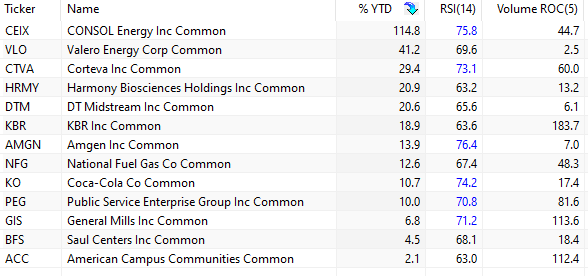
The scan produced 13 stocks, all at all-time highs for the period of available data, with year-to-date returns ranging from 114.8% to 2.1%. The 5-day rate-of-change of volume ranged from 183.7% to 2.5%. All the charts below are in the weekly timeframe.
CONSOL Energy Inc. (CEIX) YTD +114.8%
Weekly Chart of CEIX (Price Action Lab Blog – Norgate Data)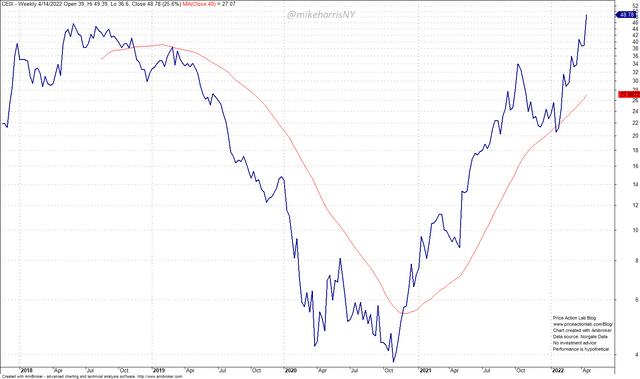
CONSOL Energy Inc. is a producer and exporter of high-Btu bituminous thermal and crossover metallurgical coal. (Source: TD Ameritrade)
Momentum is very strong, with the price of the stock 85.2% above the 200-day moving average. The P/E TTM is 77.91 and the Q1 2022 earnings release date is May 3, 2022. The EPS estimate consensus is $1.85 vs. $0.75 for the previous year’s Q1 actual.
Valero Energy Corp (VLO) YTD +41.2%
Weekly Chart of VLO (Price Action Lab Blog – Norgate Data)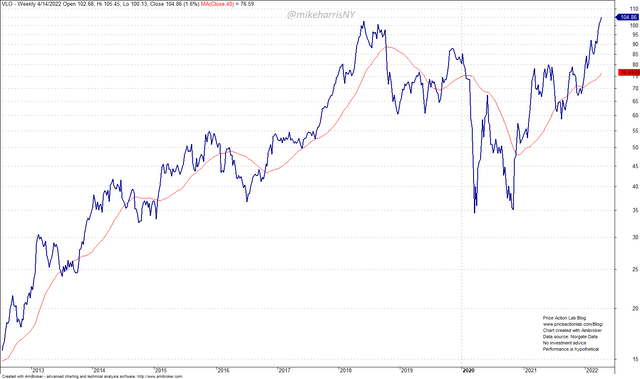
Valero Energy Corporation (VLO) is an international manufacturer and marketer of transportation fuels and petrochemical products. (Source: TD Ameritrade)
Momentum is strong with the price of the stock 38% above the 200-day moving average. The P/E TTM is 46.25, and the Q1 2022 earnings release date is April 26, 2022. The EPS estimate consensus is $1.63 vs. -$1.73 for the previous year’s Q1 actual.
Corteva, Inc (CTVA) YTD +29.4%
Weekly Chart of CTVA (Price Action Lab Blog – Norgate Data)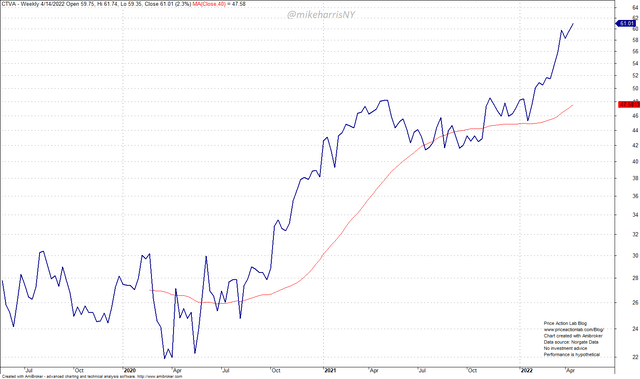
Corteva is a global provider of seed and crop protection solutions focused on the agriculture industry. (Source: TD Ameritrade)
Momentum is strong, with the price of the stock 29.7% above the 200-day moving average. The P/E TTM is 25.07, and the Q1 2022 earnings release date is May 5, 2022. The EPS estimate consensus is $0.82 vs. $0.79 for the previous year’s Q1 actual.
Harmony Bioscience Holdings Inc (HRMY) YTD +20.9%
Weekly Chart of HRMY (Price Action Lab Blog – Norgate Data)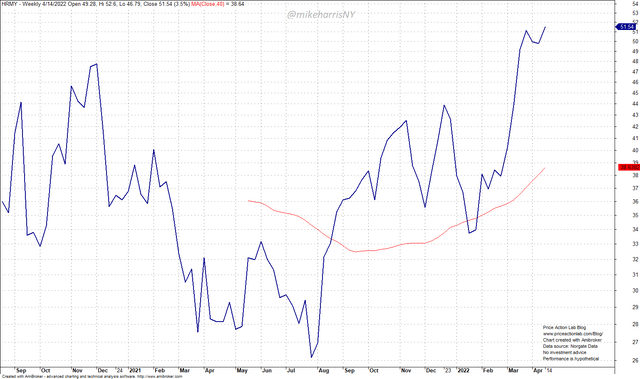
Harmony Biosciences Holdings, Inc. is a holding company. The Company through its subsidiary, Harmony Biosciences, LLC., operates as a pharmaceutical company, which is focused on therapies for patients suffering from central nervous system disorders. (Source: TD Ameritrade)
Cantor Fitzgerald initiated coverage on HRMY on April 14 with overweight rating and a price target of $63. Momentum is strong with the price of the stock 34.9%, above the 200-day moving average. The P/E TTM is 89.58, and the Q1 2022 earnings release date is May 9, 2022. The EPS estimate consensus is $0.315 vs. $0.13 for previous year’s Q1 actual.
DT Midstream Inc (DTM) YTD +20.6%
Weekly Chart of DTM (Price Action Lab Blog – Norgate Data)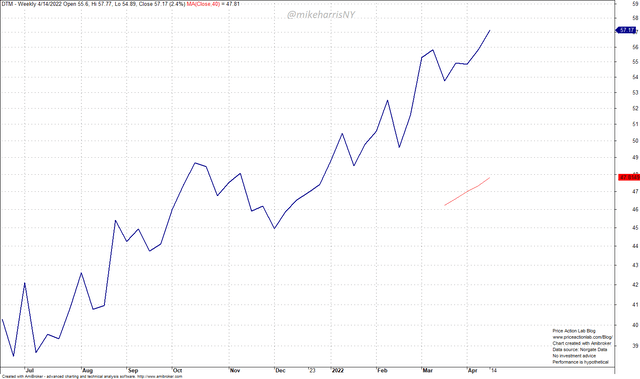
DT Midstream, Inc. is an owner, operator, and developer of an integrated portfolio of natural gas midstream assets. (Source: TD Ameritrade)
Momentum is strong with the price of the stock 21% above the 200-day moving average. The P/E TTM is 18.04.
KBR Inc (KBR) YTD +18.9%
Weekly Chart of KBR (Price Acton Lab Blog – Norgate Data)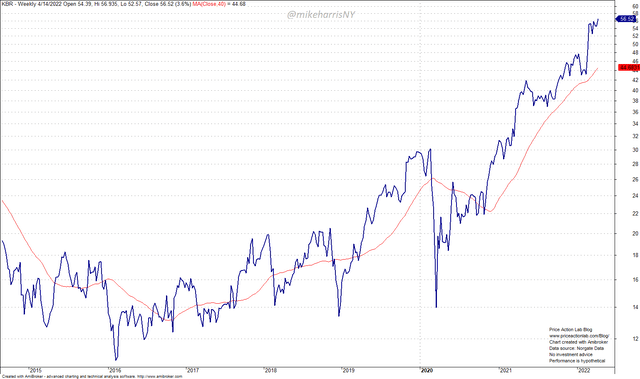
KBR, Inc. delivers science, technology and engineering solutions to governments and companies around the world. (Source: TD Ameritrade)
Momentum is strong, with the price of the stock 28% above the 200-day moving average. The P/E TTM is 929.45 and the Q1 2022 earnings release date is April 27, 2022. The EPS estimate consensus is $0.576 vs. $0.48 for the previous year’s Q1 actual.
Amgen Inc (AMGN) YTD +13.9%
Weekly Chart of AMGN (Price Action Lab Blog – Norgate Data)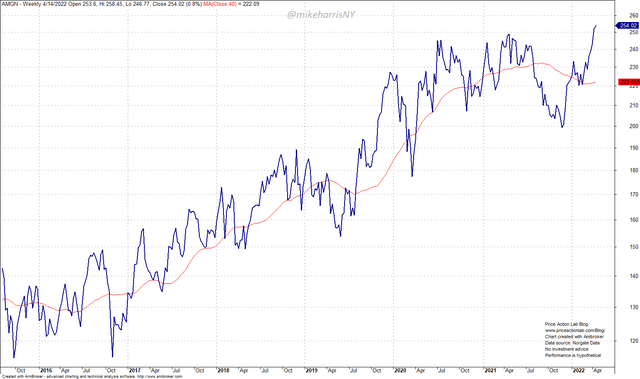
Amgen Inc. is a biotechnology company. The Company discovers, develops, manufactures and delivers various human therapeutics. It operates in human therapeutics segment. (Source: TD Ameritrade)
Momentum is rising, with the price of the stock 14.3% above the 200-day moving average. The P/E TTM is 24.64 and the Q1 2022 earnings release date is April 27, 2022. The EPS estimate consensus is $4.16 vs. $3.70 for the previous year’s Q1 actual.
National Fuel Gas Co (NFG) YTD +12.6%
Weekly Chart of NFG (Price Action Lab Blog – Norgate Data)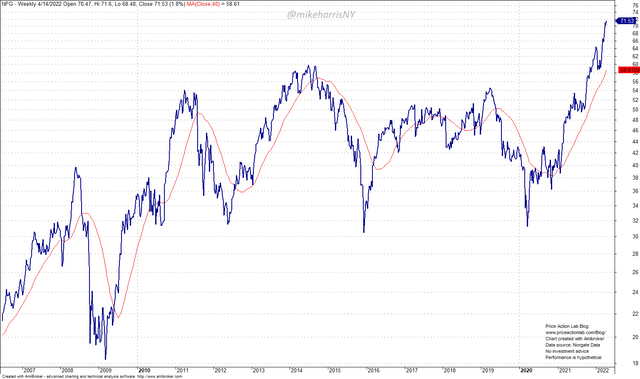
National Fuel Gas Company is a holding company. The company is an energy company engaged principally in the production, gathering, transportation, distribution, and marketing of natural gas. (Source: TD Ameritrade)
Momentum is strong, with the price of the stock 23.2% above the 200-day moving average. The P/E TTM is 15.70 and the Q2 2022 earnings release date is May 4, 2022. The EPS estimate consensus is $1.66 vs. $1.34 for the previous year’s Q2 actual.
Coca-Cola Co (KO) YTD +10.7%
Weekly Chart of KO (Price Action Lab Blog – Norgate Data)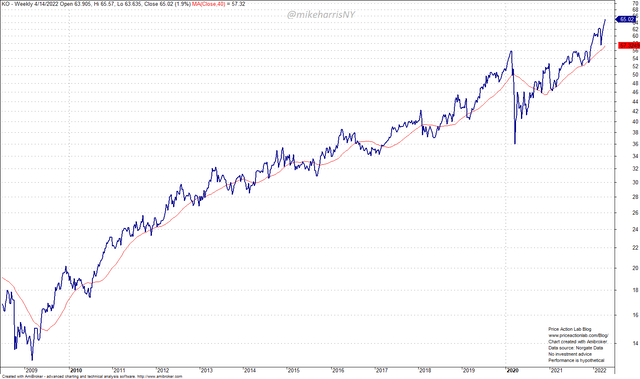
Momentum is rising, with the price of the stock 14.1% above the 200-day moving average. The P/E TTM is 28.88 and the Q1 2022 earnings release date is April 25, 2022. The EPS estimate consensus is $0.58 vs. $0.55 for the previous year’s Q1 actual.
Public Service Enterprise Group Inc (PEG) YTD +10%
Weekly Chart of PEG (Price Action Lab Blog – Norgate Data)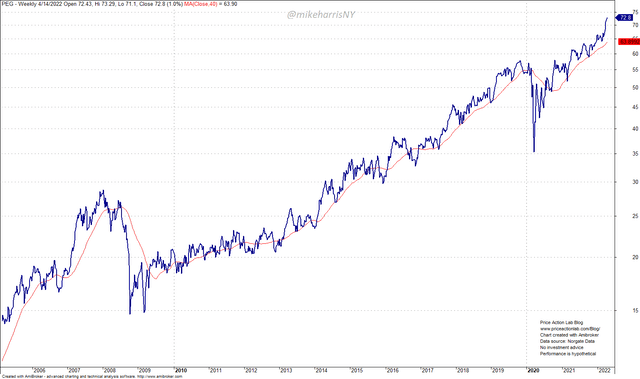
Public Service Enterprise Group Incorporated (PSEG) is a holding company. The Company is an energy company with operations located primarily in the Northeastern and Mid-Atlantic United States. (Source: TD Ameritrade)
Momentum is rising, with the price of the stock 14.6% above the 200-day moving average. The Q1 2022 earnings release date is May 3, 2022. The EPS estimate consensus is $1.11 vs. $1.28 for previous year’s Q2 actual.
General Mills Inc (GIS) YTD +6.8%
Weekly Chart of GIS (Price Action Lab Blog – Norgate Data)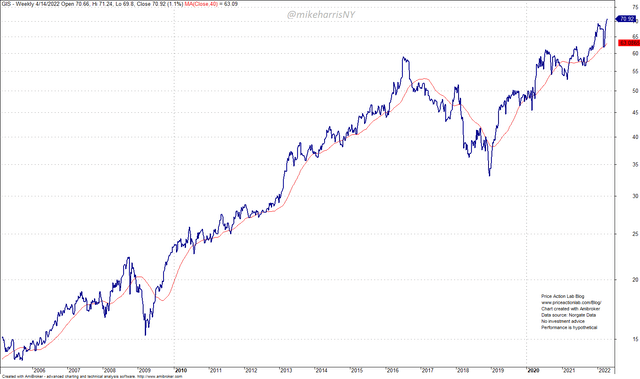
General Mills, Inc., is a manufacturer and marketer of branded consumer foods sold through retail stores. (Source: TD Ameritrade)
Momentum is rising, with the price of the stock 13.3% above the 200-day moving average. The P/E TTM is 18.93 and the Q4 2022 earnings release date is June 28, 2022. The EPS estimate consensus is $1.01 vs. $0.91 for previous year’s Q4 actual.
Saul Centers Inc (BFS) YTD +4.5%
Weekly Chart of BFS (Price Action lab Blog – Norgate Data)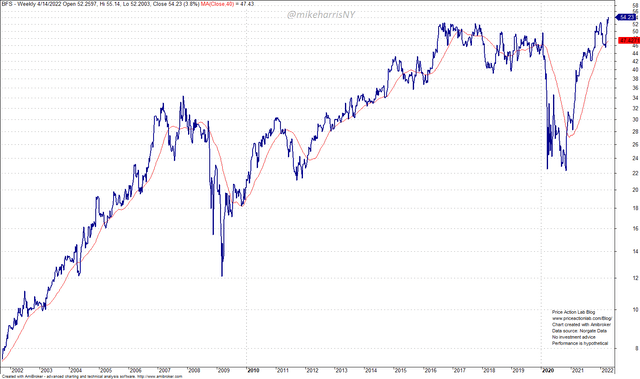
Saul Centers, Inc. is a real estate investment trust (“REIT”). (Source: TD Ameritrade)
Momentum is rising, with the price of the stock 15% above the 200-day moving average. The P/E TTM is 34.51 and the Q4 2022 earnings release date is May 4, 2022.
American Campus Communities (ACC) YTD +2.1%
Weekly Chart of ACC (Price Action Lab Blog – Norgate Data)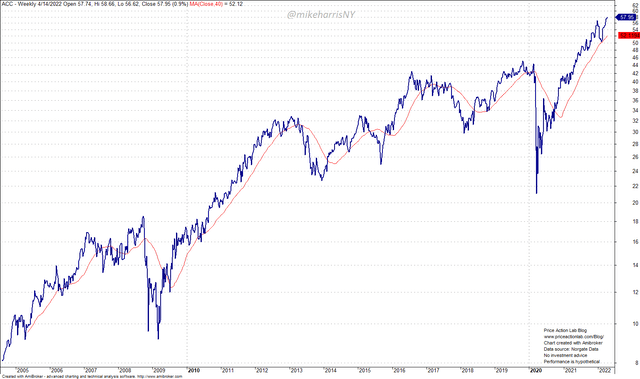
American Campus Communities, Inc. is a REIT. (Source: TD Ameritrade)
Momentum is rising, with the price of the stock 11.9% above the 200-day moving average. The P/E TTM is 253.70 and the Q1 2022 earnings release date is April 25, 2022. The EPS estimate consensus is $0.245 vs. $0.11 for the previous year’s Q1 actual.


Be the first to comment