

AscentXmedia/E+ via Getty Images
Interest rates are rising fast.
Daily Shot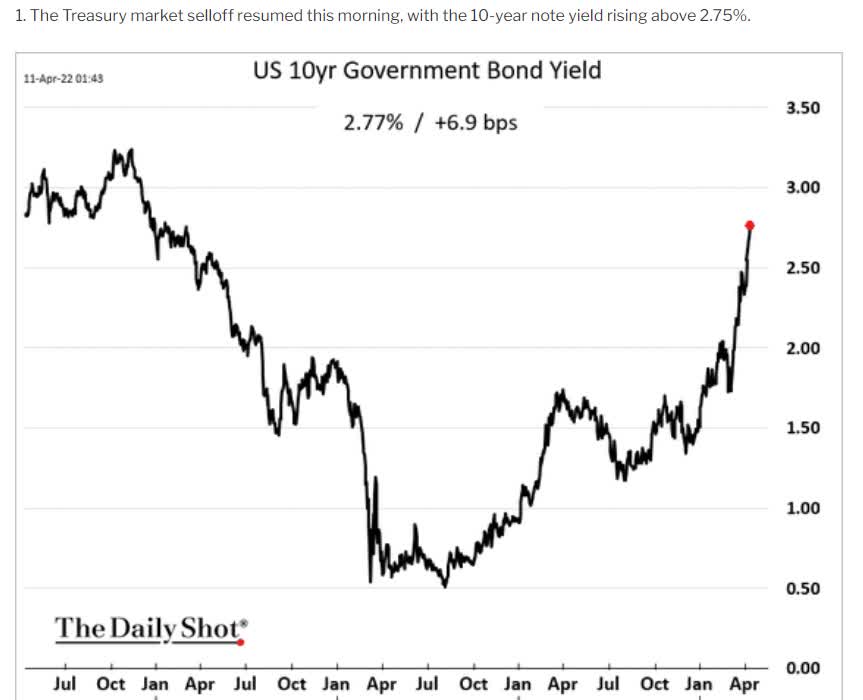
But they remain historically low, especially adjusted for inflation. How low?
JPMorgan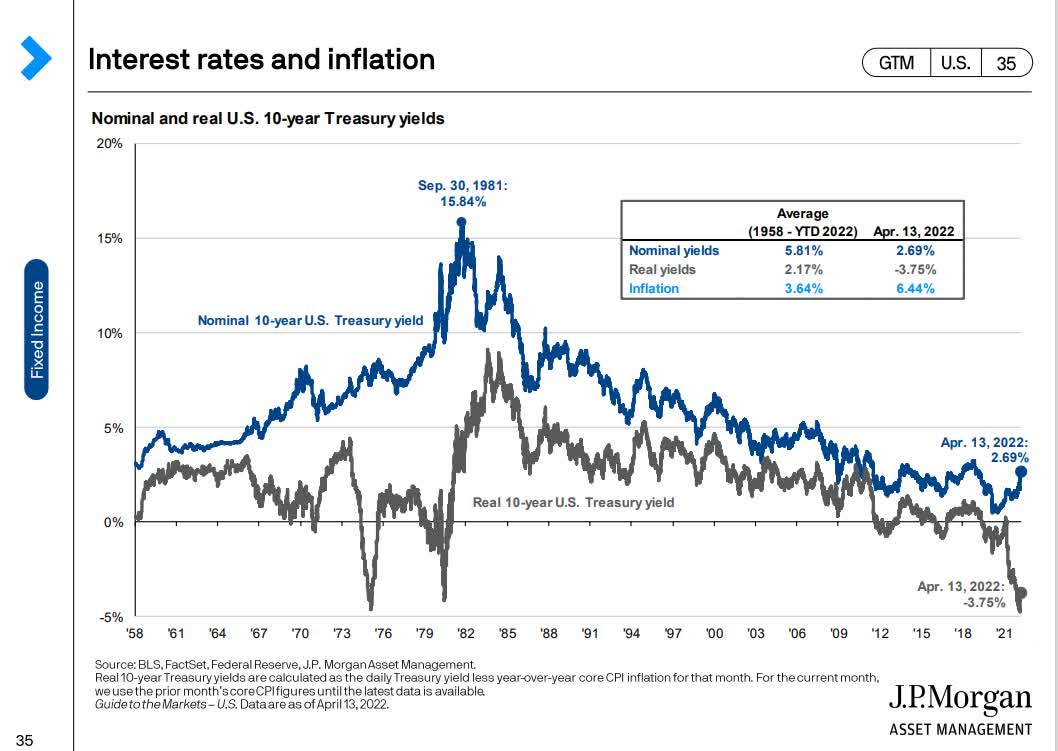
Since 1958 the average inflation-adjusted 10-year US treasury yield has been 2.2%.
Today it’s almost -4%.
Naturally rising rates but very low real yields on US treasuries has income investors looking out on the risk curve.
This includes rising demand for junk bonds (HYG), which now yield 4.4%.
I want to highlight how crazy this is.
- the average credit rating for this ETF is “B”
- meaning a 37% 30-year default risk
Now owning junk bonds isn’t itself dangerous or crazy, as part of a diversified and prudently risk-managed portfolio.
However, let me show you 10 incredible A-rated high-yield blue-chips that each yield more than junk bonds today.
- higher, safe yield
- that grows steadily over time
- and offers 3X the return potential of junk bonds
These are companies I personally own and trust in my retirement portfolio, and after this article, I think you’ll agree that there is no reason to buy trash yield when there are so many great A-rated retirement dream stock bargains available.
10 A-Rated High-Yield Retirement Dream Stock Bargains
(Source: DK Research Terminal)
- if you own these in a taxable account you can recoup the dividend withholding via a tax credit
- I’ve linked to articles for anyone looking for more information about each company
Why are these A-rated high-yield blue-chips better than junk bonds? Just take a look.
Fundamental Safety And Quality You Can Trust
| Company | Quality Rating (out Of 13) | Quality Score (Out Of 100) | Dividend/Balance Sheet Safety Rating (out of 5) | Safety Score (Out Of 100) | Dependability Rating (Out Of 5) | Dependability Score (out Of 100) |
| BASF SE | 10 | 76% | 4 | 74% | 4 | 75% |
| Legal & General Group | 12 | 84% | 5 | 83% | 5 | 90% |
| IBM | 12 | 85% | 5 | 87% | 5 | 85% |
| Simon Property Group | 10 | 64% | 4 | 63% | 3 | 64% |
| Philip Morris International | 13 | 90% | 5 | 91% | 5 | 89% |
| Manulife Financial | 12 | 88% | 5 | 91% | 5 | 85% |
| Allianz SE | 12 | 96% | 5 | 97% | 5 | 100% |
| Bank of Nova Scotia | 12 | 92% | 5 | 98% | 5 | 90% |
| Unilever | 12 | 78% | 4 | 75% | 5 | 83% |
| Munchener Ruckversicherungs-Gesellschaft Aktiengesellschaft | 12 | 82% | 5 | 85% | 5 | 82% |
| Average | 11.7 Super SWAN | 83.5% | 4.7 Very Safe | 84.4% | 4.7 Exceptional | 84.3% |
(Source: DK Research Terminal)
For context, the average aristocrat is
- 85% quality
- 12.2/13 Super SWAN quality
This means these 10 A-rated companies are nearly as high quality as the dividend aristocrats.
They offer some of the world’s highest safe yield. How safe?
| Rating | Dividend Kings Safety Score (161 Point Safety Model) | Approximate Dividend Cut Risk (Average Recession) |
Approximate Dividend Cut Risk In Pandemic Level Recession |
| 1 – unsafe | 0% to 20% | over 4% | 16+% |
| 2- below average | 21% to 40% | over 2% | 8% to 16% |
| 3 – average | 41% to 60% | 2% | 4% to 8% |
| 4 – safe | 61% to 80% | 1% | 2% to 4% |
| 5- very safe | 81% to 100% | 0.5% | 1% to 2% |
| 10 A-Rated High-Yield Blue-Chips | 84% | 0.50% | 1.90% |
| Risk Rating | Low-Risk (80th industry percentile risk-management consensus) | A Stable outlook credit rating 1.0% 30-year bankruptcy risk |
15% OR LESS Max Risk Cap Recommendation (Each Except for IBM) |
(Source: DK Research Terminal)
The average risk of a dividend cut during the average recession since WWII is about 1 in 200. During a Pandemic or Great Recession level downturn its about 1.9%.
| Company | Payout Ratio | Industry Safe Payout Ratio Guideline | Debt/Capital | Industry Safe Debt/Capital Guideline |
| BASF SE | 86% | 60% | 25% | 40% |
| Legal & General Group | 59% | 50% | 32% | 20% |
| IBM | 50% | 60% | 61% | 40% |
| Simon Property Group | 63% | 75% | 86% | 50% |
| Philip Morris International | 78% | 85% | 138% | 60% |
| Manulife Financial | 37% | 50% | 17% | 20% |
| Allianz SE | 51% | 50% | 22% | 20% |
| Bank of Nova Scotia | 49% | 50% | 17% | 50% |
| Unilever | 77% | 70% | 30% | 65% |
| Munchener Ruckversicherungs-Gesellschaft Aktiengesellschaft | 47% | 50% | 18% | 20% |
| Average | 59.7% | 60.0% | 44.6% | 38.5% |
(Source: DK Research Terminal)
These are very well-covered dividends and their balance sheets are much safer than they appear.
Elevated debt/capital is primarily a result of stock buybacks.
When a company buys back stock above book value, it reduces shareholder equity and pushes up debt/capital. Shares that are repurchased sit on the balance sheet as treasury stock which is primarily used for stock option compensation for employees. It’s treated as a liability. In fact, it’s an asset that can be sold to raise cash.
You can see this from the fact that companies like Philip Morris and IBM have been buying back lots of stock for decades. And yet they have strong credit ratings despite relatively high debt/capital ratios.
| Company | Long-Term Risk Management Consensus Industry Percentile | Risk-Rating | Risk-Management Rating | S&P Credit Rating | Credit Rating Outlook | 30-Year Bankruptcy Risk |
| BASF SE | 70% | Low | Good | A | Stable | 0.66% |
| Legal & General Group | 84% | Low | Very Good | A | Stable | 0.66% |
| IBM | 87% | Medium | Very Good | A- | Stable | 2.50% |
| Simon Property Group | 49% | Medium | Average | A- | Stable | 2.50% |
| Philip Morris International | 77% | Low | Good | A | Stable | 0.66% |
| Manulife Financial | 84% | Low | Very Good | A | Stable | 0.66% |
| Allianz SE | 87% | Low | Very Good | AA | Stable | 0.55% |
| Bank of Nova Scotia | 89% | Low | Very Good | A+ | Stable | 0.60% |
| Unilever | 93% | Low | Exceptional | A+ | Stable | 0.60% |
| Munchener Ruckversicherungs-Gesellschaft Aktiengesellschaft | 75% | Low | Good | AA- | Stable | 0.55% |
| Average | 80% | Low | Very Good | A | Stable | 1.0% |
(Source: DK Research Terminal)
S&P estimates the average risk of any of these companies going bankrupt over the next 30 years at 1%.
- the average aristocrat has an A- stable credit rating with 2.5% fundamental risk
Six rating agencies estimate that these blue-chips have long-term risk management in the top 20% of their peers, meaning very good risk management.
How does that compare to other blue-chips?
| Classification | Average Consensus LT Risk-Management Industry Percentile |
Risk-Management Rating |
| S&P Global (SPGI) #1 Risk Management In The Master List | 94 | Exceptional |
| 10 A-Rated High-Yield Blue-Chips | 80 | Very Good |
| Strong ESG Stocks | 78 |
Good – Bordering On Very Good |
| Foreign Dividend Stocks | 75 | Good |
| Ultra SWANs | 71 | Good |
| Low Volatility Stocks | 68 | Above-Average |
| Dividend Aristocrats | 67 | Above-Average |
| Dividend Kings | 63 | Above-Average |
| Safe Midstream | 62 | Above-Average |
| Master List average | 62 | Above-Average |
| Hyper-Growth stocks | 61 | Above-Average |
| Monthly Dividend Stocks | 60 | Above-Average |
| Dividend Champions | 57 | Average, Bordering On Above-Average |
(Source: DK Research Terminal)
But rating agencies are hardly the only ones that say these blue-chips are among the world’s safest and highest quality companies.
| Company | Dividend Growth Streak (Years) | ROC (Greenblatt) | ROC Industry Percentile | 13-Year Median ROC |
| BASF SE | 1.0 | 16.0% | 66.0% | 18.5% |
| Legal & General Group | 10.0 | NA | NA | NA |
| IBM | 26.0 | 47.0% | 64.0% | 134.4% |
| Simon Property Group | 1.0 | NA | NA | NA |
| Philip Morris International | 52.0 | 198.0% | 83.0% | 169.7% |
| Manulife Financial | 9.0 | NA | NA | NA |
| Allianz SE | 2.0 | NA | NA | NA |
| Bank of Nova Scotia | 0.0 | NA | NA | NA |
| Unilever | 6.0 | 86.7% | 94.0% | 79.7% |
| Munchener Ruckversicherungs-Gesellschaft Aktiengesellschaft | 1.0 | NA | NA | NA |
| Average | 10.8 | 86.9% | 76.8% | 100.6% |
(Source: DK Research Terminal)
Many of these financial companies froze their dividends during the pandemic, which is why their average dividend growth streak is just 11 years.
However, none cut and each has a progressive dividend policy.
Progressive dividend policy = dividends track earnings over time
If earnings fall, the dividend doesn’t get cut.
Basically, a dividend ratchet where dividends only go up or stay flat if a given year’s results are especially weak.
Return on capital is pre-tax profit/operating capital (the money it takes to run the business).
- Joel Greenblatt’s gold standard proxy for quality and moatiness
The S&P 500’s 2021 ROC was 14.6%.
- On average, it takes the typical S&P company about 7 years to recoup investments they make
The average return on capital for these Super SWANs is 87%.
- Average investment recouped in 14 months
- 13x higher quality than the average S&P 500 company according to one of the greatest investors in history
These A-rated blue-chips’ ROC is in the top 20% of their industries, confirming a wide moat.
ROC is relatively stable over the last 13-years confirming a relatively stable moat.
OK, so now you know why you can trust these A-rated high-yield blue-chips, but here’s why it’s potentially a good idea to buy them today.
Wonderful Companies At Fair Prices
| Company | Discount To Fair Value | PE/EBITDA/FFO 2021 | Earnings Yield 2021 | 13-Year Median ROC | 12-Month Consensus Total Return Potential | 12-Month Fundamentally Justified Upside Total Return Potential |
| BASF SE | 38.4% | 9.1 | 11.0% | 18.5% | 44.4% | 69.3% |
| Legal & General Group | 16.2% | 8.3 | 12.1% | NA | 25.2% | 25.9% |
| IBM | 9.1% | 12.9 | 7.8% | 134.4% | 20.9% | 15.3% |
| Simon Property Group | 17.3% | 11.0 | 9.1% | NA | 39.5% | 26.1% |
| Philip Morris International | 4.2% | 17.0 | 5.9% | 169.7% | 12.2% | 9.4% |
| Manulife Financial | 21.9% | 7.7 | 13.0% | NA | 22.0% | 32.9% |
| Allianz SE | 10.9% | 9.8 | 10.2% | NA | 18.5% | 17.2% |
| Bank of Nova Scotia | 8.6% | 10.0 | 10.0% | NA | 19.0% | 14.1% |
| Unilever | 22.8% | 16.5 | 6.1% | 79.7% | 21.4% | 34.2% |
| Munchener Ruckversicherungs-Gesellschaft Aktiengesellschaft | 15.6% | 9.8 | 10.2% | NA | 26.7% | 23.2% |
| Average | 16.5% | 11.2 | 9.5% | 100.6% | 25.0% | 26.8% |
(Source: DK Research Terminal)
These A-rated Super SWANs average an 11.2 PE.
- the last time the S&P 500 traded at 11.2 PE was March…2009…during the darkest days of the Great Recession
The S&P 500 is historically 12% overvalued, while these Super SWANs are 17% undervalued.
- a potentially good buy for anyone comfortable with their risk profile
Analysts expect 25% total returns in the next year and 27% total returns are justified by fundamentals.
And here’s why these companies might be worth owning for the long-term.
Long-Term Return Fundamentals That Can Help You Retire In Safety And Splendor
| Company | Yield | FactSet Long-Term Consensus Growth Rate | LT Consensus Total Return Potential | LT Risk-Adjusted Expected Return |
| BASF SE | 7.0% | 6.0% | 13.0% | 9.1% |
| Legal & General Group | 6.7% | 5.2% | 11.9% | 8.3% |
| IBM | 5.2% | 7.2% | 12.4% | 8.7% |
| Simon Property Group | 5.1% | 8.6% | 13.7% | 9.6% |
| Philip Morris International | 4.9% | 5.9% | 10.8% | 7.6% |
| Manulife Financial | 4.8% | 11.0% | 15.8% | 11.1% |
| Allianz SE | 4.9% | 6.0% | 10.9% | 7.6% |
| Bank of Nova Scotia | 4.7% | 6.1% | 10.8% | 7.5% |
| Unilever | 4.6% | 6.3% | 10.9% | 7.7% |
| Munchener Ruckversicherungs-Gesellschaft Aktiengesellschaft | 4.6% | 10.2% | 14.8% | 10.4% |
| Average | 5.3% | 7.3% | 12.6% | 8.8% |
(Source: DK Research Terminal)
These A-rated blue-chips yield almost 1% more than junk bonds!
- 0.9% higher yield
- with 37X less fundamental risk according to S&P
Analysts expect 7.3% long-term growth that could deliver 12.5% long-term total returns.
How impressive is that?
| Investment Strategy | Yield | LT Consensus Growth | LT Consensus Total Return Potential | Long-Term Risk-Adjusted Expected Return | Long-Term Inflation And Risk-Adjusted Expected Returns | Years To Double Your Inflation & Risk-Adjusted Wealth |
10 Year Inflation And Risk-Adjusted Return |
| 10 A-Rated High-Yield Blue-Chips | 5.3% | 7.3% | 12.6% | 8.8% | 6.3% | 11.4 | 1.85 |
| Safe Midstream | 5.2% | 6.0% | 11.2% | 7.8% | 5.3% | 13.5 | 1.68 |
| Adam’s Planned Correction Buys | 3.9% | 18.9% | 22.8% | 16.0% | 13.5% | 5.3 | 3.54 |
| Junk Bonds | 4.4% | 0.0% | 4.4% | 3.1% | 0.6% | 122.0 | 1.06 |
| High-Yield | 2.8% | 10.3% | 13.1% | 9.2% | 6.7% | 10.8 | 1.91 |
(Source: DK Research Terminal, Morningstar, FactSet, Ycharts)
Junk bonds are likely to deliver about 4.4% long-term returns, while these A-rated blue-chips are expected to deliver 1% higher yield today, a lot more income over time, and 3X the long-term returns.
Inflation-Adjusted Consensus Total Return Potential: $1,000 Initial Investment
| Time Frame (Years) | 7.4% CAGR Inflation-Adjusted S&P Consensus | 8.6% Inflation-Adjusted Aristocrat Consensus | 10.1% CAGR Inflation-Adjusted 10 A-Rated Blue-Chips Consensus | Difference Between Inflation Adjusted LGGNY Consensus And S&P Consensus |
| 5 | $1,429.63 | $1,511.29 | $1,618.58 | $107.28 |
| 10 | $2,043.84 | $2,284.01 | $2,619.80 | $335.79 |
| 15 | $2,921.94 | $3,451.81 | $4,240.35 | $788.53 |
| 20 | $4,177.29 | $5,216.70 | $6,863.34 | $1,646.63 |
| 25 | $5,971.97 | $7,883.98 | $11,108.85 | $3,224.87 |
| 30 | $8,537.71 | $11,915.01 | $17,980.55 | $6,065.54 |
(Source: DK Research Terminal, FactSet)
Analysts think these A-rated blue-chips could potentially deliver 18X inflation-adjusted returns over the next 30 years.
| Time Frame (Years) | Ratio Aristocrats/S&P | Ratio Inflation-Adjusted UGI Consensus And S&P Consensus |
| 5 | 1.06 | 1.18 |
| 10 | 1.12 | 1.39 |
| 15 | 1.18 | 1.64 |
| 20 | 1.25 | 1.93 |
| 25 | 1.32 | 2.28 |
| 30 | 1.40 | 2.69 |
(Source: DK Research Terminal, FactSet)
As well as potentially almost double the aristocrats and nearly triple the returns of the S&P 500.
What proof is there that this A-rated blue-chip portfolio can actually deliver 12% to 13% long-term returns?
Historical Returns Since 1996 (Annual Rebalancing)
The future doesn’t repeat, but it often rhymes.” – Mark Twain
Past performance is no guarantee of future results, but studies show that blue-chips with relatively stable fundamentals over time offer predictable returns based on yield, growth, and valuation mean reversion.
Bank of America So let’s take a look at how these A-rated have performed over the last 26 years when over 91% of total returns were the result of fundamentals, not luck.
- annualized returns since 1996: 12.3% CAGR vs 9.7% S&P 500
- vs 12.6% CAGR analyst consensus
- 21X total return vs 11.3X for S&P 500
- 11.2X inflation-adjusted returns vs 6.1X S&P 500
- 15.5% annual volatility vs 15.2% S&P 500 (with 10X fewer companies)
- 45% peak decline in Great Recession vs 51% S&P (despite being heavy in financials)
- 30% higher negative-volatility-adjusted total returns (Sortino ratio)
And let’s not forget about income.
| Portfolio | 1996 Income Per $1,000 Investment | 2021 Income Per $1,000 Investment | Annual Income Growth | Starting Yield | 2021 Yield On Cost |
| 10 A-Rated High-Yield Blue-Chips | $46 | $982 | 12.5% | 4.6% | 98.2% |
(Source: Portfolio Visualizer Premium)
Over the last 26 years, these A-rated blue-chips delivered 12.5% annual income growth, turning a 4.6% starting yield into a nearly 100% yield on cost today.
What about the potential for dividend growth in the future?
| Analyst Consensus Income Growth Forecast | Risk-Adjusted Expected Income Growth | Risk And Tax-Adjusted Expected Income Growth |
Risk, Inflation, And Tax Adjusted Income Growth Consensus |
| 12.8% | 9.0% | 7.6% | 5.1% |
(Source: DK Research Terminal, FactSet)
Analysts expect similar income growth in the future, about 13%.
Which adjusted for the risk of these companies not growing as expected, inflation, and taxes, is about 5% income growth.
Now compare that to what they expect from the S&P 500.
| Time Frame | S&P Inflation-Adjusted Dividend Growth | S&P Inflation-Adjusted Earnings Growth |
| 1871-2021 | 1.6% | 2.1% |
| 1945-2021 | 2.4% | 3.5% |
| 1981-2021 (Modern Falling Rate Era) | 2.8% | 3.8% |
| 2008-2021 (Modern Low Rate Era) | 3.5% | 6.2% |
| FactSet Future Consensus | 2.0% | 5.2% |
(Sources: S&P, FactSet, Multipl.com)
What about a 60/40 retirement portfolio?
- 0.5% consensus inflation, risk, and tax-adjusted income growth.
In other words, these 10 A-rated high-yield blue-chips offer
- 3.5X the market’s yield
- 2.5X its long-term inflation-adjusted consensus income growth potential
- 10.5X better long-term inflation-adjusted income growth than a 60/40 retirement portfolio
- infinitely better income growth than junk bonds (zero)
Bottom Line: Why Buy Trash Yield When A-Rated High-Yield Blue-Chip Bargains Are Available?
No stocks, no matter how safe, are a true bond alternative, or I should say, a risk-free bond alternative.
JPMorgan Asset Management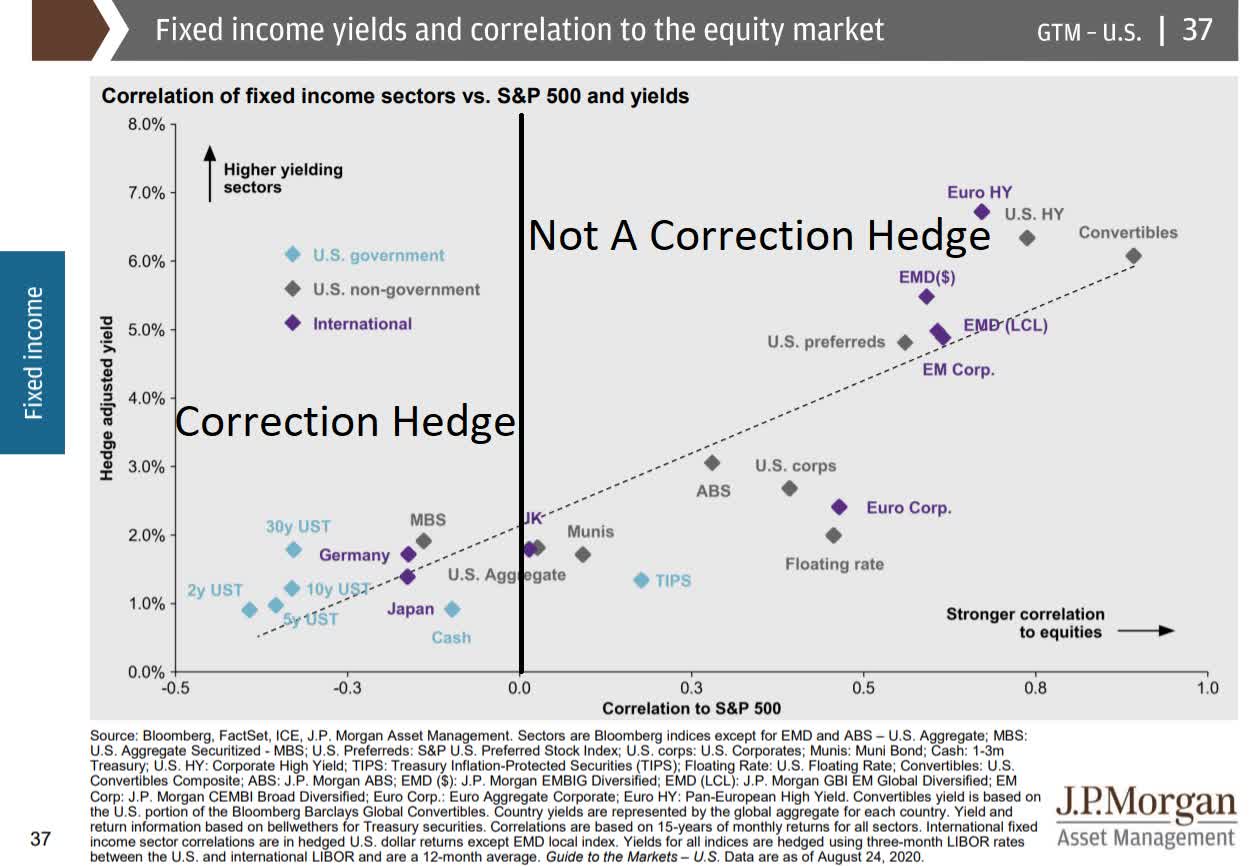
Risk-free sovereign debt doesn’t always go up when stocks fall.
- but it does stay flat or go up 92% of the time when stocks fall since WWII
That’s because risk-free Treasuries are negatively correlated to stocks and that’s why they still have a useful role in most people’s diversified and prudently risk-managed portfolios.
- cash is what you use to pay bills or buy stocks when both stocks and bonds fall (like now)
- in a recessionary bear market bonds appreciate and can be sold to pay expenses or buy blue-chip bargains instead of selling stocks
Junk bonds on the other hand? They are about 80% correlated to stocks, meaning if the S&P 500 falls 36% during a recession (the historical average since 1967) junk bonds can be expected to fall 25% to 30%.
- junk bonds are all about income, not hedging your portfolio in a recession
So why buy 4.4% yielding junk bonds which have 37% fundamental risk according to S&P, when you can buy A-rated high-yield blue-chips like: BASFY, LGGNY, IBM, SPG, PM, ALIZY, UL, MURGY, MFC, and BNS?
- 5.3% yield (almost 1% more)
- 7.3% CAGR long-term growth potential vs 0% for junk bonds
- 37X lower default risk than junk bonds according to S&P
- 12.6% long-term total return potential (almost 3X more than junk bonds)
- 12.5% CAGR historical returns since 1996
In fact, with the right low-cost ETFs, you can turn these 10 A-rated high-yield retirement dream blue-chips into a Zen Ultra SWAN retirement portfolio that can potentially help the typical retired couple
- generate an extra $2.2 million in inflation-adjusted retirement income over 30 years compared to a 60/40 retirement portfolio
- deliver $3.7 million more inflation-adjusted wealth over 30 years than a 60/40 retirement portfolio
- turn $555,000 in median retirement savings into almost $6 million inflation-adjusted wealth after 30 years more than a 60/40 retirement portfolio
Building the right diversified and prudently risk-managed portfolio is how you can stop praying for luck on Wall Street and can start making your own.
It’s how you can stop obsessing over the Fed, inflation, the war, and the market’s daily wild swings.
When you focus on safety and quality first, and prudent valuation and sound risk-management always, you take charge of your financial destiny.
It’s also how you maximize the chances of not just retiring rich, but staying rich, and even growing exponentially richer, in retirement.
Be the first to comment