

Sundry Photography
The recent rally in XPO, Inc. (NYSE:XPO) started at the beginning of November, straight after the spinoff was announced. XPO spun off the freight broker business (RXO) and the market seemed to favor the move, share price has risen by 15.30% since November 1, 2022.
I see this stock has 4 factors that may indicate the tides are turning, and it should trend higher:
-
Earnings growth has been positively strong since XPO placed losses in 2012 and 2013.
-
Growing Less-Than-Truckload market
-
The company is highly undervalued compared to its peers.
-
And price momentum over the past 2 months has been strong.
Let’s have a look at XPO in a bit more detail. I’ll break things down into industry trend, XPO fundamentals, and technicals.
Industry Trend
According to Technavio, the Less-Than-Truckload (LTL) market is forecast to experience a CAGR of 5.11% from 2021 to 2025. They see the market value of LTL rising to $59.55 billion by 2025. In particular, they see the US market for LTL as having grown by 8.15% CAGR.
So, it would be interesting to see if the US is one of the higher-growth geographical areas for 2021-2025. What you do get from the free info is that APAC will be the largest growing market for LTL. In my opinion, XPO Logistics is in a position to fully take advantage of that growth.
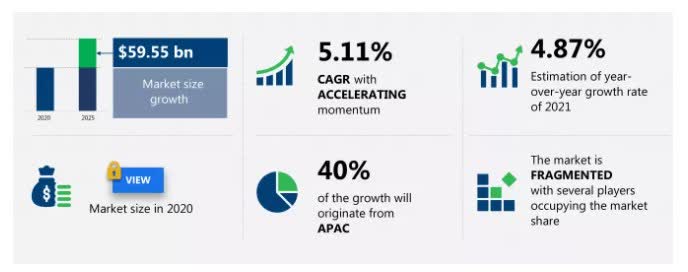
LTL Market Forecast (Technavio)
Of the APAC countries, China will be the main area for growth. And XPO has a strong presence in China, already back when it was still in the freight business. I also believe that eCommerce is something that is here to stay and will further fuel the LTL market growth.
China is also slowly normalizing the restrictions put in place due to the COVID pandemic. As the situation hopefully continues to normalize, XPO should see income from its division in China bring in revenue and more profits.
XPO Fundamentals
XPO has experienced some decent growth since earnings dipped in 2019 and 2020. The company has particularly shown an impressive rate of growth since 2012 and 2013 when it posted losses. EBITDA has gone from a loss of $31.5 million to profits of $1,240 million in 2021. Earnings for the TTM are at $1,404 indicating that the positive trend is continuing.
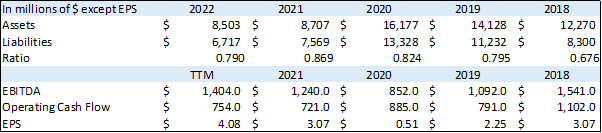
Seeking Alpha
PS has also continued to grow, going from a negative $1.95 per share to the highest on record since 2012 of $4.06 per share. The previous high to that was in 2018 and 2021 at $3.07 per share. The cash flow shows the company has a healthy cushion that allows it a long runway in the case of adverse events.
The liabilities to assets ratio is slightly on the high side in absolute terms at 0.79 although it seems the ratio is going lower since 2020. However, when compared to its direct peers we such as Hertz Global Holdings which has a ratio of 0.87, and Ryder System with a ratio of 0.79, we see XPO is competitive in relative terms.
Quant Rating
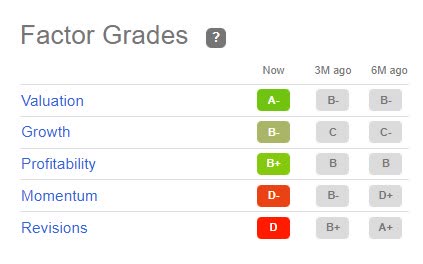
The Quant rating for XPO is 2.15 which equals a Sell rating. The sell rating is triggered by low scores on two factors: Momentum and Revisions.
Seeking Alpha
The Momentum score of D- is explained by the fact that the Quant system looks at price performance from 3 months upwards. Basically, the Quant system hasn’t caught on to the recent price increase. I imagine once we reach February, the Momentum grade will also factor in the sharp rise in the stock price from November 1, 2022.
The other factor, Revisions, is harder to contest, the grade shows that EPS consensus sees falling earnings per share from H2 2023 until it picks up again in Q1 2024. I say harder to contest because the many analysts forecasting earnings collectively agree on decreasing income until 2026.
Looking at the Valuation factor from the Quant system, we see why XPO gets an A-. The P/E TTM ratio is at 4.91, which is low in absolute terms and 74.98% lower than the sector average. Enterprise value to EBITDA TTM is also low at 5.36 or 57.37% lower than average.
More interestingly, the price to earnings growth ratio TTM is at a very low 0.02 or 95.38% lower than the sector average. Might this ratio explain that the analyst consensus priced into the market is extremely low?
XPO Technicals
The long-term trend using the Ichimoku system shows we are currently in a bullish environment. The monthly chart below shows price action above the cloud since October 2010. The only element out of line is the fast moving average (blue line) which is below the slow moving average (crimson line).
However, the bullish trend is intact, as the market tested the cloud back in March 2022 but failed to break to the downside. The support from the cloud was also tested in September 2022 and failed again.
We then see that November 2022 created a gap in price for the candle bodies, and the market has failed to retrace to that level for now, as far as the candle bodies go. The last 3 candles are forming a small triangle, and a break of that shape will determine the next move.
As the last trend before the triangle formed was up, I would predict further upward price action.
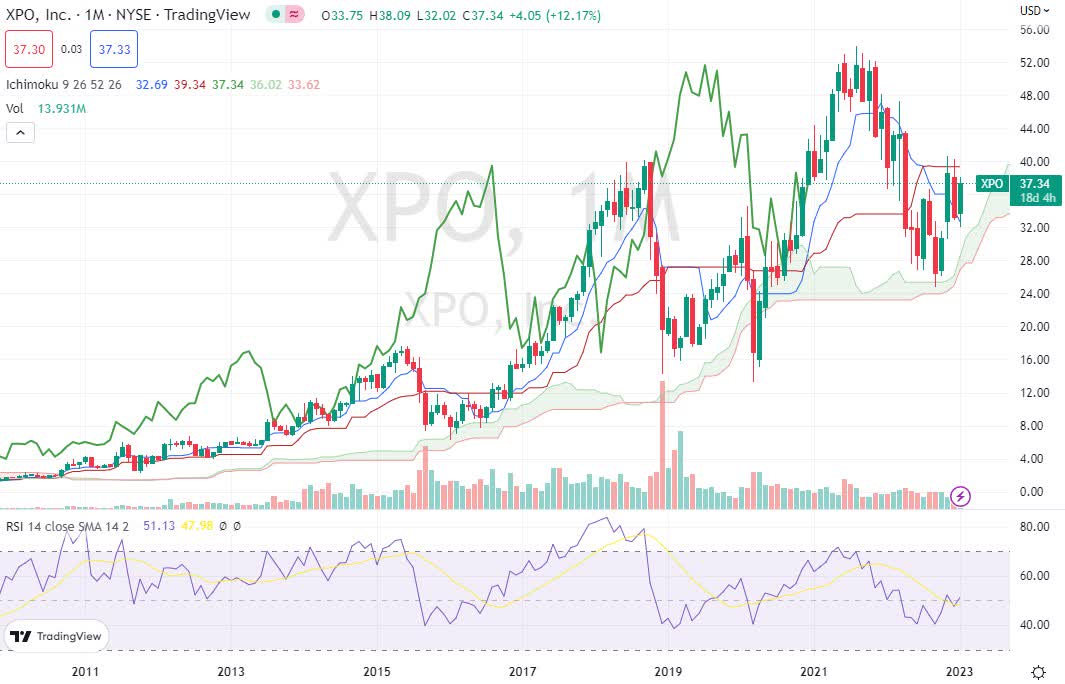
XPO Monthly Chart (TradingView)
The weekly chart shows a mixed picture of the current trend. We can see the break of the bear trend in the first week of November. Price action has since declined slightly, forming a downward-sloping pennant.
Downward-sloping pennants usually indicate that more bullish momentum is to come once the market breaks the pattern. The current week is about to close at the time of writing, and should the market maintain this level, we can say the break has been made.
However, price action is still inside the Ichimoku cloud, a kind of no man’s land. So, things can get tricky, and the next resistance level would be at the top side of the cloud at $40.58. This level has already been tested on two occasions, a break above would indicate further upside momentum. With the next resistance at $46.04.
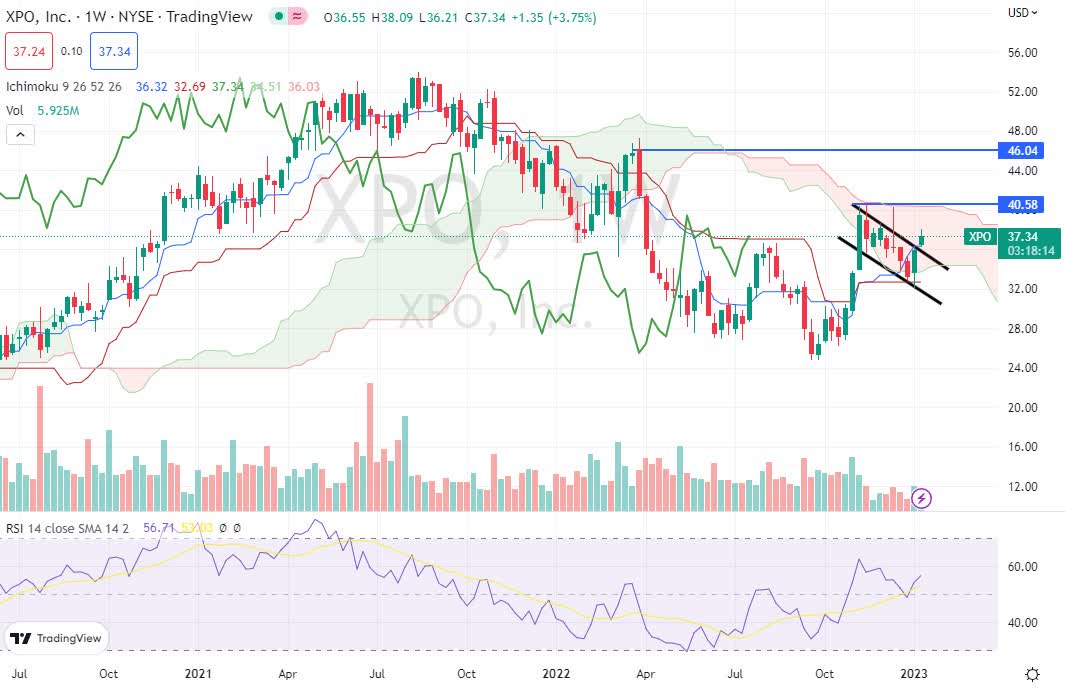
XPO Weekly Chart (TradingView)
Conclusion
I can see why the Quant system has its rating at Sell. The earnings forecasts are dire, and momentum has been a drag on the stock price over the past year. However, I see the recent rally as an indication of further upward momentum.
I also believe that XPO is well positioned with its global presence to take advantage of the ever-growing eCommerce sector. China is also beginning to normalize life again and hopefully, there will be no further restrictions, or at least not to the extent seen previously.
Considering my projection for growth in the LTL market, growth of the company, and sector appropriate multiple of enterprise value, I see the long-term price target for XPO at $53 to $55.
Be the first to comment