

gorodenkoff/iStock via Getty Images
[Please note that this article was first published on May 31st for subscribers of Macro Trading Factory (“MTF”), as part of our weekly macro/market review.
As such, whenever there’s a reference to time, the pivot date is May 31st, although upon checking the content of this article – not much has changed aside of valuations. Therefore, even if the exact figures have changed – the investment thesis hasn’t.]
Half of Our Four Building Blocks are Distressed
If you look at our Funds Macro Portfolio (“FMP”) – surely if you follow our writing – there are four building blocks when it comes to the long side:
- Energy
- Materials (Commodities/Miners/Precious Metals/Agriculture)
- China
- Healthcare/Biotech
We’ve already grinded to dust all four building blocks, but if there’s one of those we haven’t touched upon as much as the others (lately) it’s the fourth one.
In this piece (while it’s a usual weekly macro review) we wish to focus on that fourth building block, especially since this together with China are the two more promising opportunities right now if we look over the next 5 (rather 1-2) years.
This isn’t to say that Energy and/or Materials are less interesting, rather that while Commodities-related sectors have already gone up a lot, the two other building blocks are still very much distressed, therefore likely offering a larger upside potential.
Side note: In-spite of half of our four building blocks trading in “distressed” territory, we wish to remind you that the FMP is up 3.14% YTD, outperforming SPY by nearly 21% (at the end of June 10th), while taking (significantly) lower risk.
Macro Trading Factory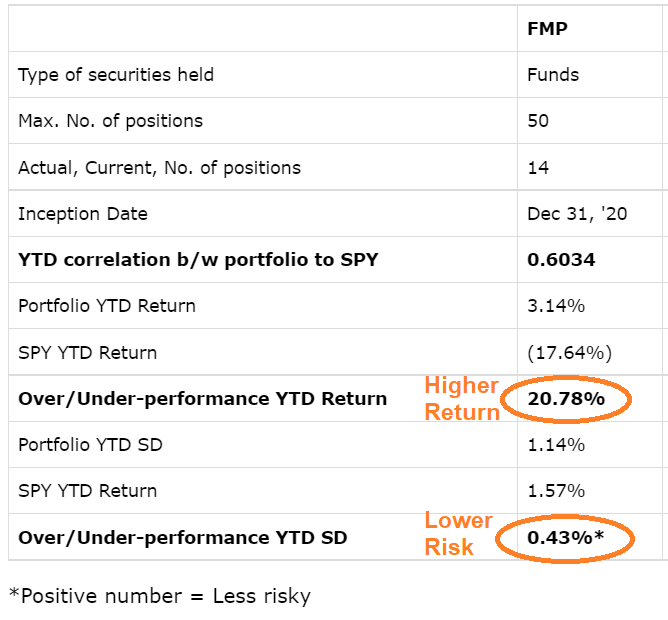
As we already mentioned several times, another pillar we’re looking to add (when the time comes) is bonds.
Although spreads widened in April relative to trailing 3-month levels, all but BBB-rated spreads are still lower than their 20-year averages.
Naturally, differences (in spreads) are smaller for IG- vs HY- rated bonds.
Bloomberg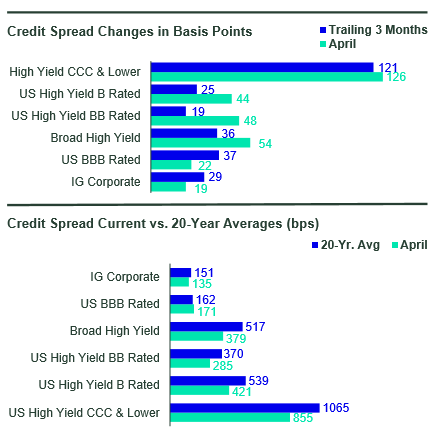
The time (for bonds) hasn’t come yet, but it will.
Consumption Destruction Ahead
According to the AAA motoring club data, US retail gasoline average price hits a fresh record high of $4.622/gallon.
The number of States where retail gasoline costs more than $5/gallon is now seven, with Illinois joining the West Coast pack (WA, OR, CA, NV, AK, HI).
In Los Angeles, the price of gasoline has hit $8 per gallon.
This is a “guaranteed recipe” to successfully destroy consumption.
If such high prices spread out, US consumer sentiment is likely to reach unprecedented low levels.
It seems as if consumers haven’t yet fully digested how high gasoline prices are. Once they do, sentiment (black line) – currently reflecting an expected average gasoline price of “only” ~$6 throughout summer – will sink way below the expansion (50) threshold.
True Insights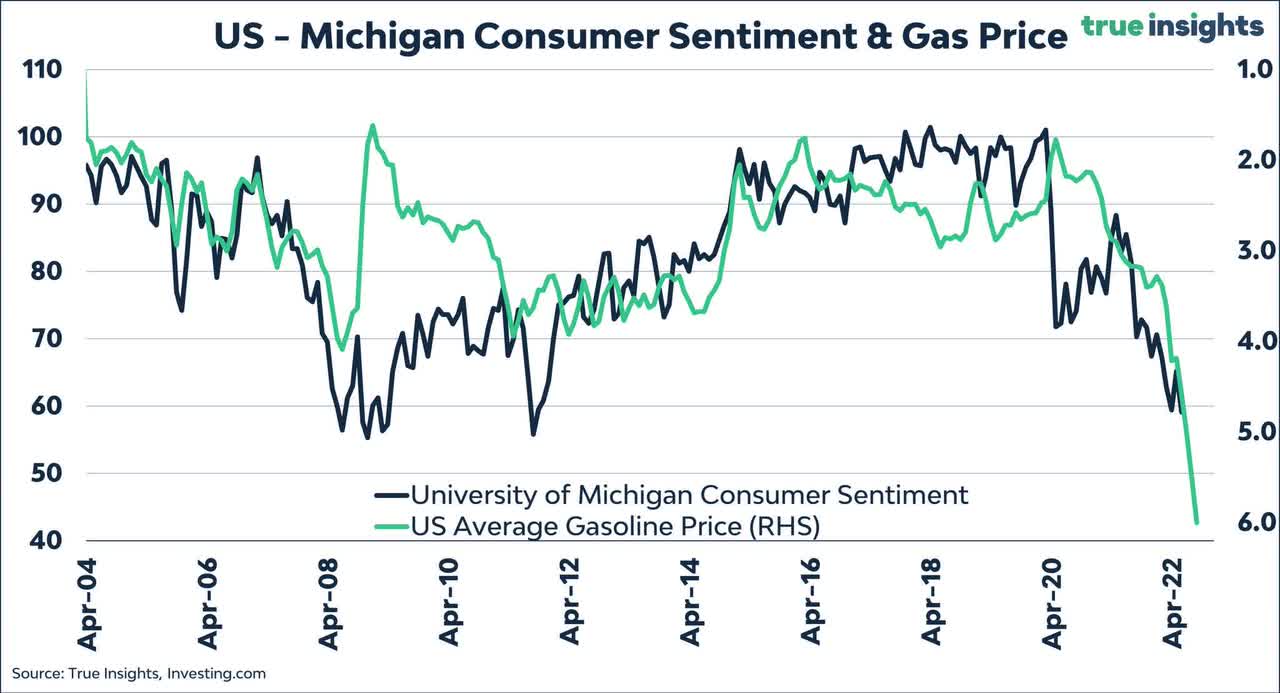
Once again, oil prices are closing on the multi-year highs.
Bloomberg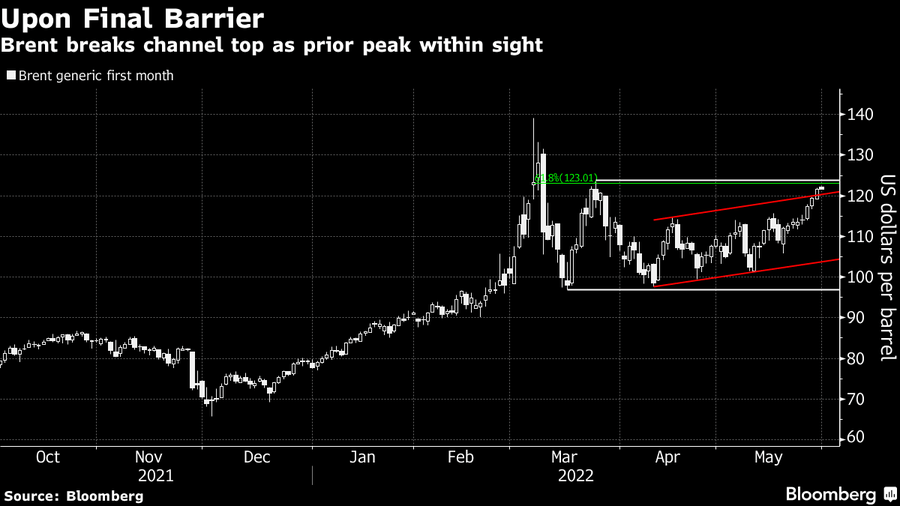
Another important aspect to keep in mind is inventories and reserves.
OECD oil inventories are now close to record lows as a percentage of demand. With China only starting to reopen following recent strict COVID lockdowns, one can only imagine what could happen to oil prices when China is fully back on track?
Various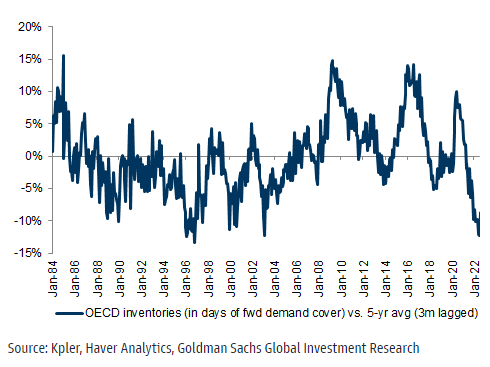
…as well as to inflation?
Nordea
This implies a serious tail risk ahead for oil that’s only starting to be priced in. With production remaining fairly flat (and OPEC doesn’t show signs of willingness to increase output), the only “solution” to this might be the consumption destruction we mentioned above.
In more simple words, the ultimate (perhaps only) way to lower energy prices is to ensure we are going through a… recession [and no, we’re not kidding]
Since the end of the COVID recession, retail inventories ex-autos have spiked at an annualized rate of 12.8%, way higher than the prior expansion period (post 2008) where inventories rose at an annualized rate of only 2.7%.
Bloomberg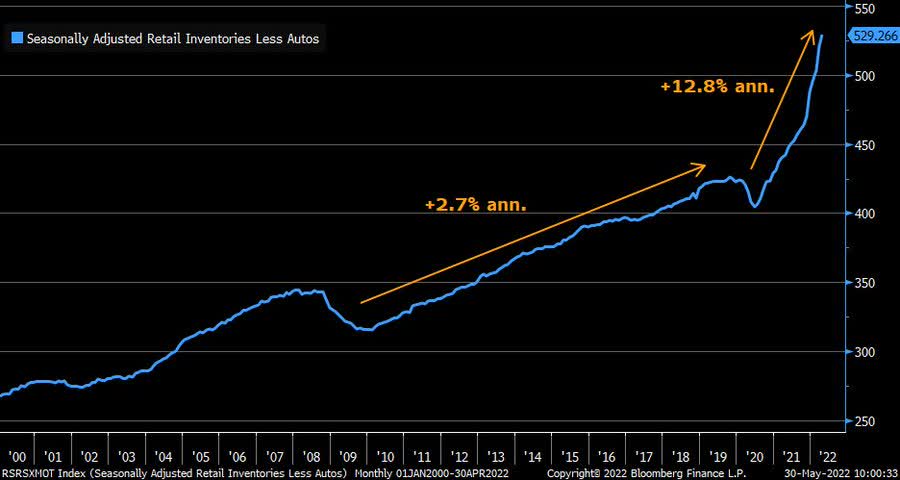
Having all that in mind, it’s not a big surprise to see the Citigroup Economic Surprise Index being down hard over the last few weeks.
Yardeni Research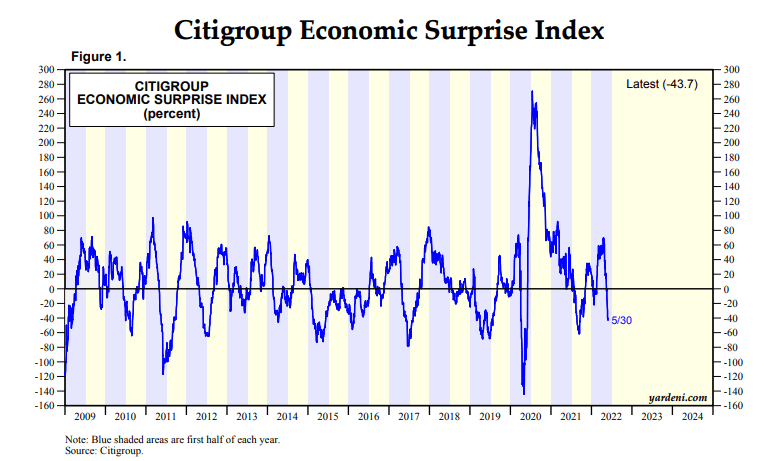
And if this isn’t enough to scare you off, here is Morgan Stanley (MS), a bank you can always count on to deliver the most bearish (and sober?) outlook on the street.
Last week’s strength will prove to be another bear market rally in the end. The key fundamental call we are focused on now is slowing growth, and our view that earnings estimates are too high – MS’s Mike Wilson
Bloomberg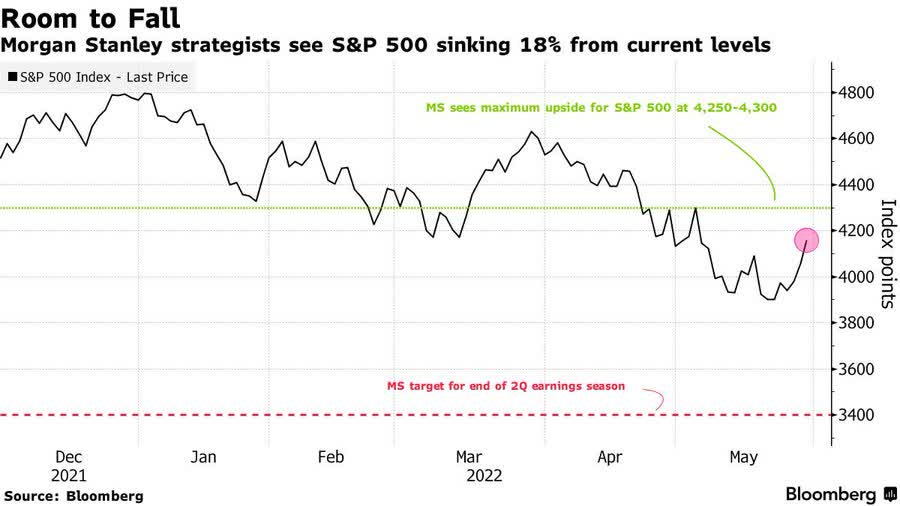
2022 Lead Investment Themes Remain Intact
Summing up last week:
- Bear on the cover of Barron’s
- Freak-out tweet from Bill Ackman (similar to March 2020)
- George Soros said “civilization may not survive”
- Ray Dalio said “cash is trash… but equities are trashier”
- Oh, and the stock market ended up 6%…
LPL Research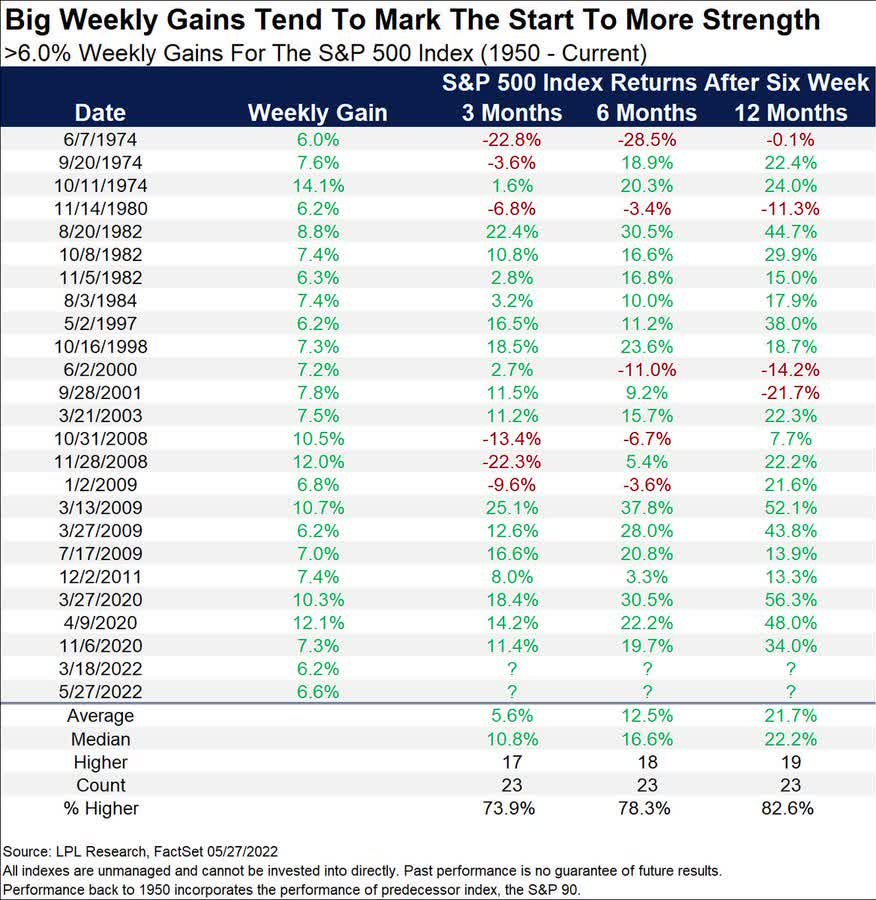
In-spite of the past week, when the S&P 500 (SPX) managed to escape from tying the all-time record of eight consecutive down weeks, the main themes so far in 2022 were:
- No to Growth, Cyclicals, Small-caps.
- Yes to Value, non-Cyclicals, Large-caps.
Charles Schwab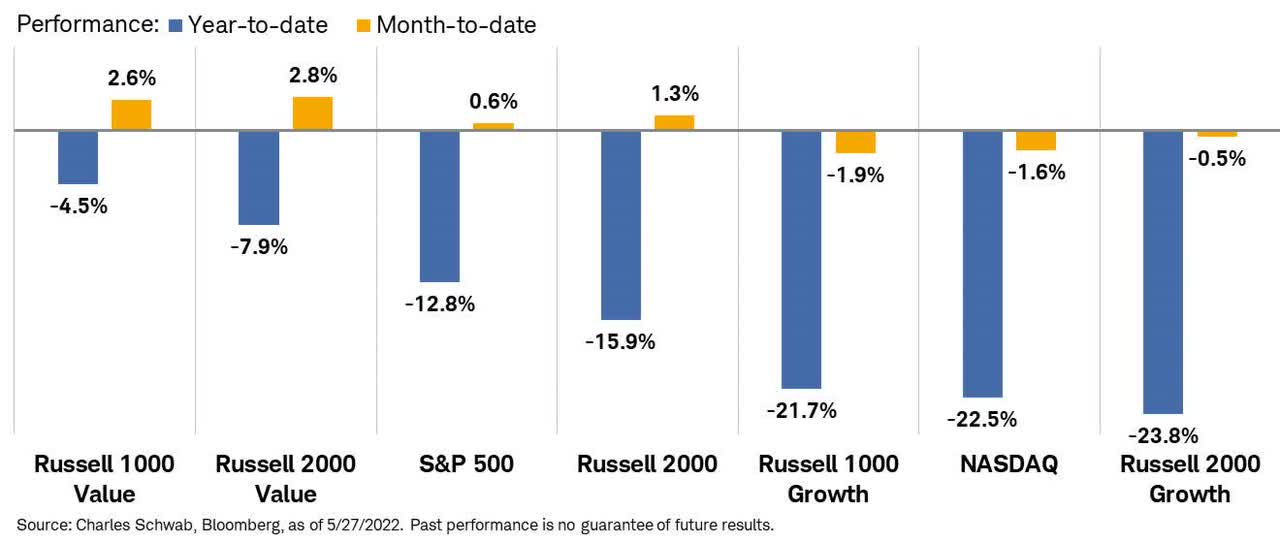
If you ask yourself what is more hated, Growth or Small-caps, the answer is the former.
In-spite of both indices experiencing a very rough year, Russell 2000 (IWM) is still outperforming NASDAQ Composite (COMP.IND, NDX) YTD by the widest margin (6.5%) since 2016.
Bloomberg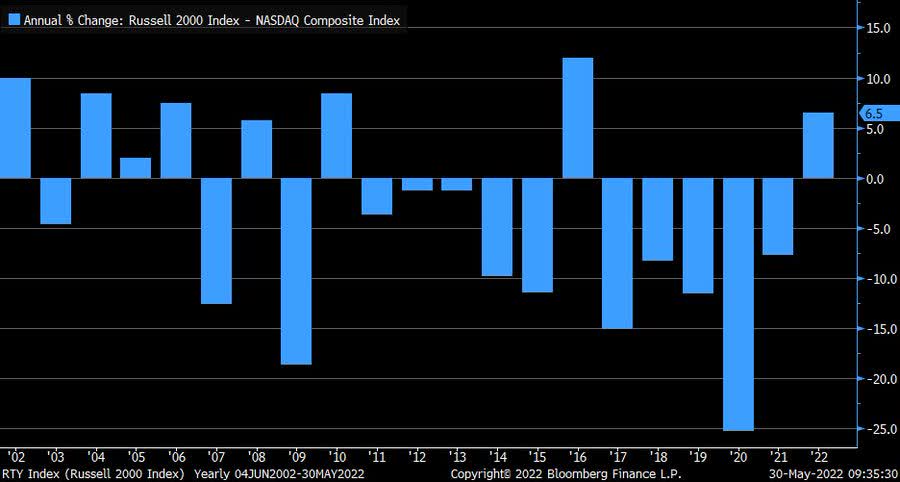
Goldman Sachs
Great opportunities do not come every year… – Charles Dow
Those of you who keep asking us whether it’s too late to jump onto Commodities (be it Energy, Agriculture, or Metals) should watch the below closely.
On one hand, a sharp decline in global economic growth (let alone recession) could very well bring some serious headwinds.
Topdown Charts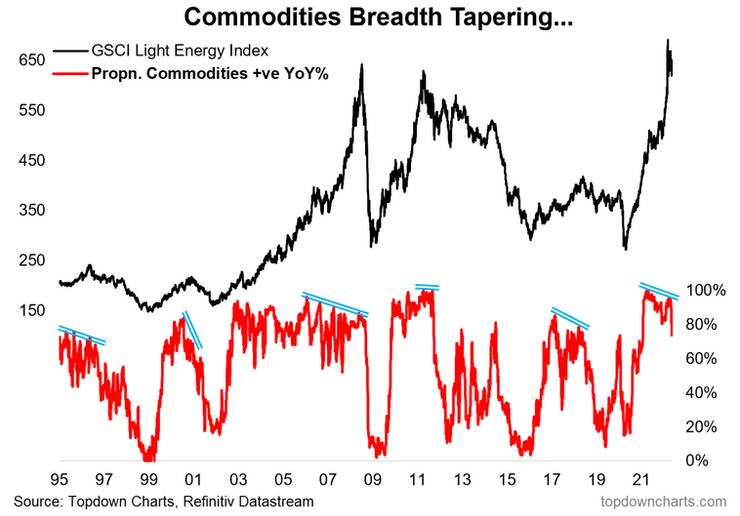
On the other hand, although it’s too early to pave anything in stone, it surely looks as if a new era (favoring Commodities over Stocks) has begun.
You may have missed the first inning, but there’s still plenty of time to get involved in this potentially decade-long upcoming move.
Optima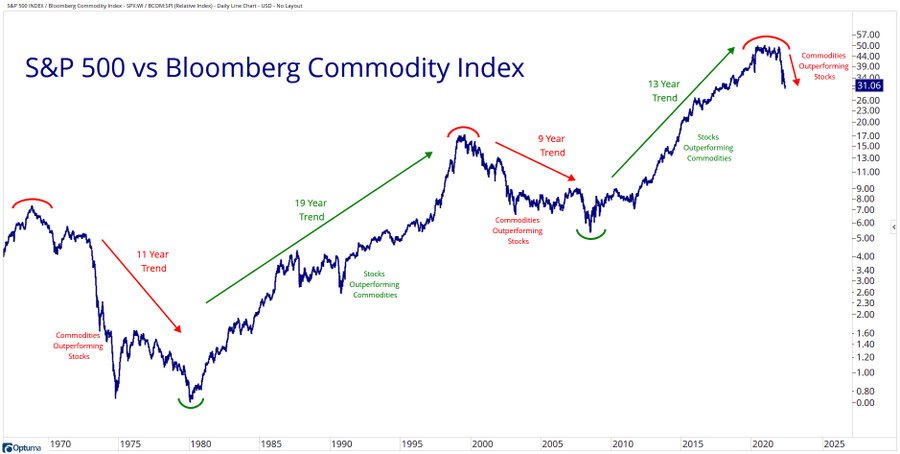
Back to the stock market as a whole.
For now, the long-term risk-off environment remains intact.
Optima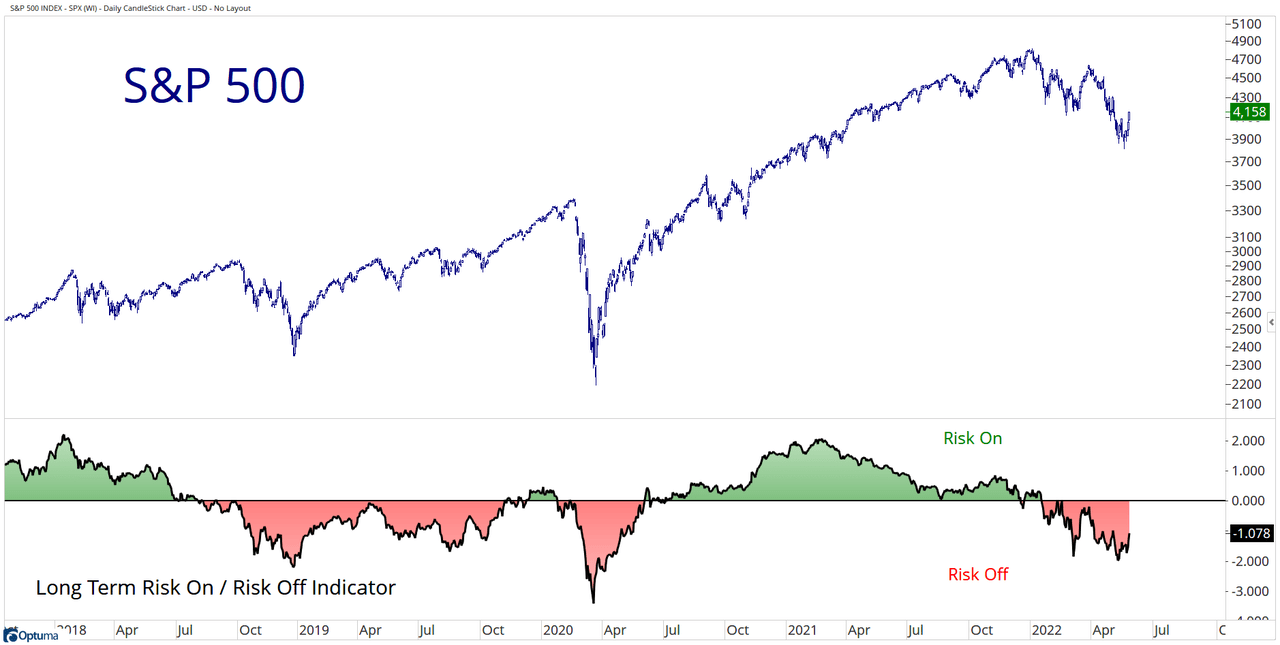
Until the short-term flows over to the longer timeframe, this is still an environment that is calling for a lower exposure to risky assets.
US cycle short leading indicator (forecast of growth, based on rates, commodities and USD) vs ISM.
There’s now a high probability for a drastic economic slowdown (aka recession) thanks to excessive tightening.
Another, just as important aspect, is how long such a slowdown/recession will be, and that is likely to be determined by (how much) corporate earnings get crushed.
Julien Bittel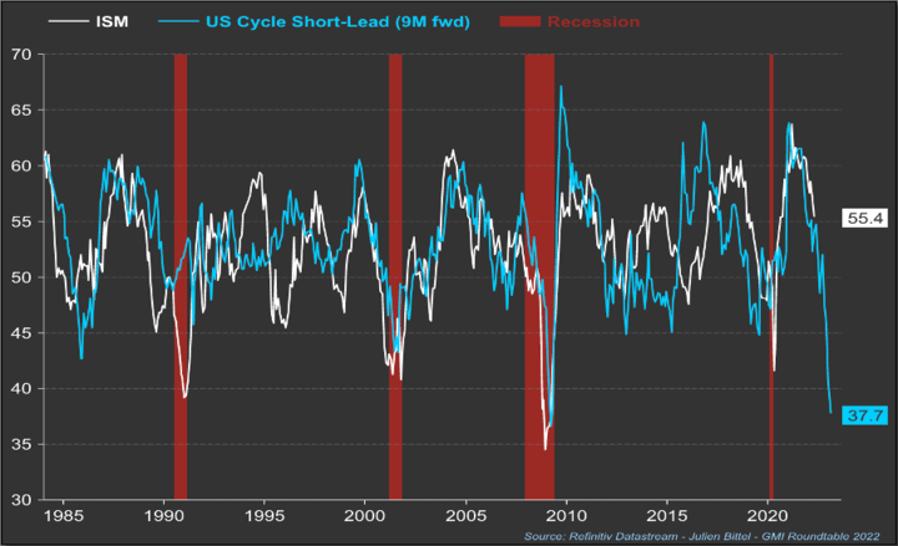
Note that the percentage of Bears (Bulls) is now higher (lower) than even the March 2020 peak (trough) level!
Optima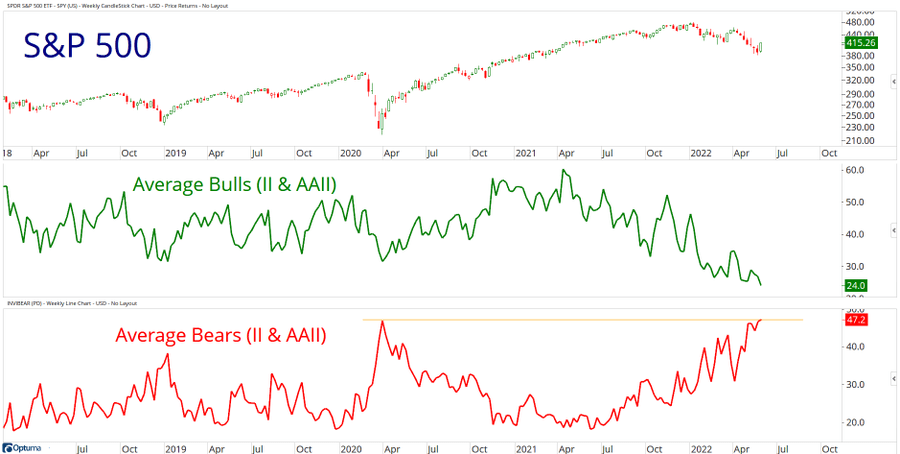
Btw, so are supply chain disruptions…
FT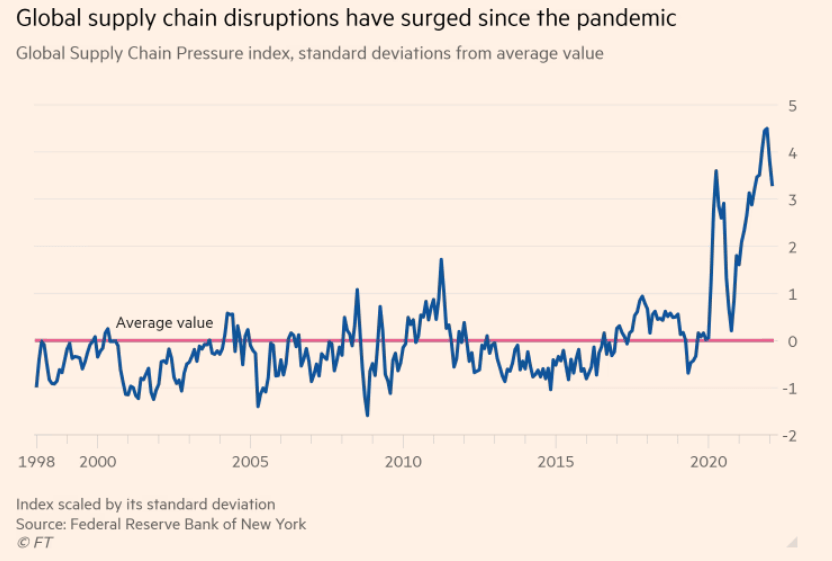
Healthcare: A Hybrid Sector, Tilted to Value
Healthcare sector, represented by Health Care Select Sector SPDR ETF (NYSEARCA:XLV), is a bit of a mix.
On one hand, it’s predominantly based on “Value, non-Cyclicals, Large-caps”.
On the other hand, it has significant allocation to “Growth, Cyclicals, Small-caps”, mainly through the Biotechnology, Healthcare Equipment and Technology industries.
Corporate Finance Institute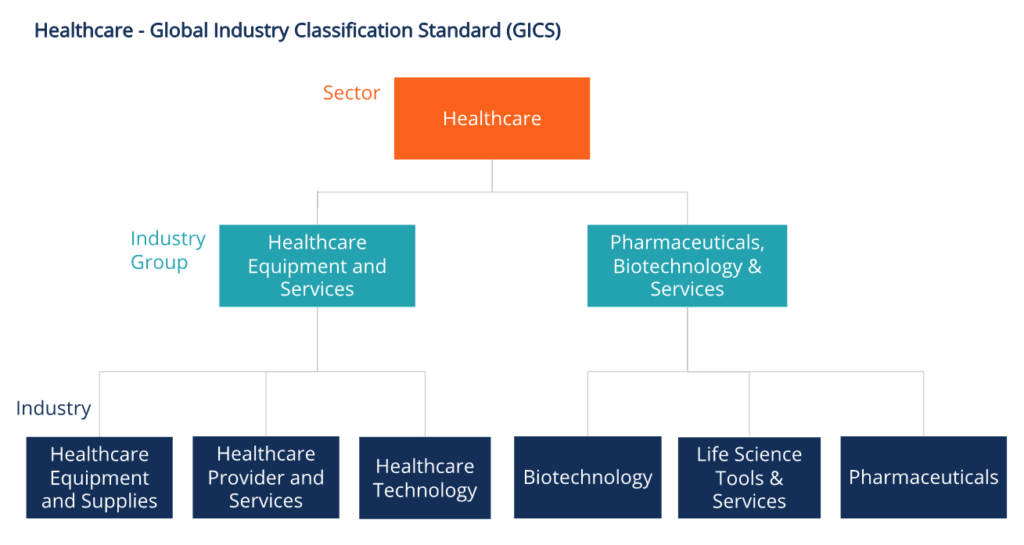
Below you can see the weighting of the sector within the SPX and what industries are making the whole, as of May 27 (Source: S&P GICS data).
| Sector / Industry | Weighting in S&P 500 / Sector |
| Healthcare | 14.49% |
| Biotechnology | 14.34% |
| Healthcare Distributors | 2.00% |
| Healthcare Equipment | 18.05% |
| Healthcare Facilities | 1.19% |
| Healthcare Services | 5.18% |
| Healthcare Supplies | 0.92% |
| Healthcare Technology | 0.55% |
| Life Sciences Tools & Services | 12.77% |
| Managed Healthcare | 14.33% |
| Pharmaceuticals | 30.66% |
If Healthcare is “predominantly based on Value, non-Cyclicals, Large-caps”, the sector allegedly deserves to be treated the same way other non-cyclical sectors, most notably Utilities (XLU) and Consumer Staples (XLP), are.
Although the sector has come a long way (as 2022 progresses), clawing its way back from the lower half to the upper half (among the SPX sectors performance ranking), it’s still lagging behind its colleagues.
Charles Schwab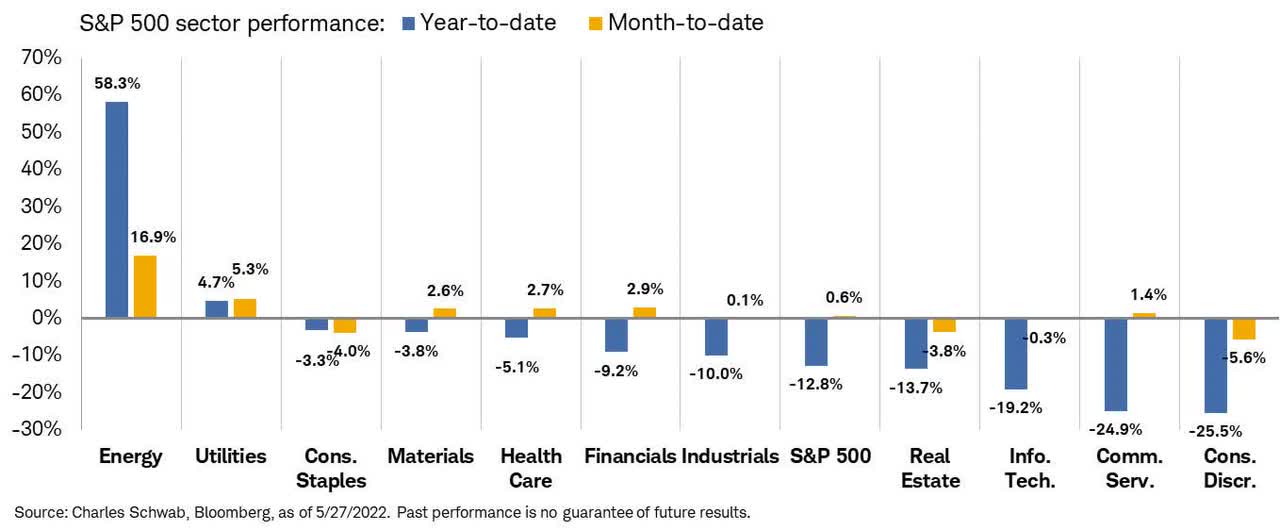
XLV: Making a Portfolio Healthier
As of June 15, only 14.4% of XLV’s AuM are allocated to Biotechnology.
| Sector | Weight |
|---|---|
| Pharmaceuticals | 31.34% |
| Health Care Providers & Services | 22.85% |
| Health Care Equipment & Supplies | 18.73% |
| Biotechnology | 14.40% |
| Life Sciences Tools & Services | 12.67% |
Out of the fund’s 64 holdings (as of June 15), only 8 are defined as “Biotechnology”:
| Name | Ticker | Weight (%) |
| AbbVie Inc. | ABBV | 5.300764 |
| Amgen Inc. | AMGN | 2.881227 |
| Gilead Sciences Inc. | GILD | 1.590357 |
| Vertex Pharmaceuticals Incorporated | VRTX | 1.40133 |
| Regeneron Pharmaceuticals Inc. | REGN | 1.300388 |
| Moderna Inc. | MRNA | 0.984448 |
| Biogen Inc. | BIIB | 0.629177 |
| Incyte Corporation | INCY | 0.280022 |
2022, thus far, isn’t the best of year for XLV, just as it isn’t for the entire market.
Since its inception on Dec 16 1998, XLV has been tracking the Health Care Select Sector Index fairly closely, although over time costs are eating into the performance.
| Fund | 1 Month | QTD | YTD | 1 Year | 3 Year | 5 Year | 10 Year | Since Inception |
|---|---|---|---|---|---|---|---|---|
| NAV | 1.43% | -3.34% | -5.85% | 8.53% | 16.94% | 13.59% | 15.75% | 9.09% |
| Price | 1.46% | -3.33% | -5.81% | 8.57% | 16.97% | 13.60% | 15.75% | 9.10% |
| Index | 1.44% | -3.34% | -5.83% | 8.68% | 17.12% | 13.75% | 15.93% | 9.32% |
A difference of 0.22% between the index’s annual performance to the fund’s annual price change comes up to 5.3% when measured over 23.5 years.
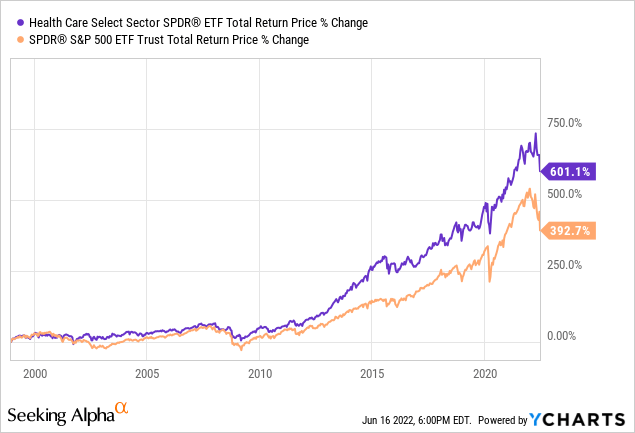
Still ,XLV has done a fantastic job over the years and the fund has outperformed SPDR S&P 500 ETF Trust (SPY) by over 200% (!) since its inception.
XBI: Making a Portfolio Riskier
Just like XLV, the SPDR S&P Biotech ETF (NYSEARCA:XBI) also belongs to the same investment manager – State Street (STT).
Since its inception on Jan 31 2006, XBI has been tracking the S&P Biotechnology Select Industry Index very closely, (and unlike XLV) with a minor difference over time.
| Fund | 1 Month | QTD | YTD | 1 Year | 3 Year | 5 Year | 10 Year | Since Inception |
|---|---|---|---|---|---|---|---|---|
| NAV | -6.75% | -23.52% | -38.51% | -46.22% | -4.57% | 0.44% | 10.24% | 9.45% |
| Price | -6.79% | -23.54% | -38.54% | -46.28% | -4.58% | 0.45% | 10.23% | 9.45% |
| Index | -6.74% | -23.49% | -38.45% | -46.08% | -4.48% | 0.49% | 10.06% | 9.47% |
Nonetheless, the return of XBI since inception (9.45%) is only 0.35% higher than that of XLV since inception.
Does that gap justify taking the much higher risk involved with investing in Biotech? Probably not, especially when you add the element of income.
Since pharma stocks are mostly high-dividend payers as opposed to biotech, where most companies don’t pay any dividend, the difference in total return is even more staggering (than the small price gap in favor of XBI).
Y-Charts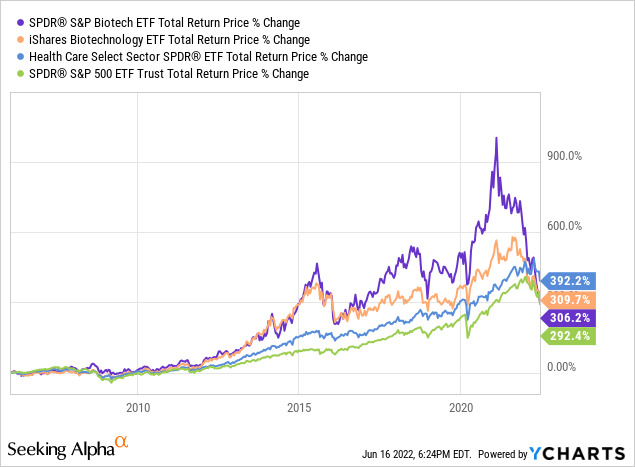
As a matter of fact, since XBI inception, XLV has performed better than XBI (or iShares Biotechnology ETF (IBB) for that matter). Not only have investors in XLV got a total return greater by 86%, but taking into consideration that XLV is less risky (volatile) than XBI – it was a no brainer to choose XLV over XBI.
With 156 holdings (As of June 15), XBI is more diversified than XLV, which is not a big surprise taking into consideration that many biotech names are small-caps.
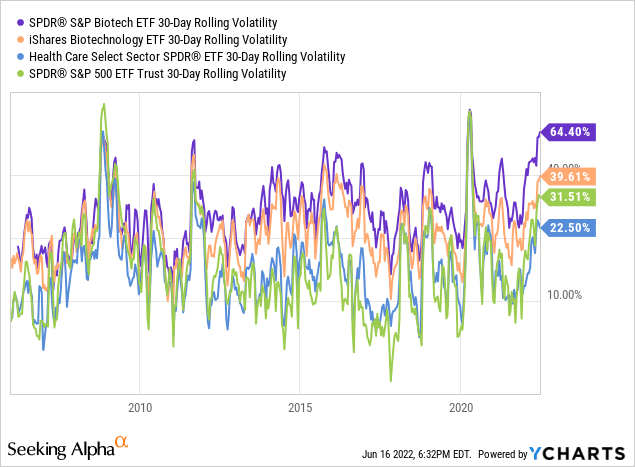
If the stock market stinks over the past 6 months or so, those investing in Biotech are already suffering for a couple of years, especially over the past 16 months.
Y-Charts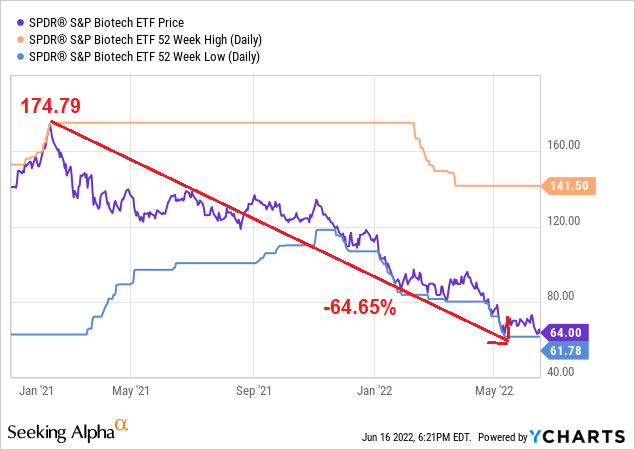
If you were investing in Biotech over the past 5 years – your total return is flat.
State Street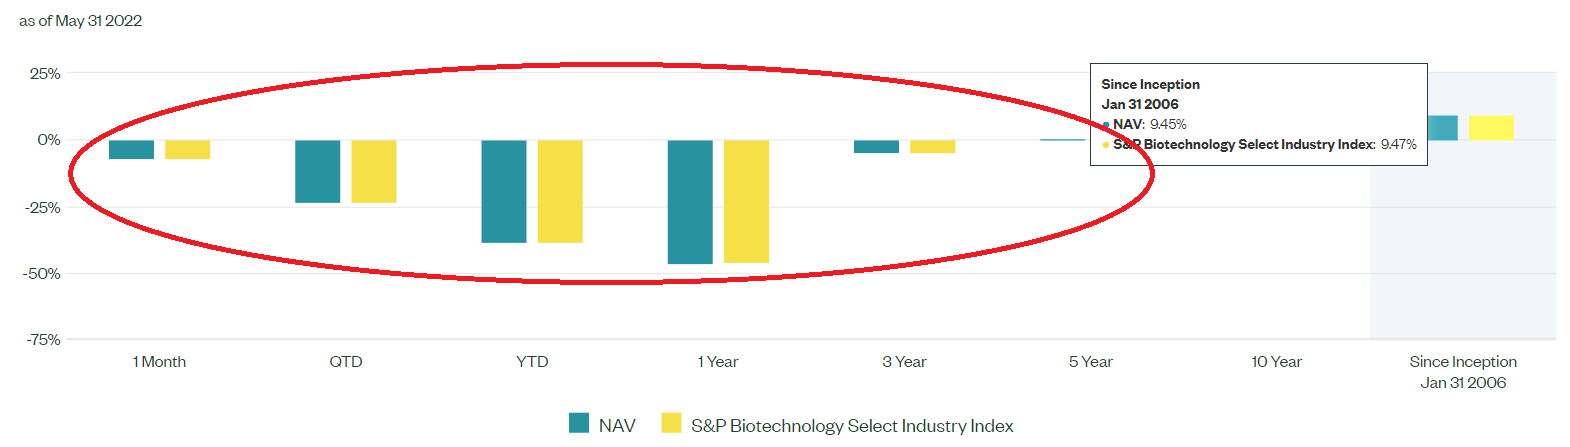
That, naturally, has pushed many investors out of the Biotech arena, and it’s safe to say that it’s one of the most-hated spaces among the stock market.
Nevertheless, we mustn’t forget that had we done this analysis in early February 2021, when XBI peaked, the results would be looking way different, in favor of Biotech.
Putting it differently, timing is everything and Biotech – whether you like it or not – has its time.
Biotech: Easy Come, Easy Go
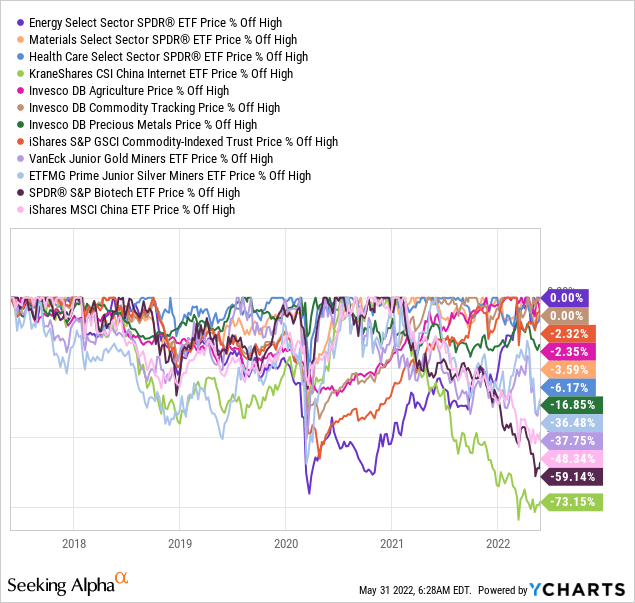
Below charts contain a list of leading/popular Healthcare ETFs representing various segments within the sector.
We’re focusing on how Biotech has been performing relative to its peers.
Since March 23, 2020: Accelerating fast, Cooling-off even faster…
Y-Charts, Author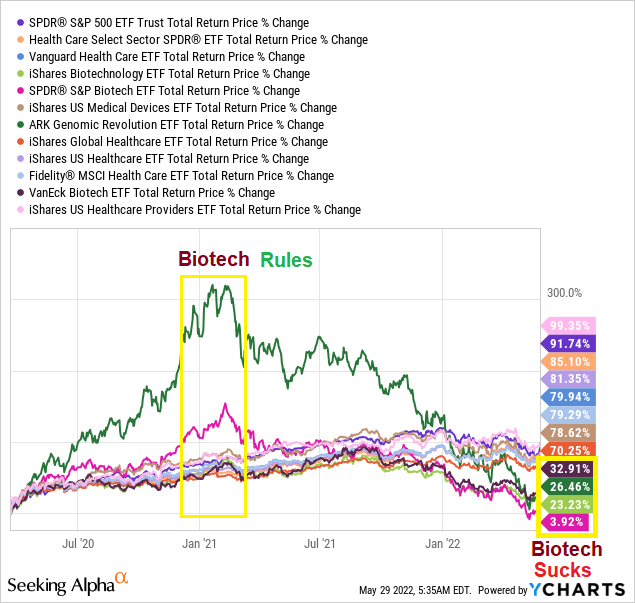
YTD: Nothing to be proud of.
Y-Charts, Author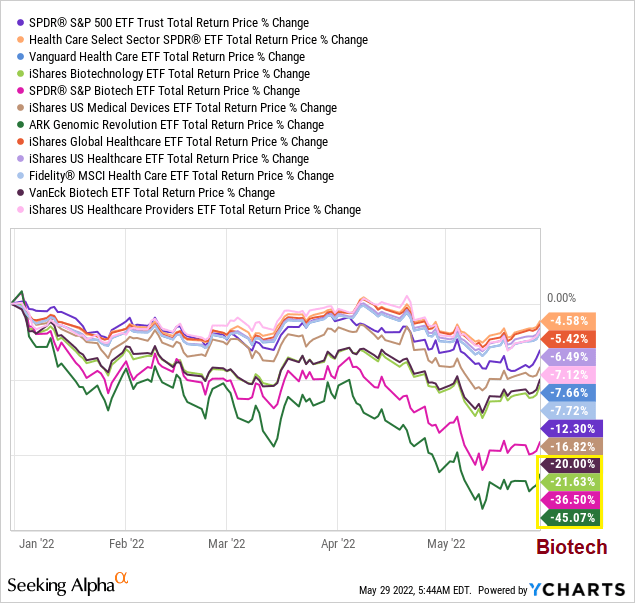
Biotech has the largest drawdown among all healthcare ETFs.
Y-Charts, Author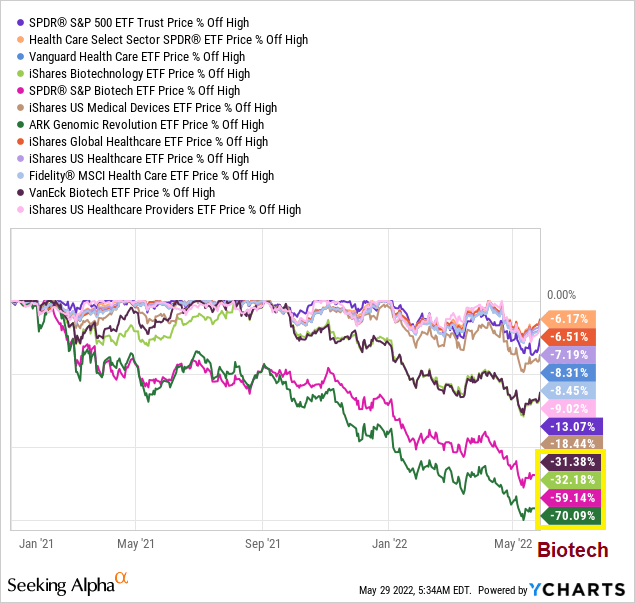
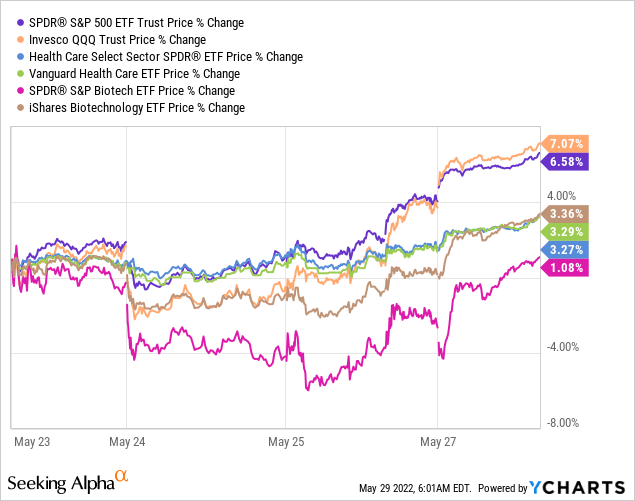
Past week: Too early to call this “signs of recovery”.
Reasons to be Bullish (long-term) on Healthcare/Biotech
1. Generally speaking, stocks are still at a high risk but no longer overvalued.
SPX forward P/E ratio is right at its 10-year average.
FactSet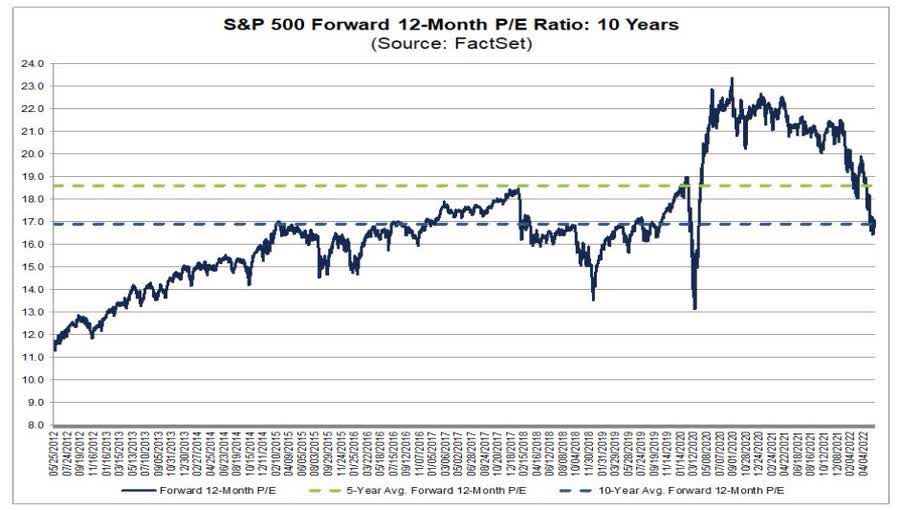
2. Corporate America is still earning decent money.
SPX’s forward earnings yield relative to UST10Y is still firmly positive.
Bloomberg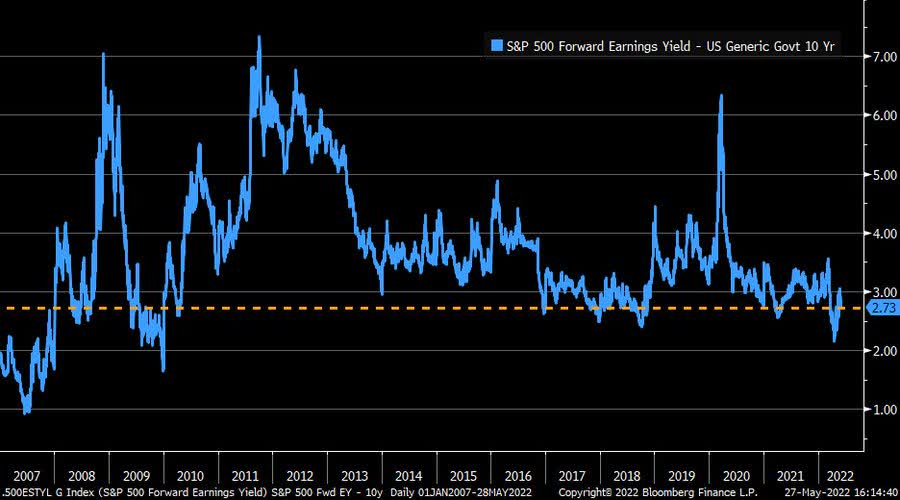
3. Run to Safety/Value may have gone too far.
Forward P/E ratios of Utilities and Consumer Staples are >20% and >10%, respectively, than their 10-year averages. Healthcare forward P/E is less than 4% higher than the sector’s 10-year average.
Forward P/E ratios of Utilities and Consumer Staples are higher than that of Technology. Healthcare is way cheaper.
FactSet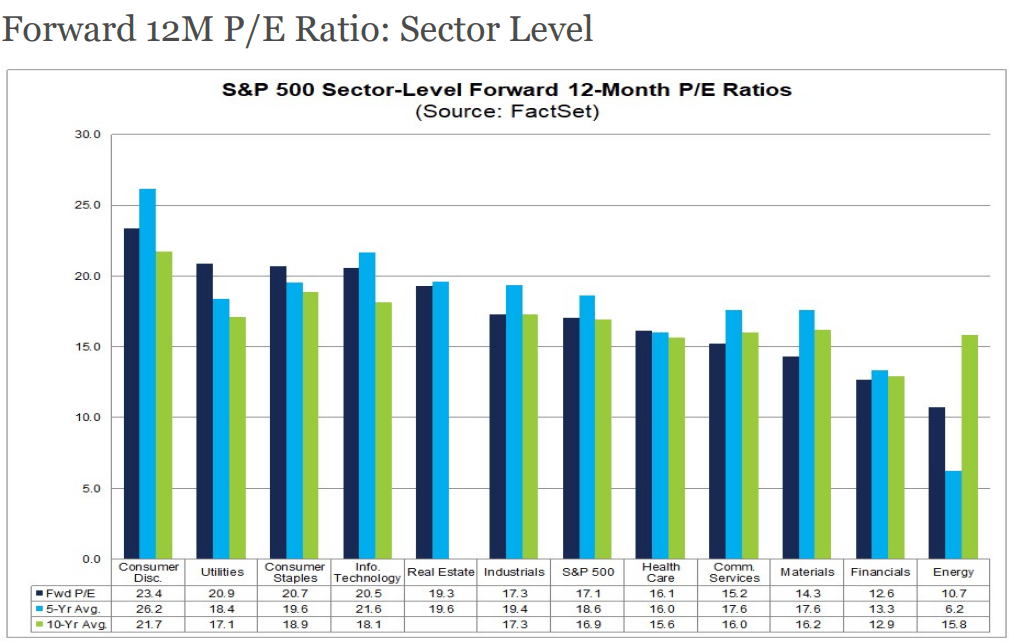
4. The biotech sector is experiencing the most severe downturn of at least the last 20 years.
There have been many other downturns in the more recent past, but this one is different.
Biotech performance (XBI) by market capitalization since Feb 2021 peak through May 24th, 2022.
Peter Kolchinsky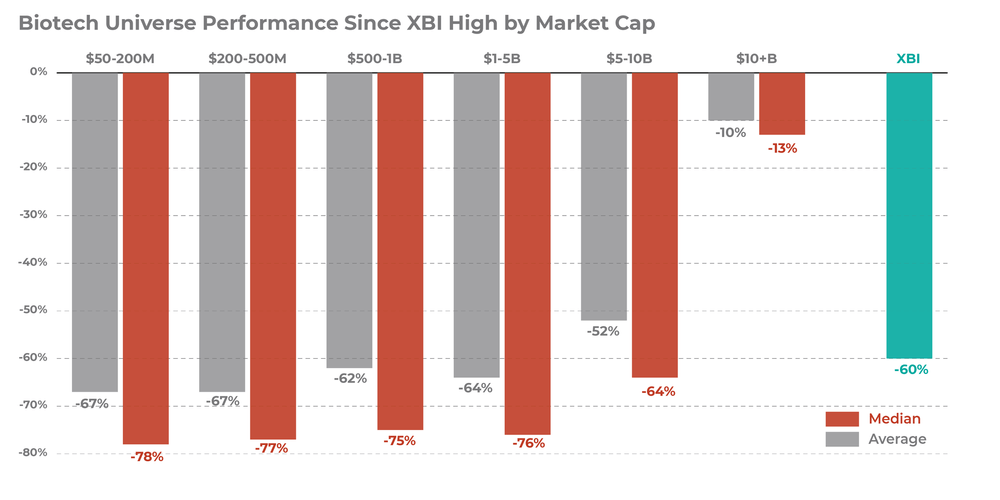
Here Peter Kolchinsky discusses why – and how we’ll rebound.
5. Technically speaking, it’s fairly clear what we should do.
Easier when it comes to Healthcare.
Y-Charts, Author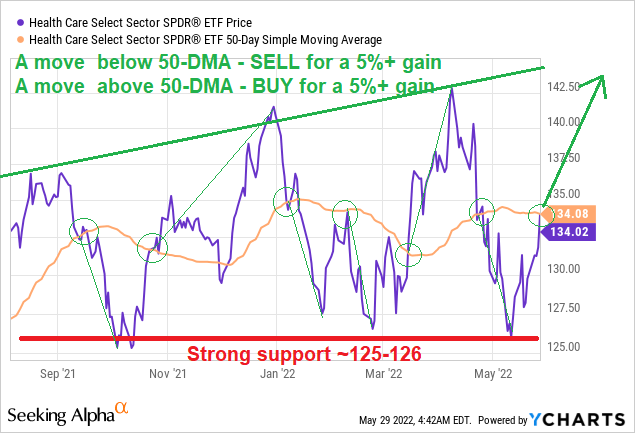
More complicated when it comes to Biotech.
Y-Charts, Author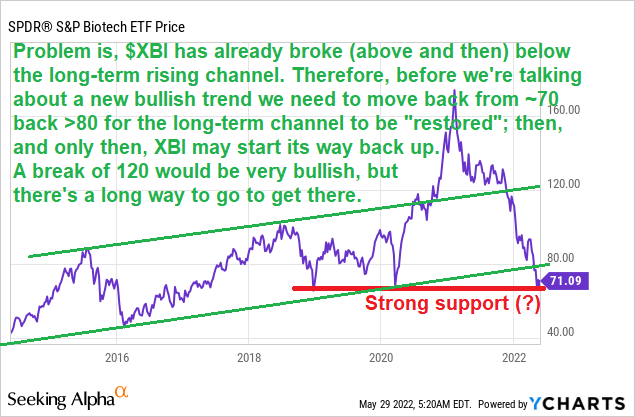
Be the first to comment