

Candle Photo
It’s Not You, It’s Me
You know you’re addicted to ETF research when looking at a fund’s weightings list makes you viscerally cringe. This was the case when I recently took a closer look at the Consumer Staples Select Sector SPDR Fund (NYSEARCA:XLP), the oldest and largest consumer staples ETF by far dating back to 1998 with nearly $16B in assets, dwarfing its nearest peer VDC from Vanguard at only $6.5B.
That isn’t to say that it’s a bad ETF — on the contrary, you can see I’ve given it a soothing yellow hold rating at the top of the page. However, being “good” and being “great” are two very different things in investing, and I believe that while XLP is a solid sector ETF that’s suitable for any diversified portfolio, investors would be doing themselves a disservice by not considering a simple alternative that could provide them with similar exposure to the sector but far greater long-term returns and income.
In this article, I’ll show how investors can create a potentially superior alternative stock portfolio to XLP and provide an overview of XLP’s holdings, weightings, and index methodology along with a view to its performance going forward.
The Importance of Staples Exposure
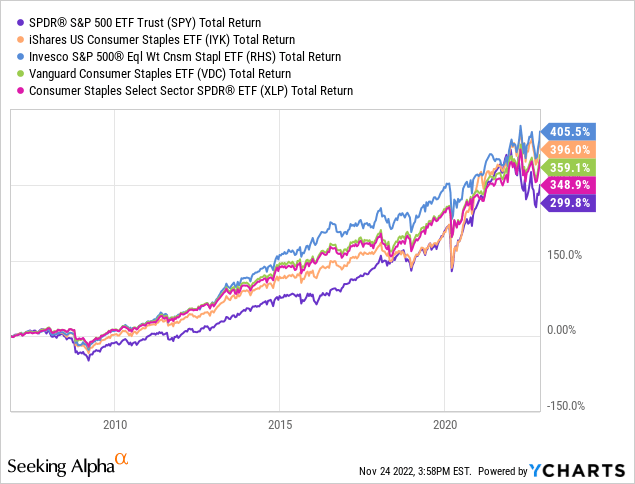
As we can see above, XLP’s performance generally falls in the middle of its consumer staples ETF peers from Vanguard (VDC), Invesco (RHS), and iShares (IYK). Fidelity (FSTA) and First Trust (FTXG) also have solid offerings, but I’ve omitted them here due to their shorter track records. Beginning the chart in 2007 before the start of the Great Recession, we can also see the worth of keeping significant exposure to the sector in your portfolio, as all four staples ETFs held up much better than the S&P 500 (SPY) during the 2007-2009 crash and have outperformed it by 50-100% on a total return basis over the last 15 years.
Given the defensive nature of the sector, we should expect it to excel during recessions when consumers’ purchasing power falls and they cut costs on discretionary items. But as we currently stand on the brink of another recession, it’s also helpful to see how staples’ resilience during a couple difficult years can translate into decades of superior capital preservation through a blend of consistent slow growth and compounding dividends.
Dividend Analysis
No one is going to be sending “to the moon” rocket emojis about XLP, but investors shouldn’t underestimate what a little dividend boost can do for your risk-adjusted returns over time. Compared to SPY, XLP boasts a higher starting yield of 2.39% vs SPY’s 1.53% plus a slightly better 3-year dividend CAGR of 5.17% vs SPY’s 4.11%.
It might not seem like much, and of course those growth rates will change over time, but if we extrapolate forward 10 years, that would result in a yield on cost of 3.96% for XLP vs 2.29% for SPY, and after 20 years XLP’s yield on cost would be a no-longer-insignificant 6.55% vs 3.42% for SPY. Put another way, after holding both ETFs for 20 years, SPY would need to outperform your XLP position by over 3% per year just to keep up, and XLP would need to lose over 6.5% each year before your annual returns would be negative.
A visualisation tool I like to use is runners: a slightly faster runner will win a sprint by only a second or two at most, but will win a marathon by many minutes or even an hour. This is the same reason we need to hold dividend stocks for long periods of time to actually get the benefits of the dividend. A few months or years of dividends won’t matter much in the face of stock fluctuations, but over decades the power of compounding takes over and your yield on cost becomes a buoy against longer-term stock drawdowns and bear markets.
XLP Historical Yield (Seeking Alpha)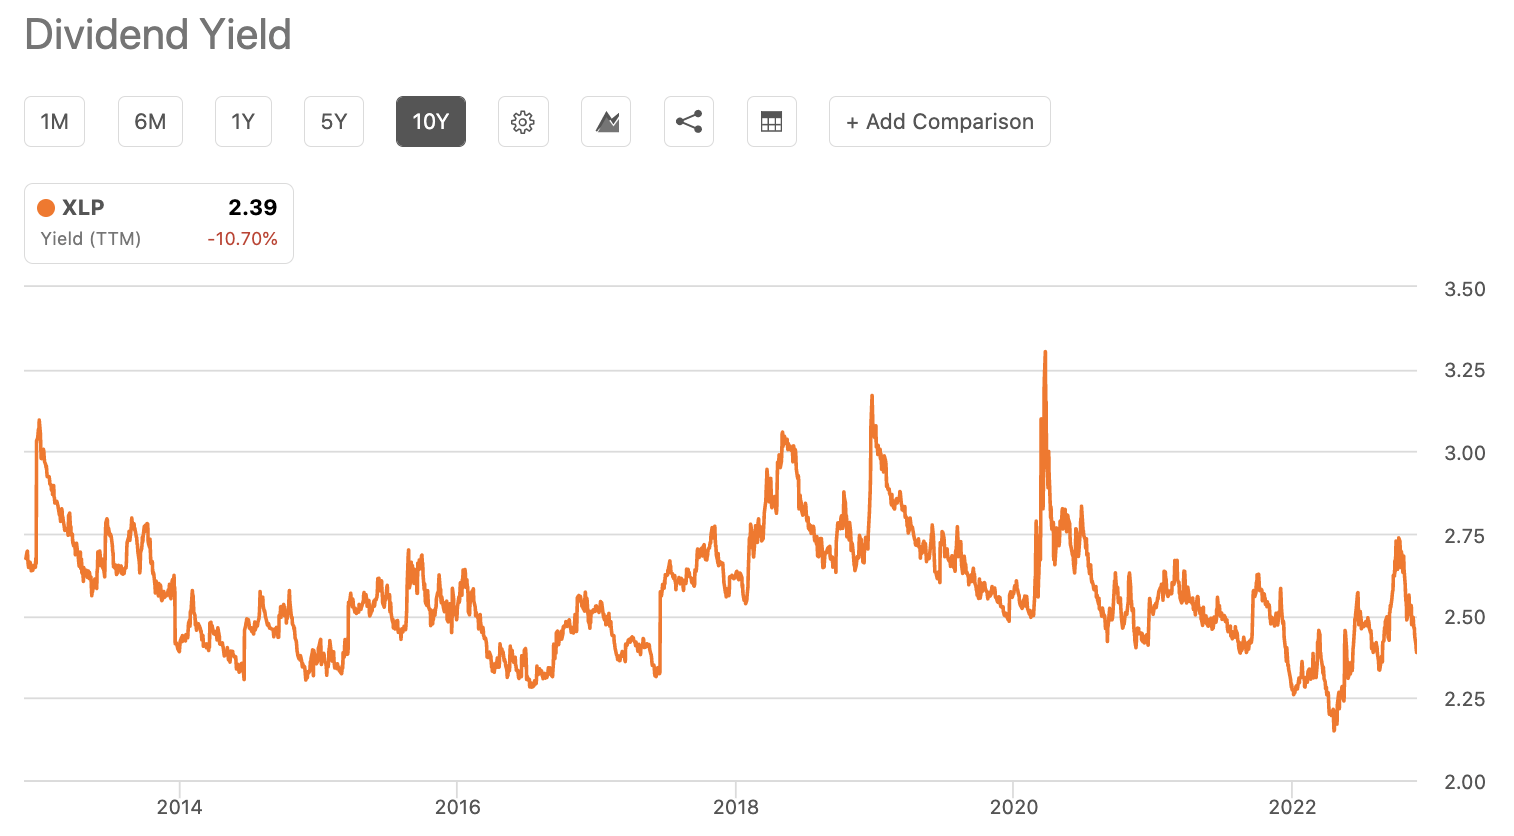
From its historical yield chart, we can gather that XLP tends to be a strong buy when its yield tops 2.75% and a sell when it dips below 2.30%, with its average hovering around 2.5%. Now at 2.39%, I find its yield a bit too low to issue a buy recommendation for a couple reasons.
First, the economy has now entered a deflationary period that might begin to put downward pricing pressure on staples companies’ products. Earnings reports over the past year have frequently shown revenues and profits boosted by broad price hikes justified by increased commodity, fuel, and shipping costs that needed to be at least partly passed onto consumers.
Whether or not companies abused the inflationary period to enact price hikes to their and their shareholders’ advantage, as forward shipping and purchasing contracts are renewed these companies will no longer be able to justify further price hikes, and may experience public and possibly political pressure to either bring prices down again or at least to maintain them at current levels for a longer period than they might prefer.
XLP Top Holdings (ssga.com)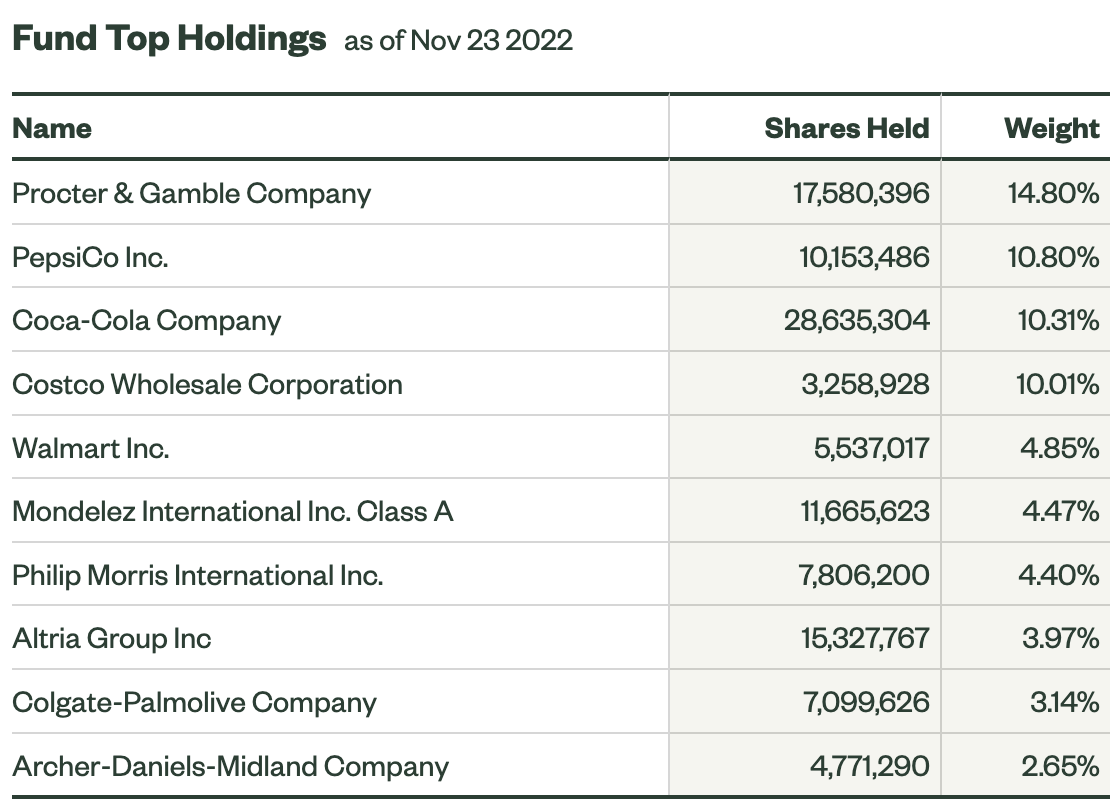
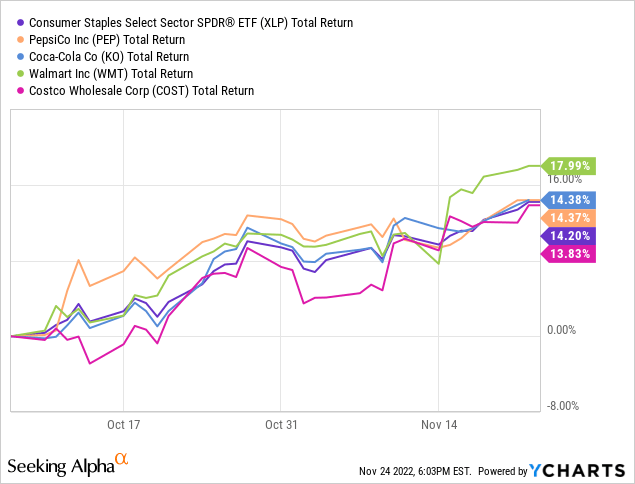
Second, although we know the staples sector tends to outperform in a recession, a number of XLP’s top holdings such as Procter & Gamble (PG), Pepsi (PEP), Coca-Cola (KO) and Walmart (WMT) have just enjoyed major rebounds on the heels of excellent Q3 earnings reports. With an equal-weighted ETF this wouldn’t concern me, but XLP’s top five holdings comprise over 50% of its index, so I think it’s wise to wait for the post-earnings euphoria to subside a bit and witness a pullback in at least a couple of those top holdings before initiating a position in XLP.
A Simple 3-Stock Substitute
One of my favourite things to do for clients is to design alternative portfolios for them to consider that retain the same asset exposures of their current portfolio but with improved metrics based on their wishes, whether it be better expected returns, lower volatility, higher yield and dividend growth, or lower expense ratios.
As I mentioned at the outset, XLP’s top-heavy weightings gave me pause: the top 4 holdings drive an outsized 45% of its returns, and while this isn’t a bad thing given the extremely high quality of those stocks (PG, PEP, KO and COST), it made me wonder if it wouldn’t be better to simply own these top holdings directly for greater dividend growth and return potential versus XLP.
For the sake of simplicity, let’s narrow these four holdings down to three — PG, PEP, and COST — since I prefer PEP to KO for its history of higher overall growth and dividend growth, and their products obviously have a lot of overlap. Equal weighting PG, PEP, and COST as a focused consumer staples basket within a larger portfolio offers us wide exposure to the entire sector: PG for personal care and cleaning products, PEP for food and drinks, and COST for grocery stores, private label brands, and myriad other consumer goods and services.
While we lose diversification, let’s see what we might gain over XLP with this hypothetical portfolio:
3-Stock Portfolio vs. XLP (portfoliovisualizer.com)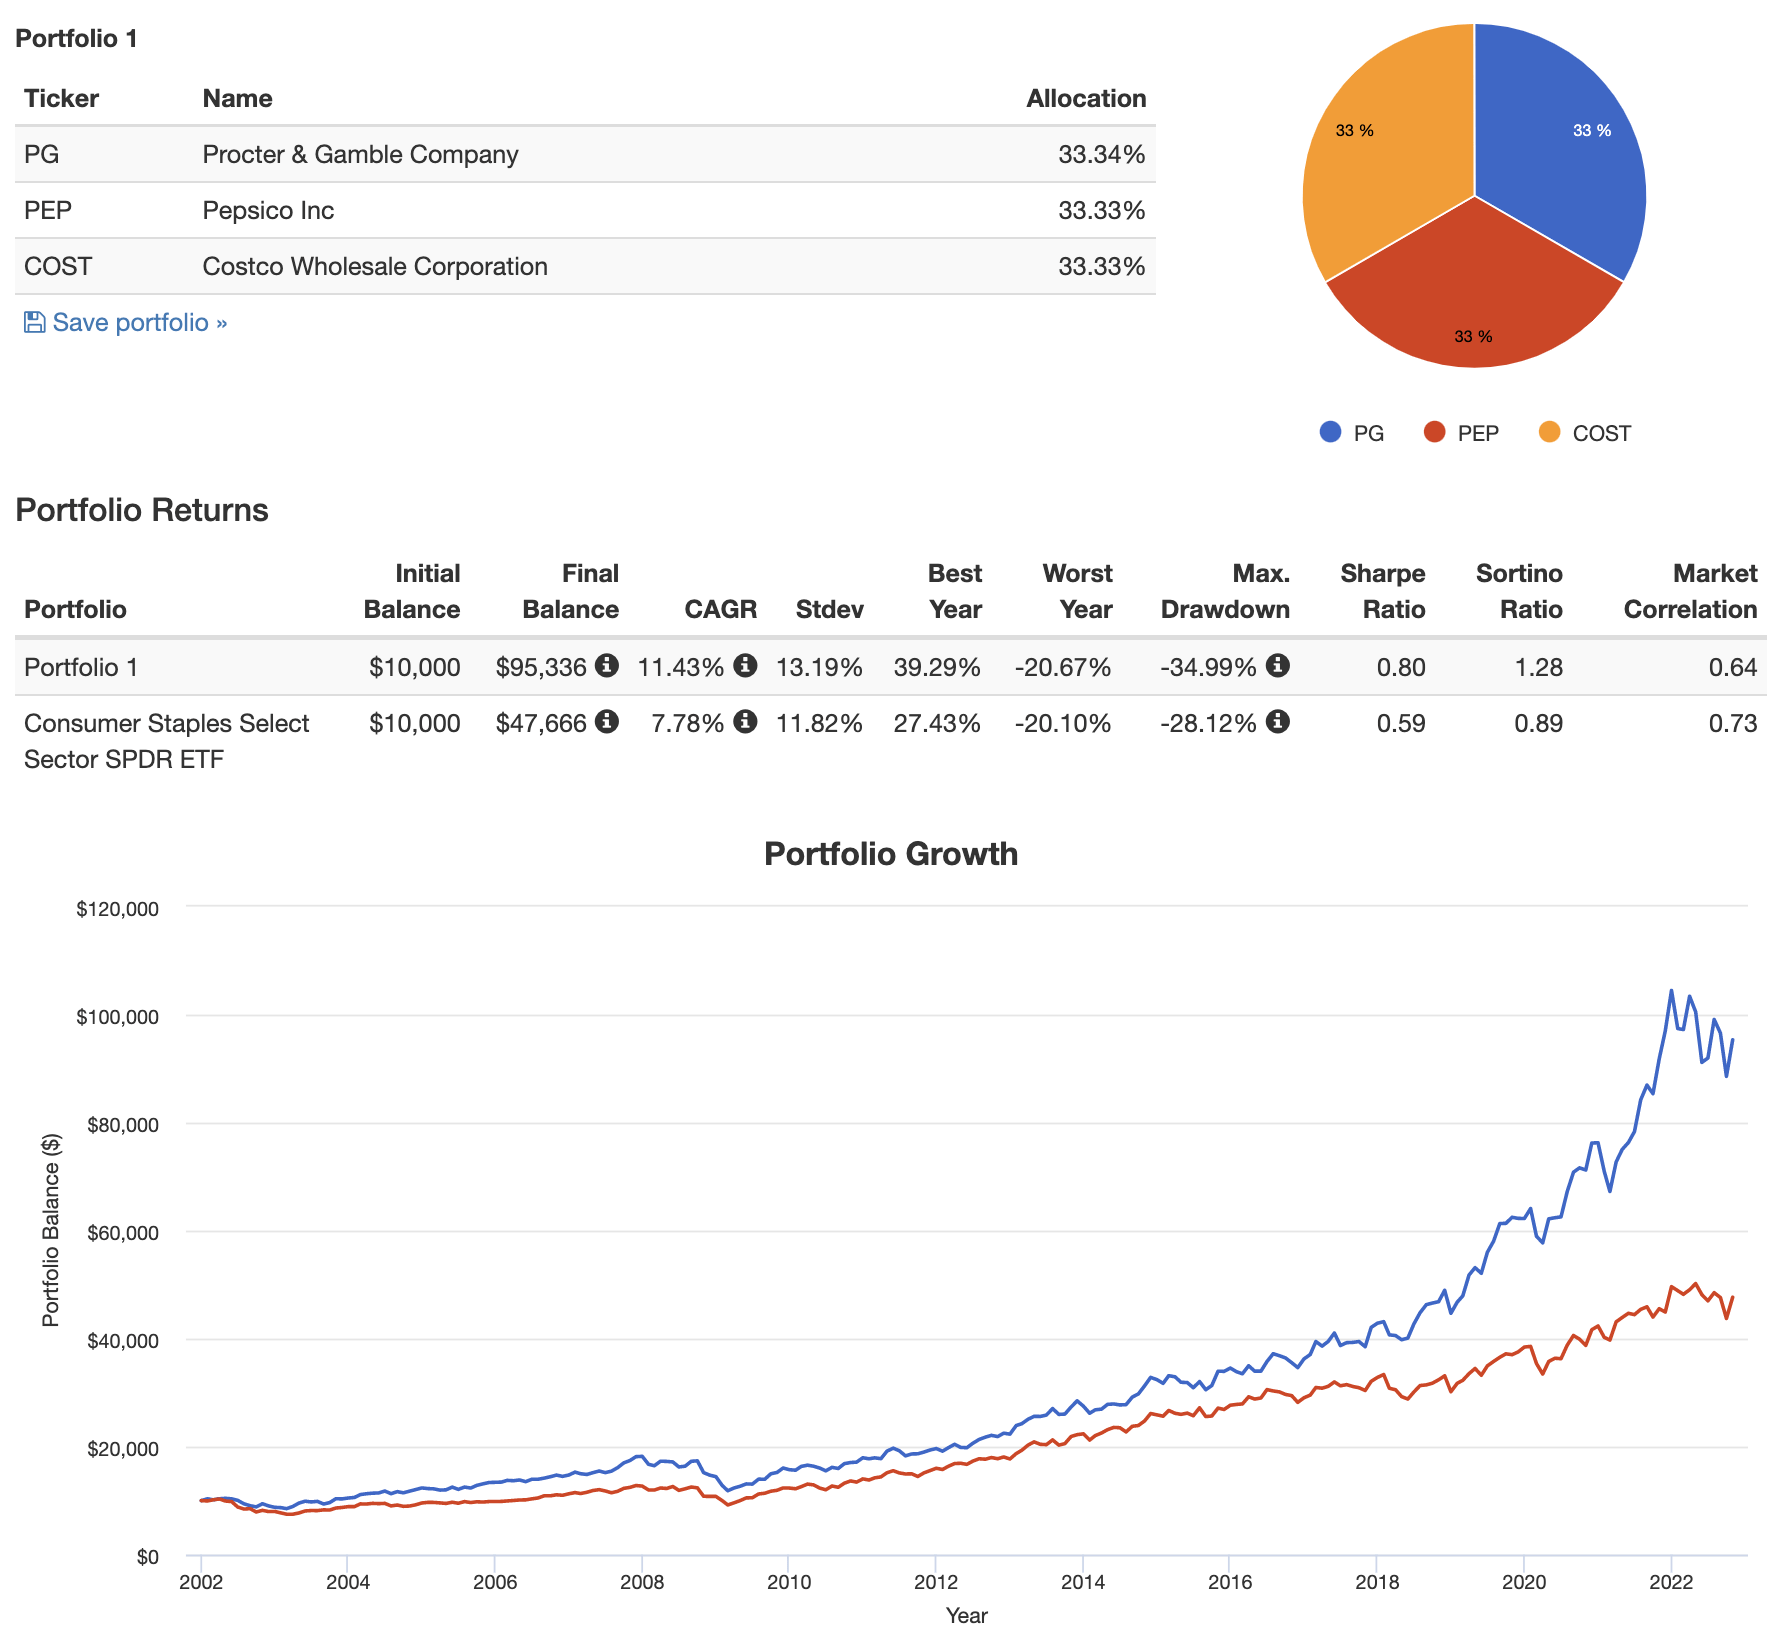
If an investor had been willing to put their faith in three stocks that make up 35% of XLP’s returns, over two decades they would have doubled XLP’s returns with far better risk-adjusted returns versus the S&P 500 (Sortino Ratio) than XLP. The stock basket’s maximum drawdown and average volatility (standard deviation) were greater than those of XLP, so let’s take a closer look and compare their historical drawdowns:
portfoliovisualizer.com portfoliovisualizer.com portfoliovisualizer.com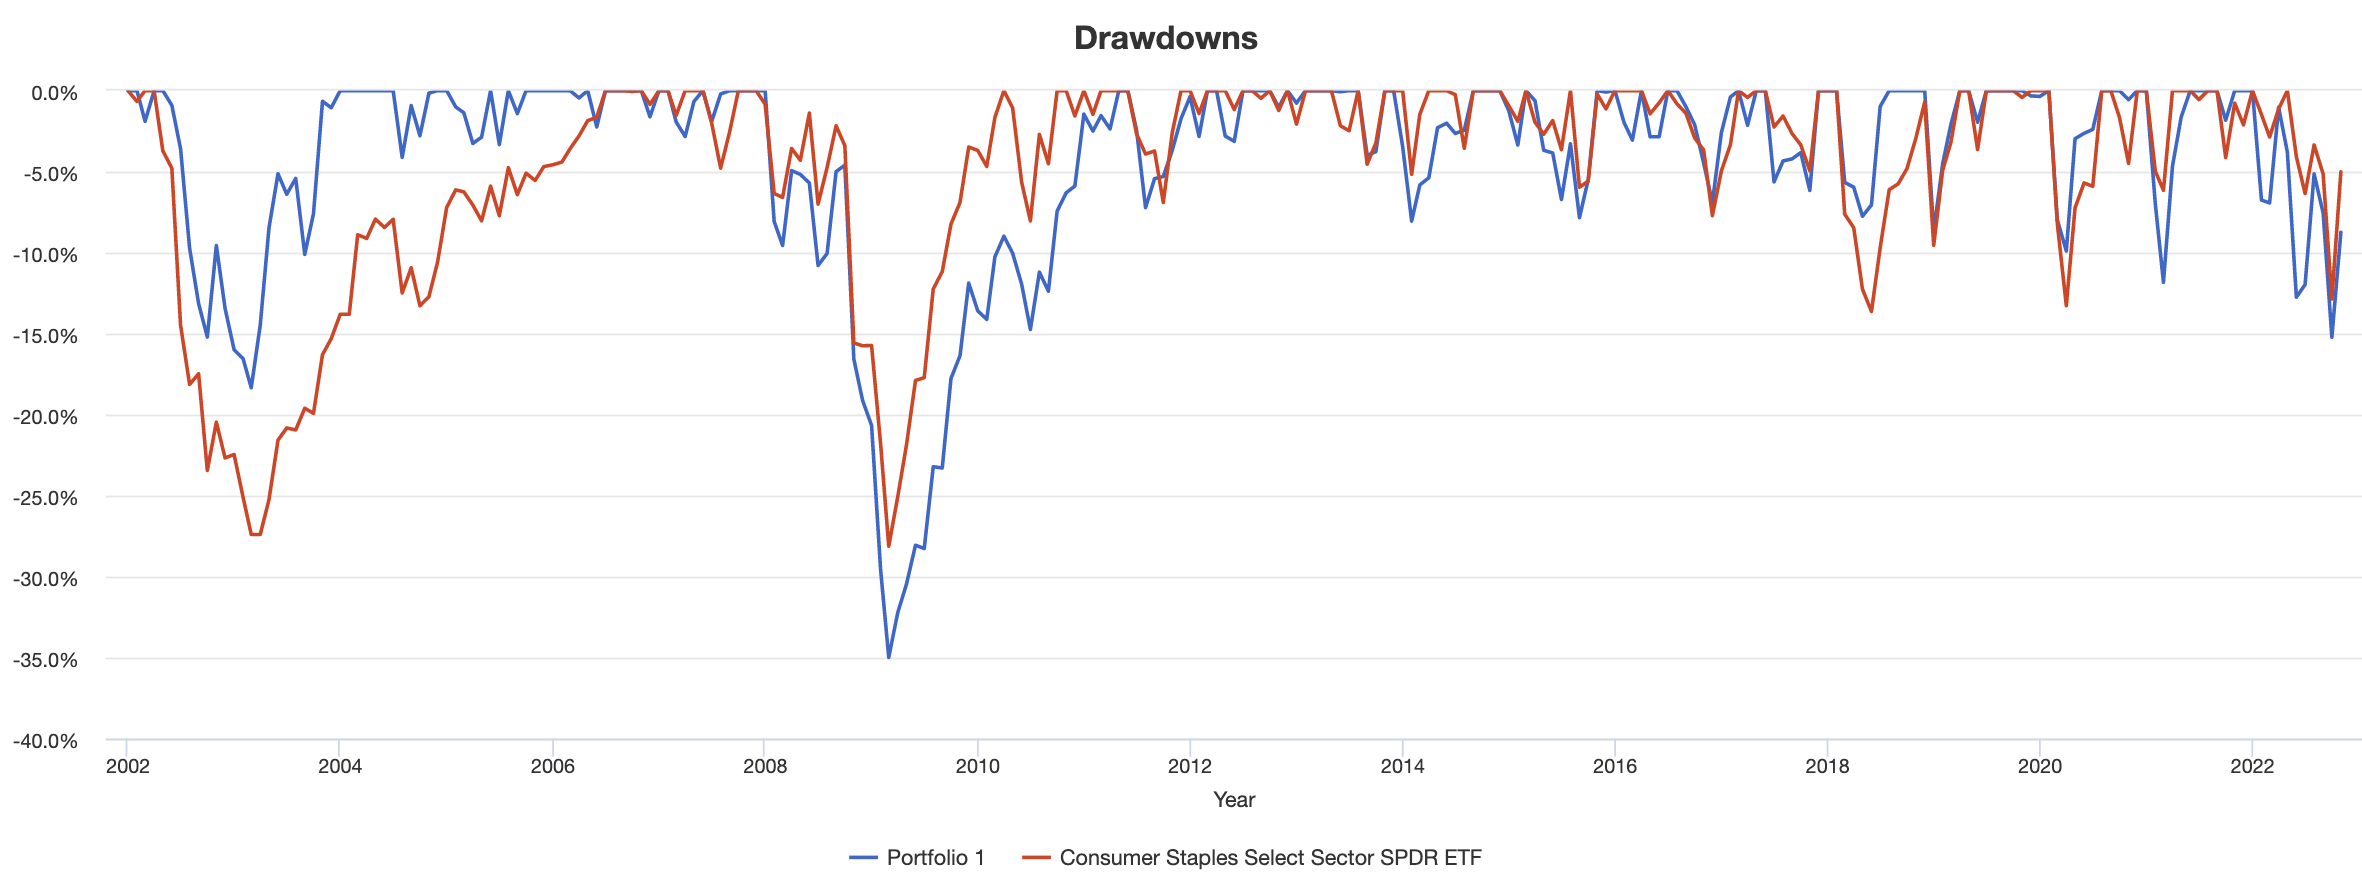
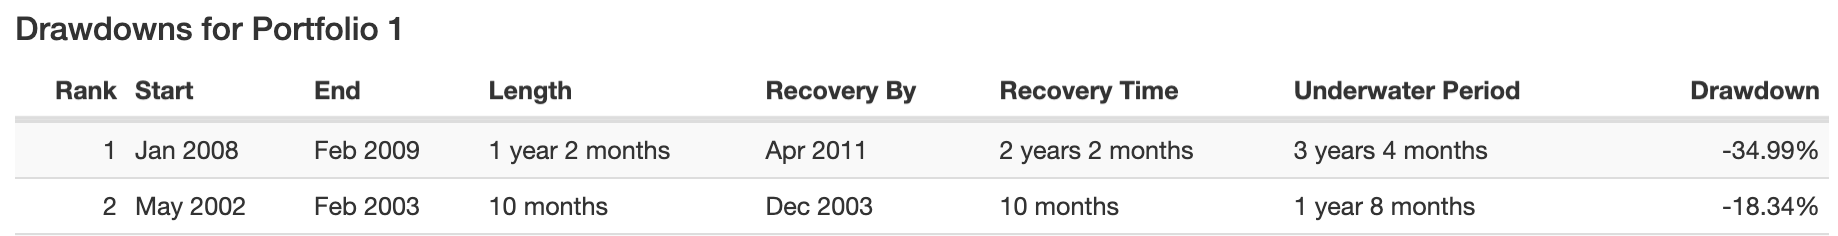
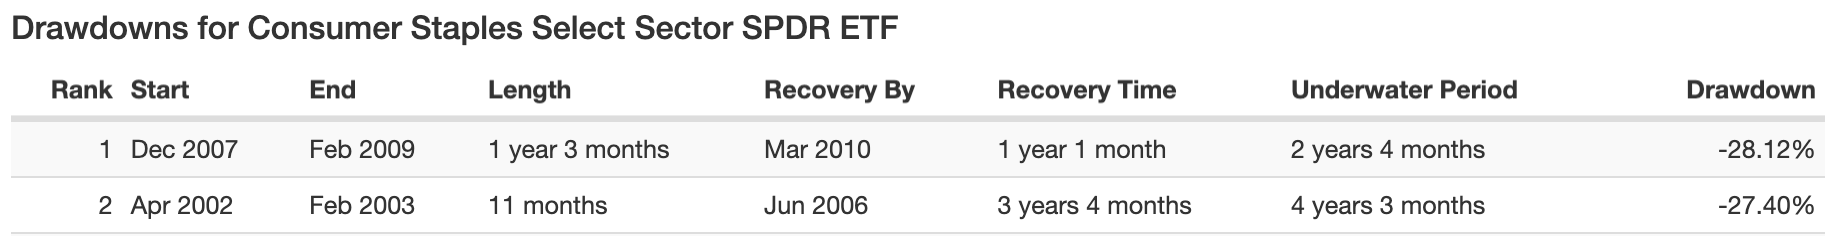
While the Great Recession produced a worse and longer drawdown for the 3-stock basket, the 2002-3 drawdown required a far longer recovery period for XLP. Viewed across the whole period, the drawdowns are fairly comparable between the two portfolios and help to show that as long as you’re willing to put up with slightly more volatility and accept the inherent single company risk of holding three blue-chip stocks, our 3-stock basket doesn’t carry significantly more drawdown risk than XLP over long periods of time.
For further evidence of that, in terms of annual performance, the 3-basket portfolio came out ahead of XLP in 14 out of last 21 years:
portfoliovisualizer.com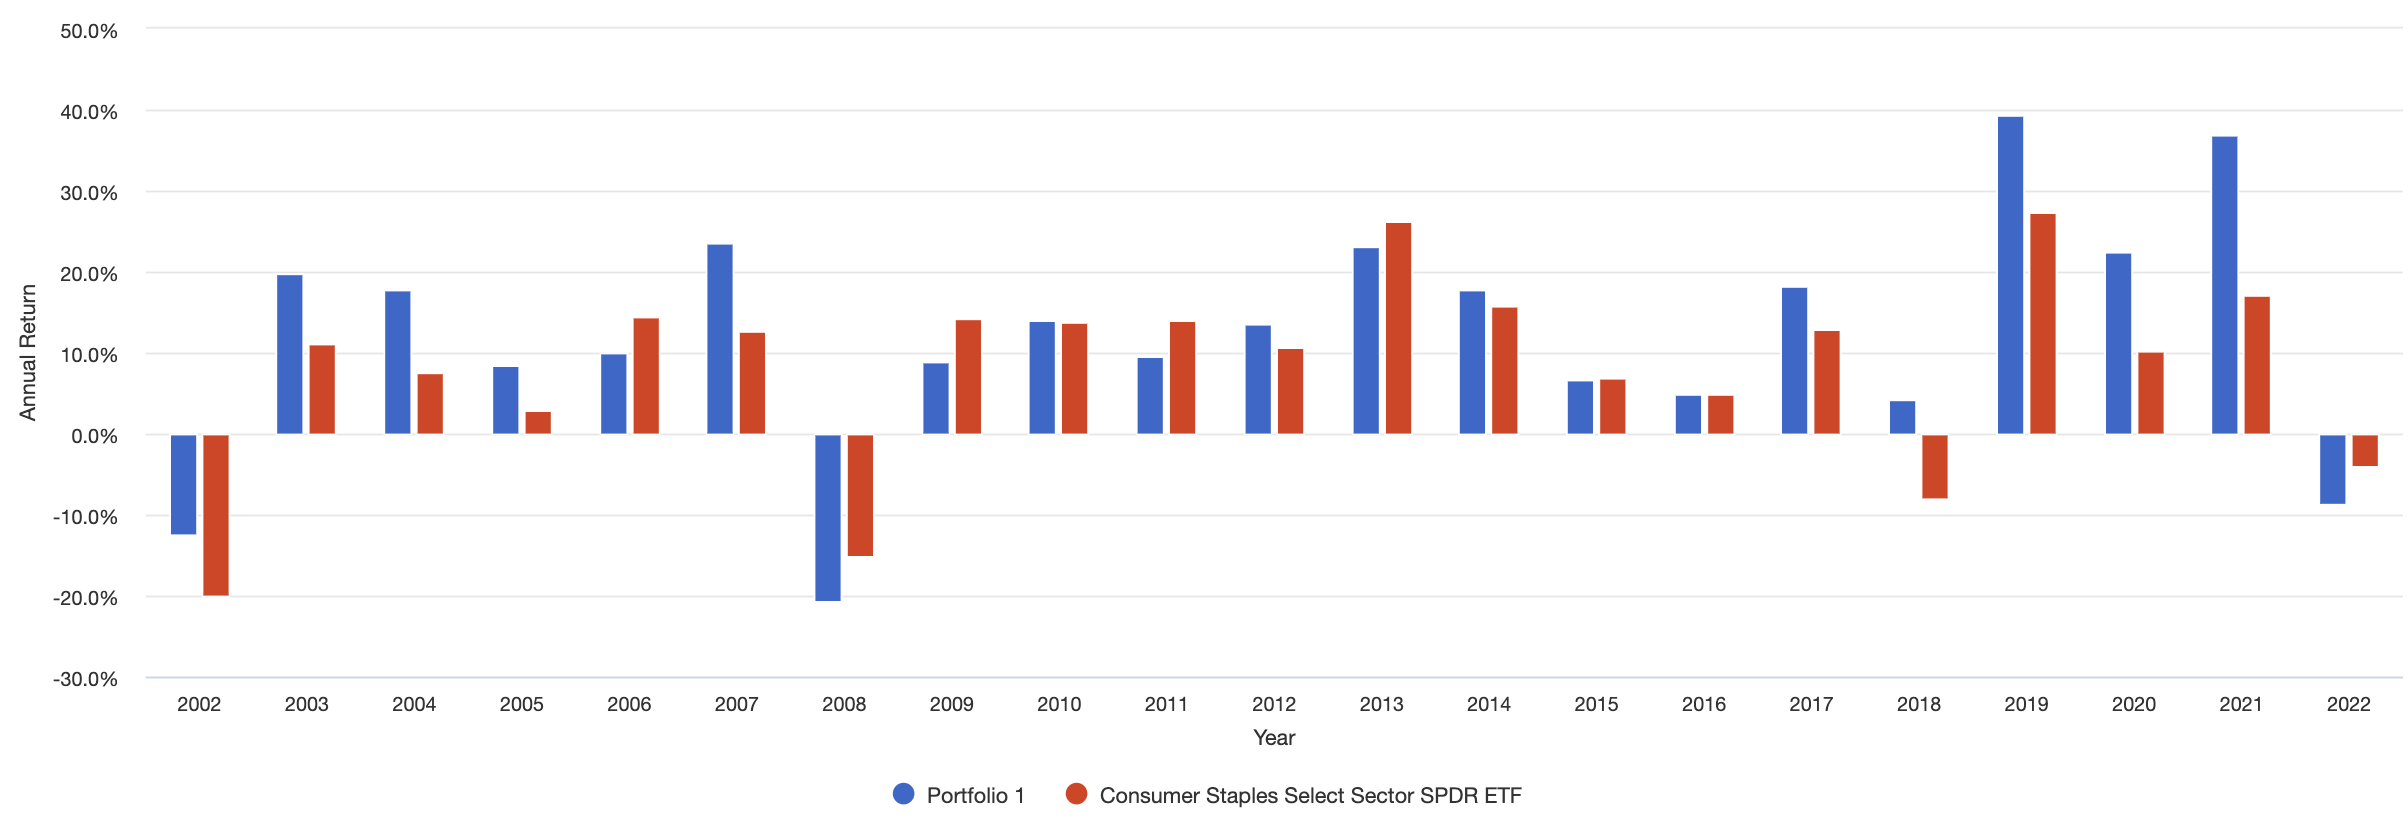
Next, let’s look at the income potential of our stock basket approach versus XLP. We’ve already noted that XLP’s 3-year dividend CAGR is a respectable 5.17%, and an equal-weighted portfolio of PG, PEP, and COST produces a combined yield of 1.88% with a 3-year dividend CAGR of 6.93%. However, it’s important to note that this yield will likely be significantly higher taking into account COST’s large special dividends that tend to be paid every few years.
To get a better sense of how the dividends might play out, over the last 20 years a $10,000 investment in XLP with DRIP would have produced the following dividend income:
XLP Income (portfoliovisualizer.com)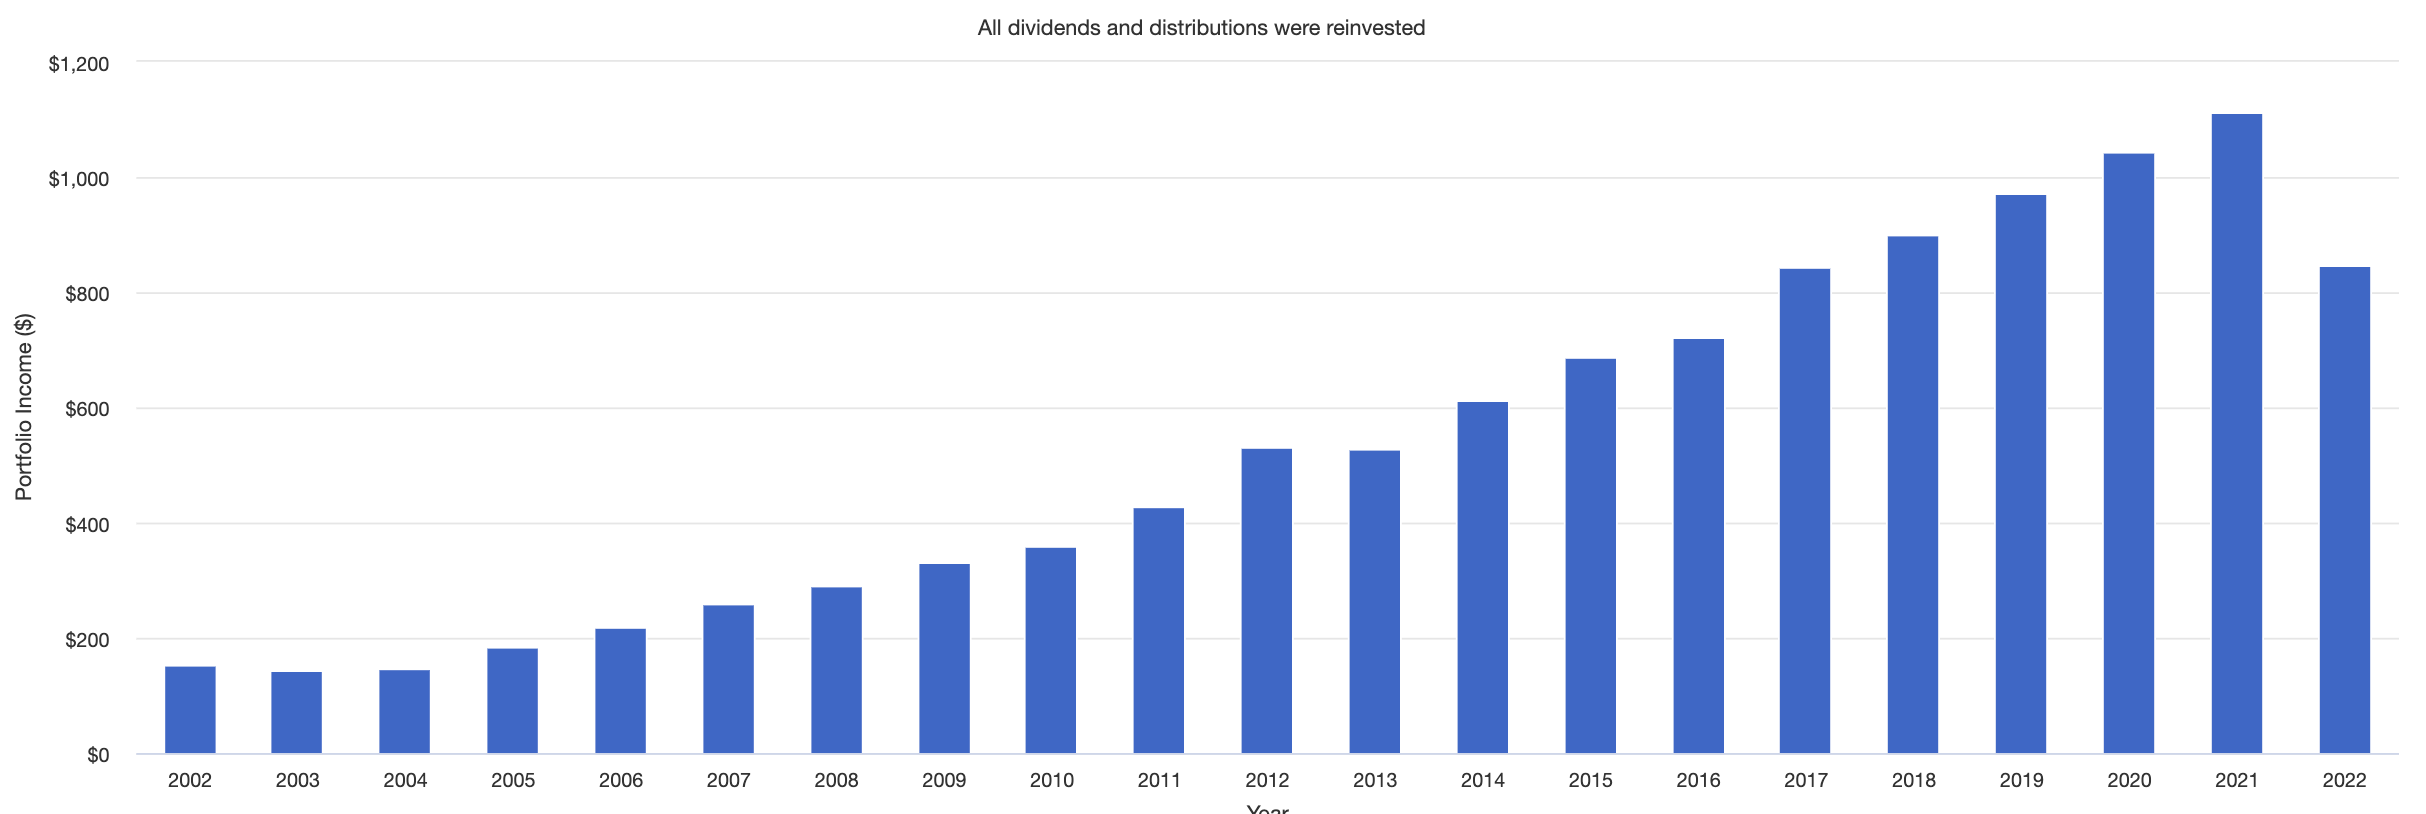
For an ETF this is a beautiful dividend curve, and one reason why I would wholeheartedly recommend XLP for exposure to the sector. But notice the Y-axis scale on this chart compared to the Y-axis on our 3-stock basket’s dividend chart:
portfoliovisualizer.com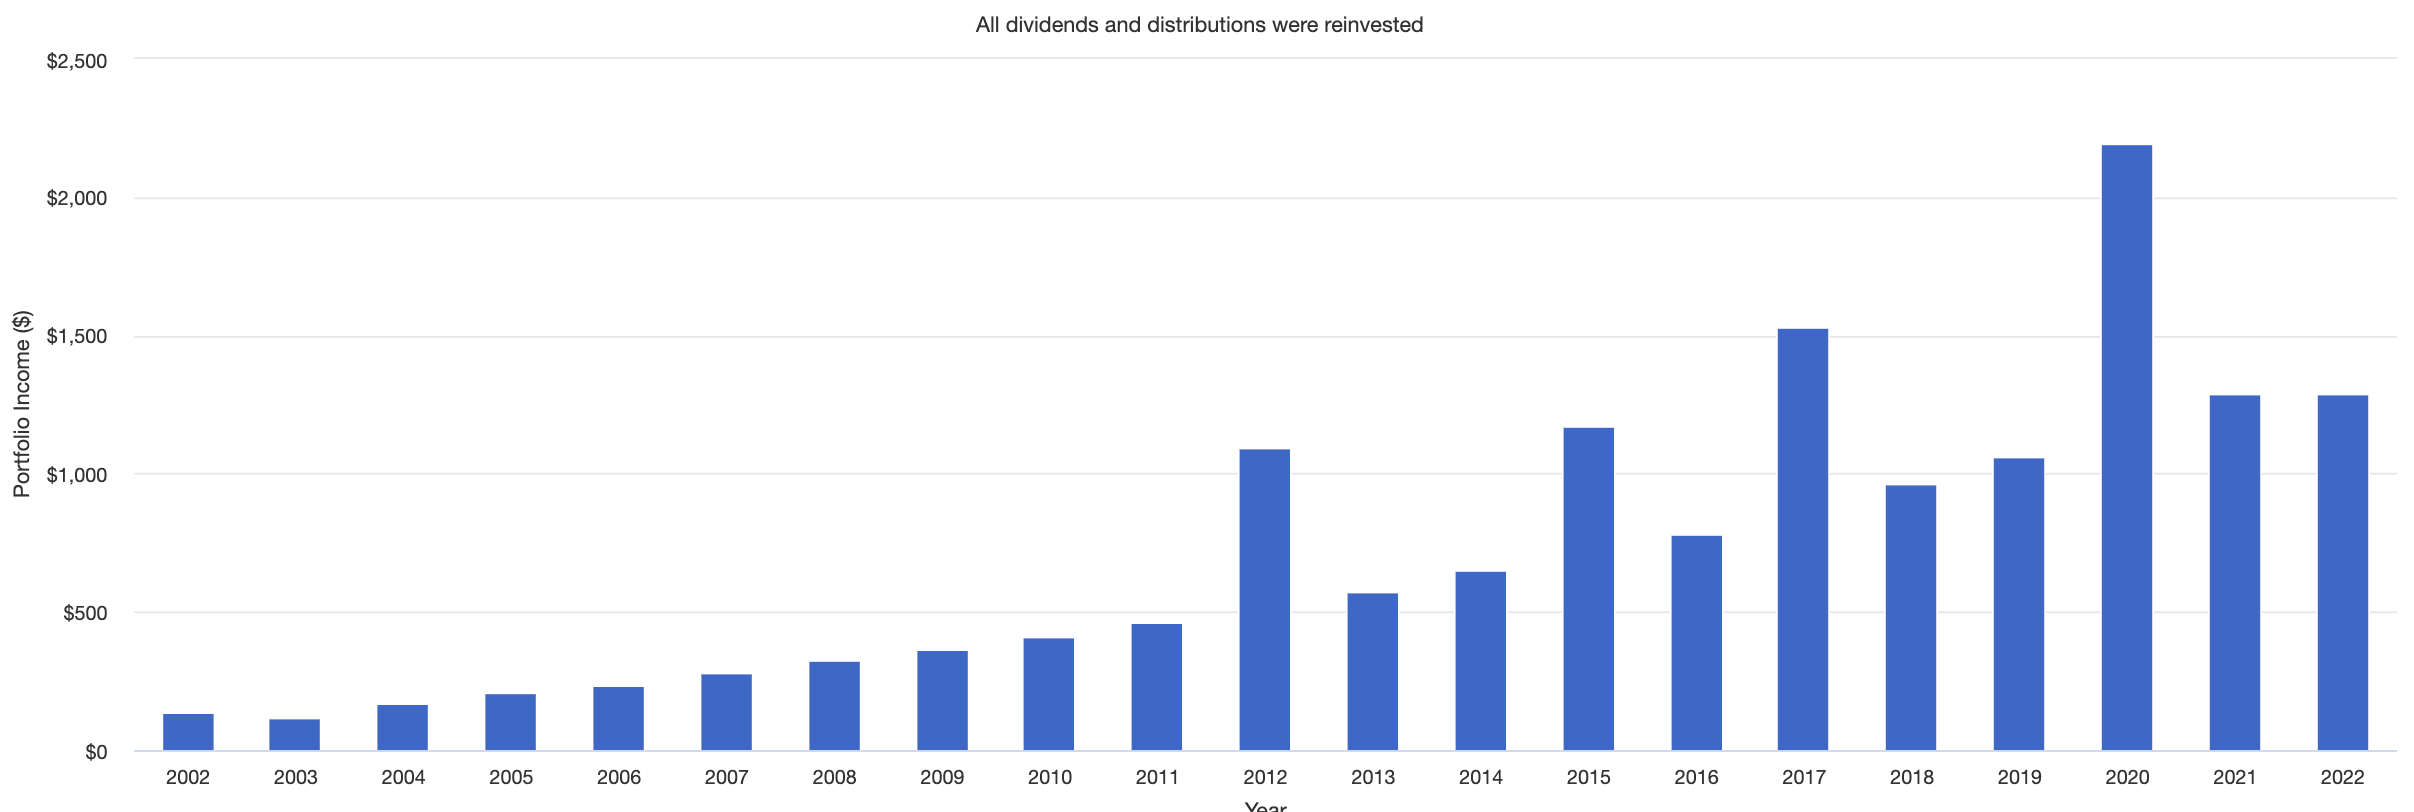
As always, the numbers don’t lie. From an initial investment of $10,000 in 2002:
Total dividend income for XLP = $11,316
Total dividend income for our 3-stock basket = $15,310
In summary, over the past 20 years our simple equal-weighted 3-stock basket of PG, PEP, and COST would have outperformed XLP by 100%, delivered 35% more dividend income, beaten it 2-to-1 in annual returns, and would have done so with better risk-adjusted returns. To me, this is the definition of alpha.
Conclusion
We all have our biases, and as an investor who likes to own stocks with predictable dividend growth and quality corporate management across my portfolio with few exceptions, I almost always prefer to buy a basket of individual stocks instead of a sector ETF. When I make an exception, its usually for short-to-medium-term swing trades where I want to bet on the movement of a sector or the overall market. However, I understand that many investors prefer the diversification that ETFs provide and/or might be unable to purchase individual stocks in their accounts.
Either way, XLP remains a strong, low cost ETF with the highest liquidity among its peers. Its top holdings are heavily weighted, which in this case is a great thing since they are four of the widest-moat blue-chip stocks in the market, and XLP’s dividend history bears out that its fund managers have done an excellent job delivering consistent dividend growth to investors through multiple challenging periods.
I rate XLP a hold at present due to the recent runup in price of its top holdings, and a buy on pullbacks when its yield surpasses 2.60%.
Be the first to comment