

In this article, we examine the significant weekly order flow and market structure developments driving XLE price action.
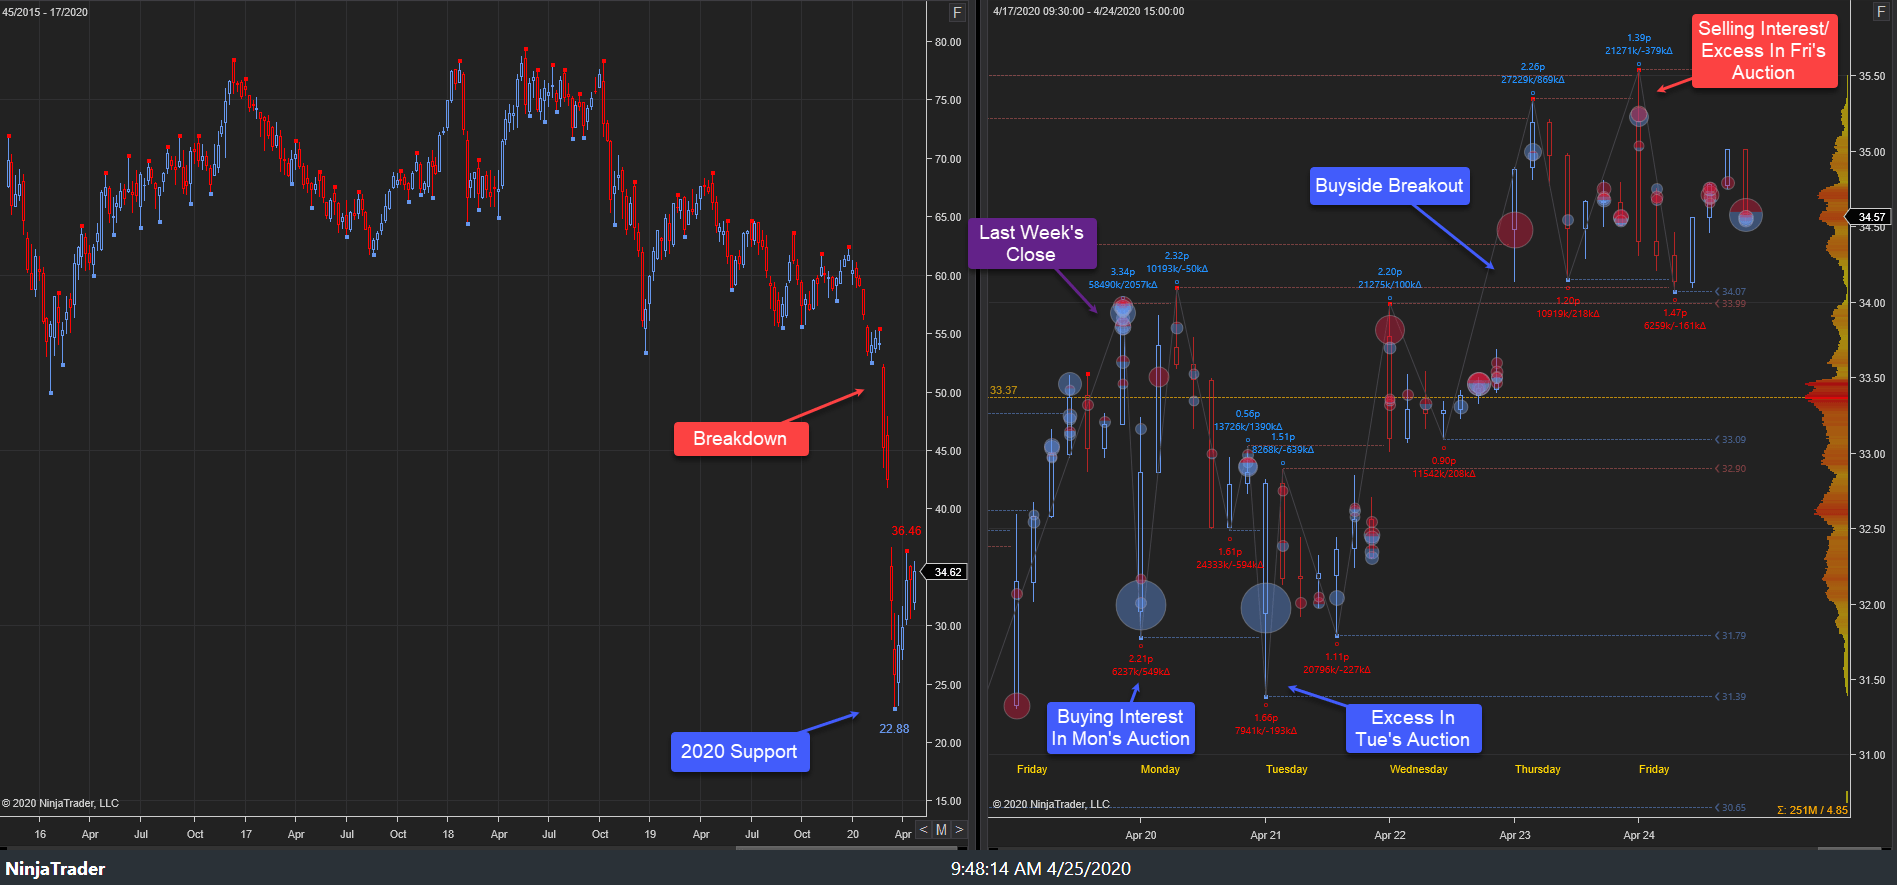
The primary expectation for this week’s auction was for price discovery higher, barring failure of 30.65s as support. This week’s primary expectation did play out as an early week pullback to 31.39s resulted in a buy excess in Tuesday’s trade. The rally ensued, driving price higher to 35.54s where selling interest emerged, halting the rally in Friday’s auction. A pullback ensued to 34.07s ahead of Friday’s close, settling at 34.62s.
20-24 April 2020:
This week’s auction saw price discovery lower to 31.77s in Monday’s trade as last Friday’s late buyers held the auction. Buying interest emerged there, driving price aggressively higher to 34.10s. Buyers trapped, 33.83s, amidst sell excess, as rotation lower developed to 32.48s before buying interest emerged into Monday’s close. Monday’s late buyers failed to hold the auction as the pullback developed, achieving the weekly stopping point low, 31.39s, in Tuesday’s trade. Buying interest emerged amidst buy excess, halting the pullback as balance ensued, 32.90s-31.79s, before buying interest emerged, 32.31s-32.55s, into Tuesday’s close.
Tuesday’s late buyers held the auction as rotation higher developed to 33.99s where selling interest emerged, developing balance higher, 33.99s-33.09s, into Wednesday’s close. Wednesday’s late sellers failed to hold the auction initially as a gap higher open developed in Thursday’s trade. The rally continued, achieving a stopping point, 35.35s, where sell excess emerged halting the rally. Balance developed, 35.35s-34.14s, within prior key supply into Thursday’s close. A failed probe higher developed early in Friday’s trade, achieving the weekly stopping point high, 35.54s. Selling interest emerged, 35.25s, amidst sell excess, halting the rally before a pullback ensued to 34.07s ahead of Friday’s close, settling at 34.62s.
This week’s auction saw a pullback early week to 31.39s where buy excess formed. A rally then ensued to 35.54s within key supply overhead where selling interest emerged into the week’s end. Within the larger context, the market formed a structural support, 22.88s, in the wake of the recent historic selloff. This week’s rally was a re-test of the first major resistance area, 36.50s, following the historic breakdown of March 2020.
Looking ahead, the focus into next week rests on response to this week’s key trade cluster, 35.54s-34.15s. Buy-side failure to drive price higher from this resistance will target key demand clusters below, 31.39s-30.65s/28.13s-27.09s, respectively. Alternatively, sell-side failure to drive price lower from key resistance will target key supply cluster above, 42s-44s, respectively. The highest probability path for next week is buy-side, barring 35.54s failing as resistance. The larger context now shifts neutral as XLE trades off fifteen-year lows.
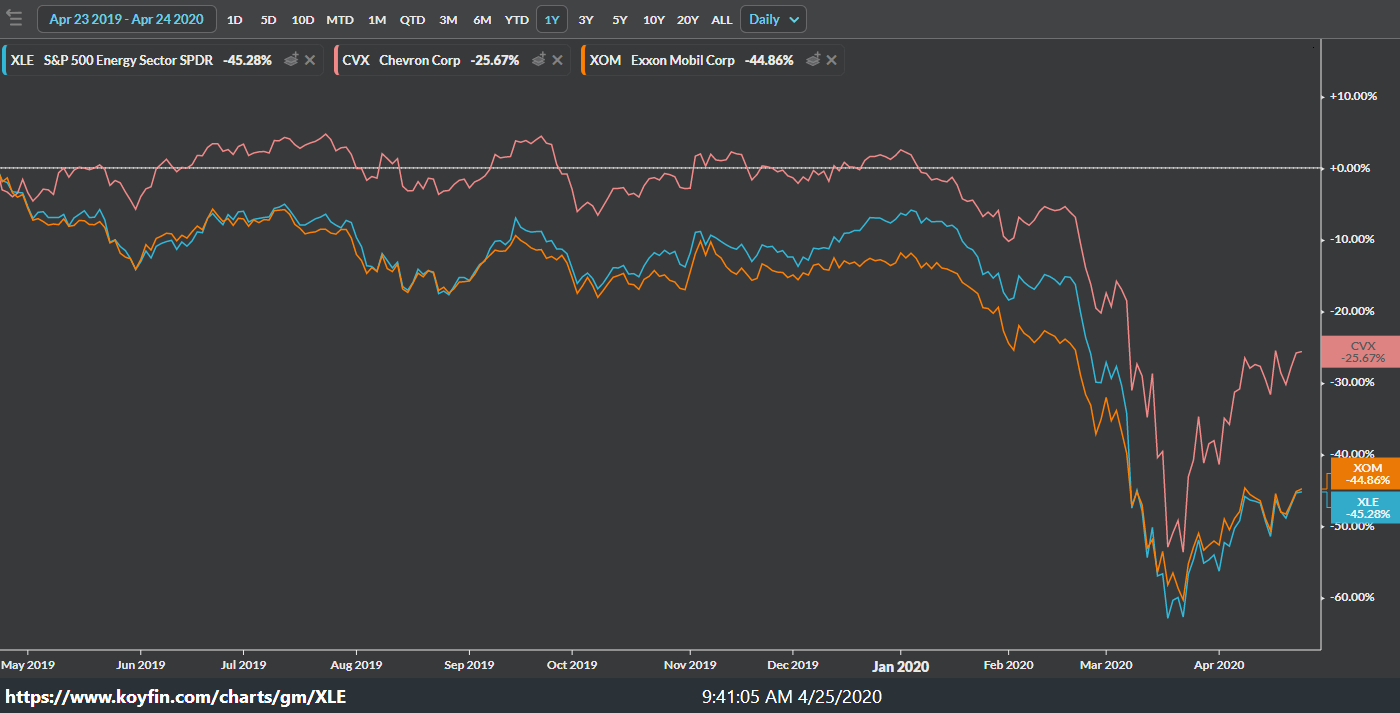
Looking under the hood of XLE, we see that its performance is really a tale of two stocks, Chevron (NYSE:CVX) and Exxon Mobil (NYSE:XOM). They account for approximately 24% and 23% of the entire ETF, respectively.
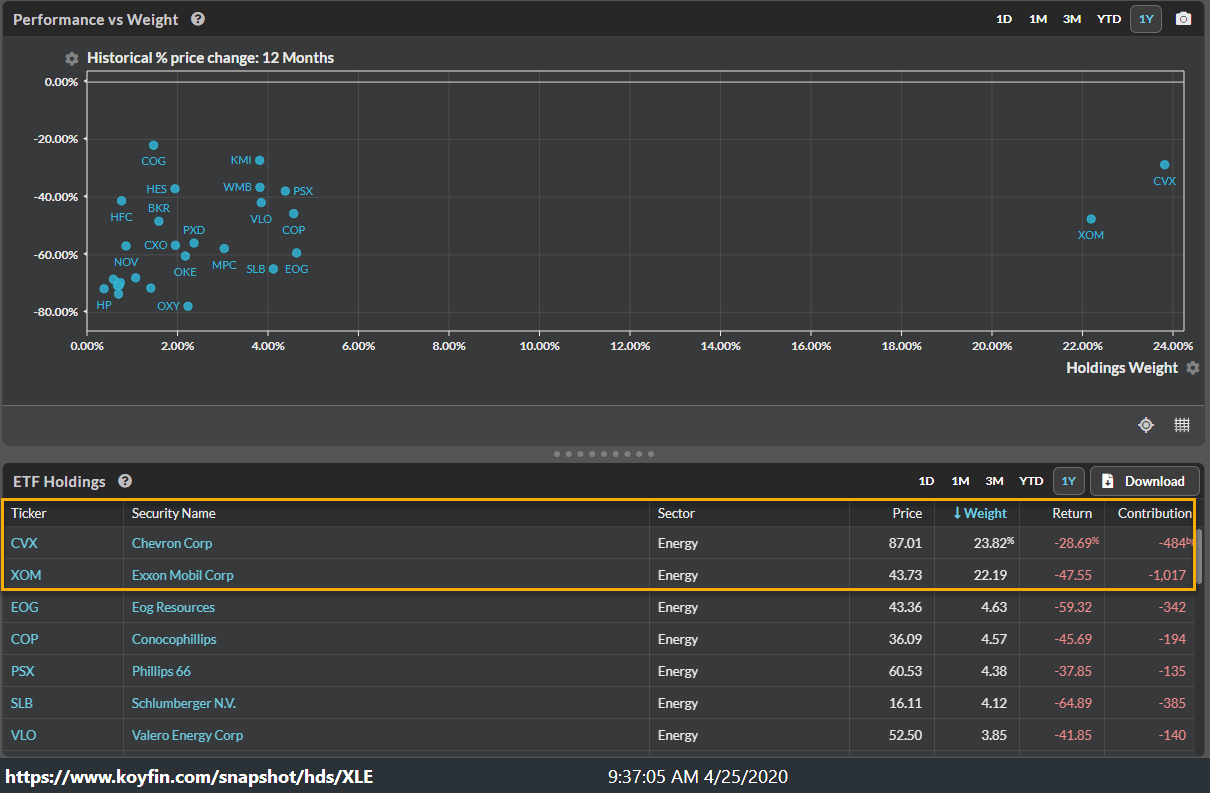
Further, their performance is responsible for -484bps and -1017bps, respectively, of the XLE’s current one-year performance. As go Chevron and Exxon, so goes the XLE.
It is worth noting that breadth, based on the S&P Energy Sector Bullish Percent Index, consolidated this week after trending higher in historic fashion following February-March’s historic collapse. Stocks more broadly, as viewed via the NYSE, see a similar posture. Asymmetric opportunity develops when the market exhibits extreme bullish or bearish breadth with structural confirmation. Currently, conditions favor a neutral posture as the market found structural support, 22.88s, near late 2003 support followed by a rapid and substantial relief rally to 36.82s. The market approaches major structural resistance as breadth is now once again in the bullish extreme zone. The support formed in March is likely a momentum low formed before a final price low.
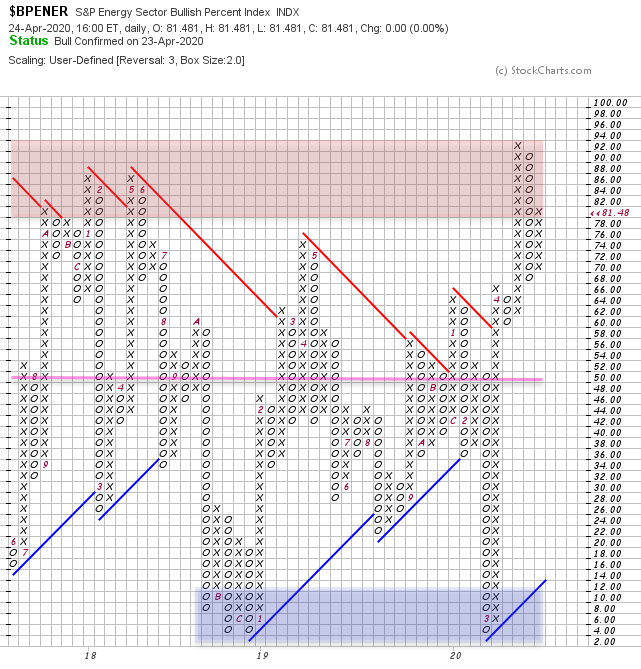
The market structure, order flow, and breadth posture will provide the empirical evidence needed to observe where asymmetric opportunity resides.
Disclosure: I/we have no positions in any stocks mentioned, and no plans to initiate any positions within the next 72 hours. I wrote this article myself, and it expresses my own opinions. I am not receiving compensation for it (other than from Seeking Alpha). I have no business relationship with any company whose stock is mentioned in this article.
Be the first to comment