

Schroptschop/E+ via Getty Images
Investment thesis: the Materials Select Sector SPDR ETF (NYSEARCA:XLB) is a hold. Although the economic environment is positive, the chart is likely at a short-term top.
Due to the rise of data showing that active management performs poorly over the long term, investors now use ETFs as the backbone of most portfolios. These funds allow investors to target broad sectors of the market. The XLB from State Street Global Advisers is one such ETF.
Here are the fund’s broad goals:
- The Materials Select Sector SPDR® Fund seeks to provide investment results that, before expenses, correspond generally to the price and yield performance of the Materials Select Sector Index (the “Index”)
- The Index seeks to provide an effective representation of the materials sector of the S&P 500 Index
- Seeks to provide precise exposure to companies in the chemical, construction material, containers and packaging, metals and mining, and paper and forest products industries
- Allows investors to take strategic or tactical positions at a more targeted level than traditional style based investing
Here are the 10 largest holdings:
XLB 10 largest holdings (State Street Global Advisors)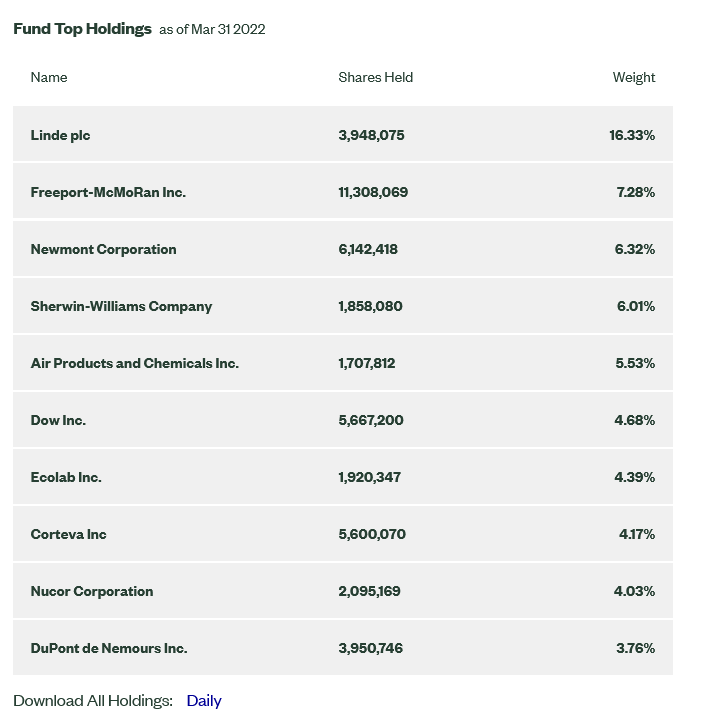
My standard method of analyzing a sector-specific ETF is to first look at the macroeconomic background to determine if the sector is expanding or contracting. I then compare the ETF’s performance to a group of peers followed by an analysis of the ETF’s charts.
Prices for four basic commodities (FRED)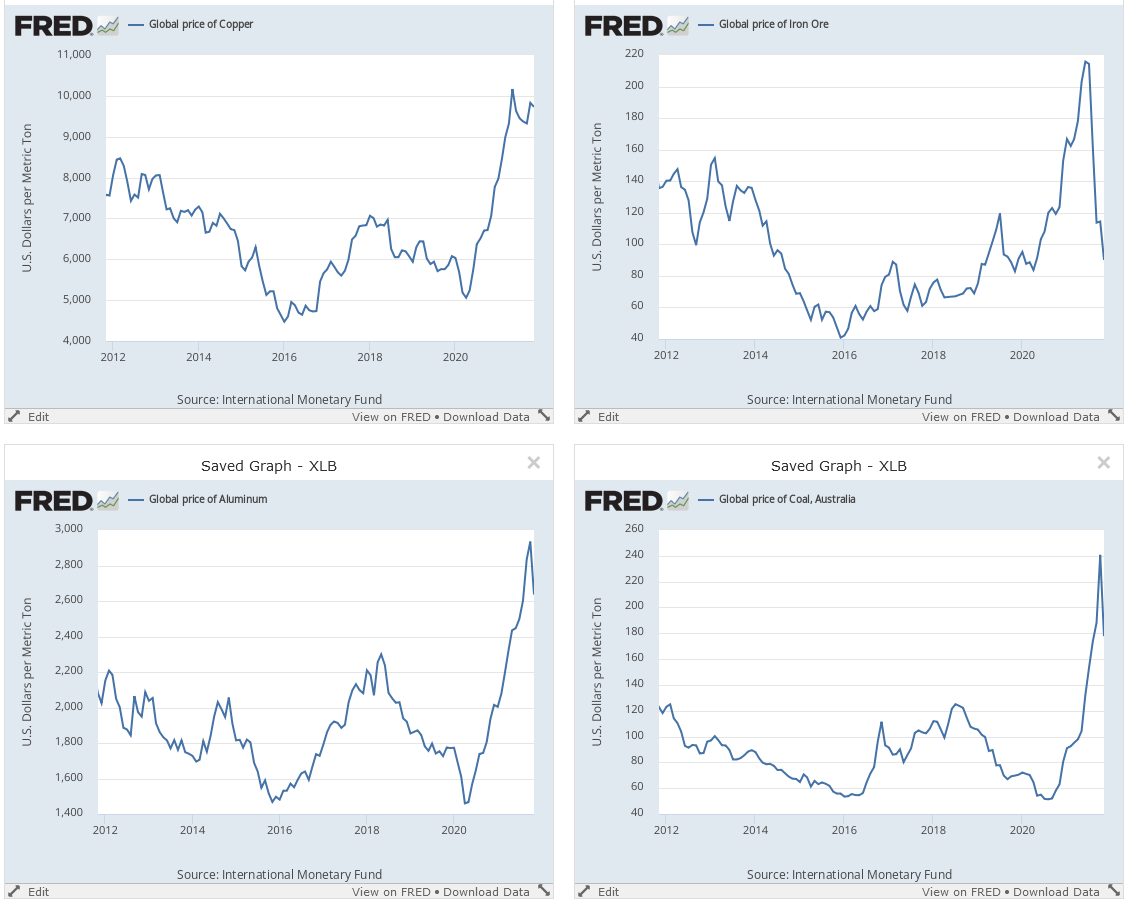
Generally speaking, commodity companies still have pricing power. While the above charts show that prices are off of recent highs, they are still high in most cases.
New orders for durable goods (FRED)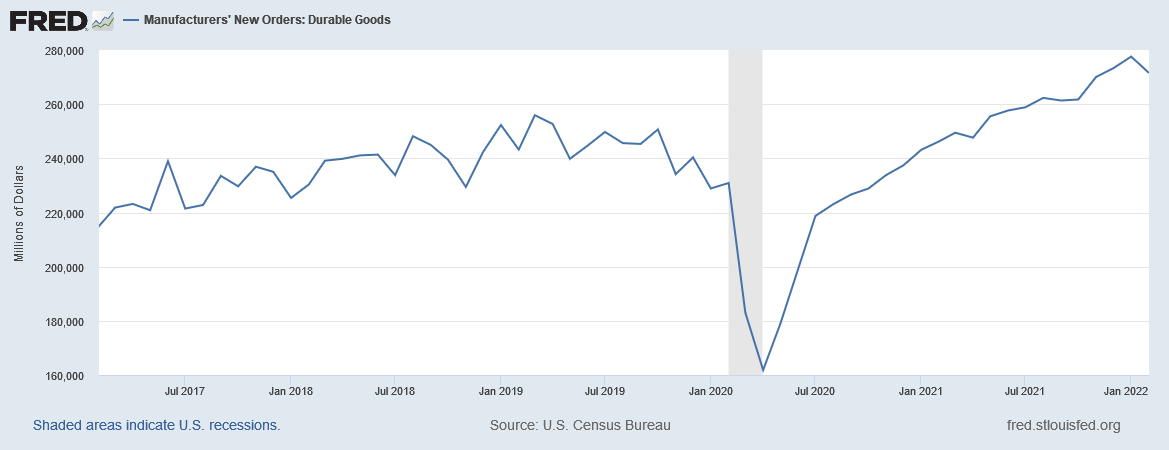
New orders for durable goods (which are built with “basic materials”) are just shy of a 5-year high.
Industrial production and capacity utilization (FRED)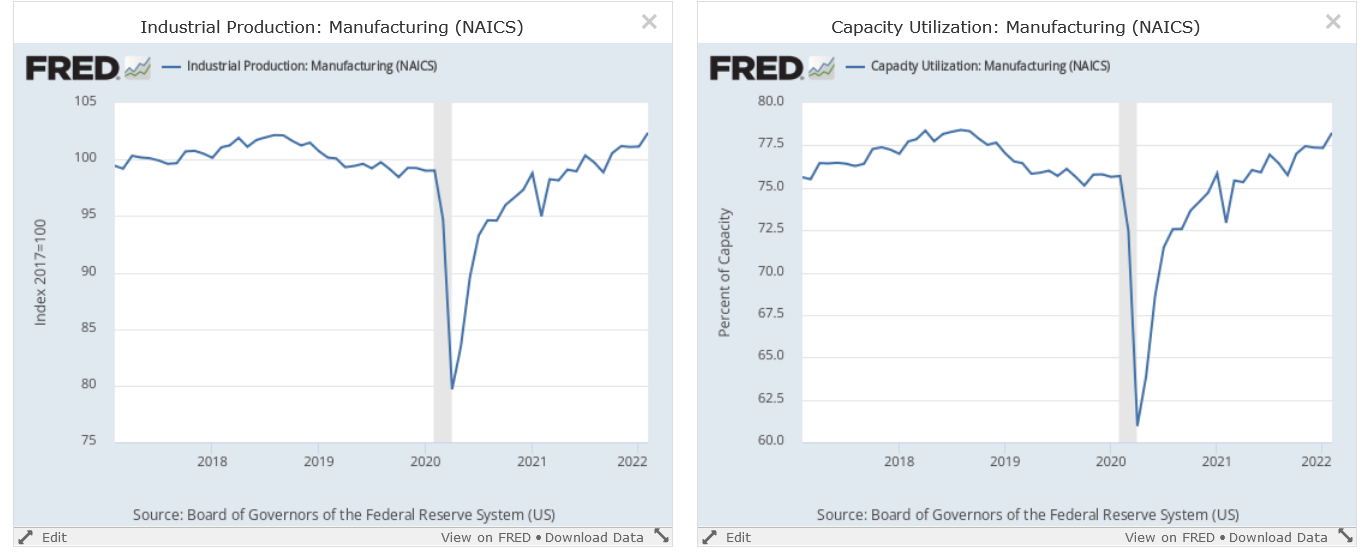
Industrial production (left) has regained all its recession losses, as has capacity utilization (right).
The industrial sector’s environment is strongly bullish (the author has written permission to use the latest ISM report in his writing):
Fiore continues, “The U.S. manufacturing sector remains in a demand-driven, supply chain-constrained environment. In March, progress was made to solve the labor shortage problems at all tiers of the supply chain, which will result in improved factory throughput and supplier deliveries. Panelists reported lower rates of quits and early retirements compared to previous months, as well as improving internal and supplier labor positions. March brought back increasing rates of price expansion, due primarily to instability in global energy markets. Suppliers are not waiting to experience the full impacts of price increases before negotiating with their customers. Panel sentiment remained strongly optimistic regarding demand, with six positive growth comments for every cautious comment, down from February’s ratio of 12-to-1.
The economic backdrop for the XLB is positive.
Next, let’s compare the XLB’s performance to that of its broad, industry-tracking peers (which are the XLC, XLE, XLF, XLI, XLK, XLP, XLU, XLV, XLY, and VNQ; 11 total):
| Week | 1-Month | 3-Months | 6-Months | 1-Year | |
| XLB’s relative performance | 8th | 2nd | 4th | 4th | 7th |
Data from Finviz.com
The overall performance is decent in the intermediate-term but weaker in the most recent.
Finally, here is the technical data:
XLB RRG chart (Stockcharts)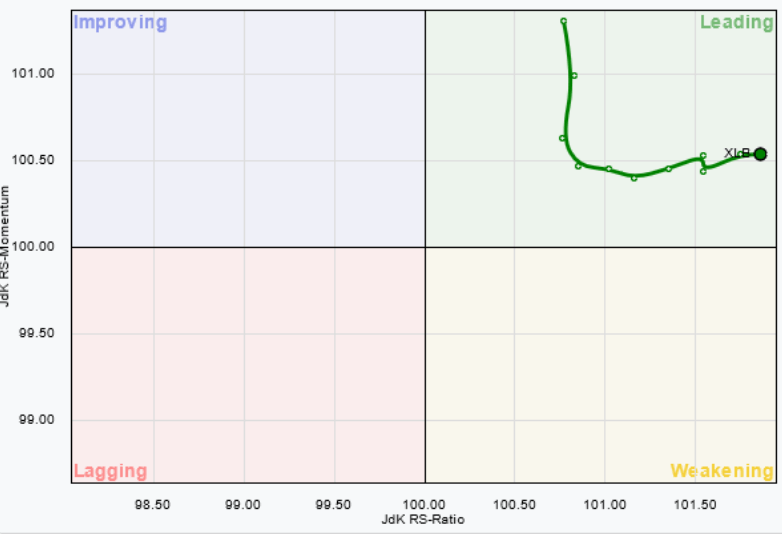
The XLB is currently leading the SPY. But securities traditionally cycle clockwise through the RRF chart, which means we should expect the XLB to move into the weakening quadrant in the next 6-8 weeks.
XLB weekly and daily chart (Stockcharts)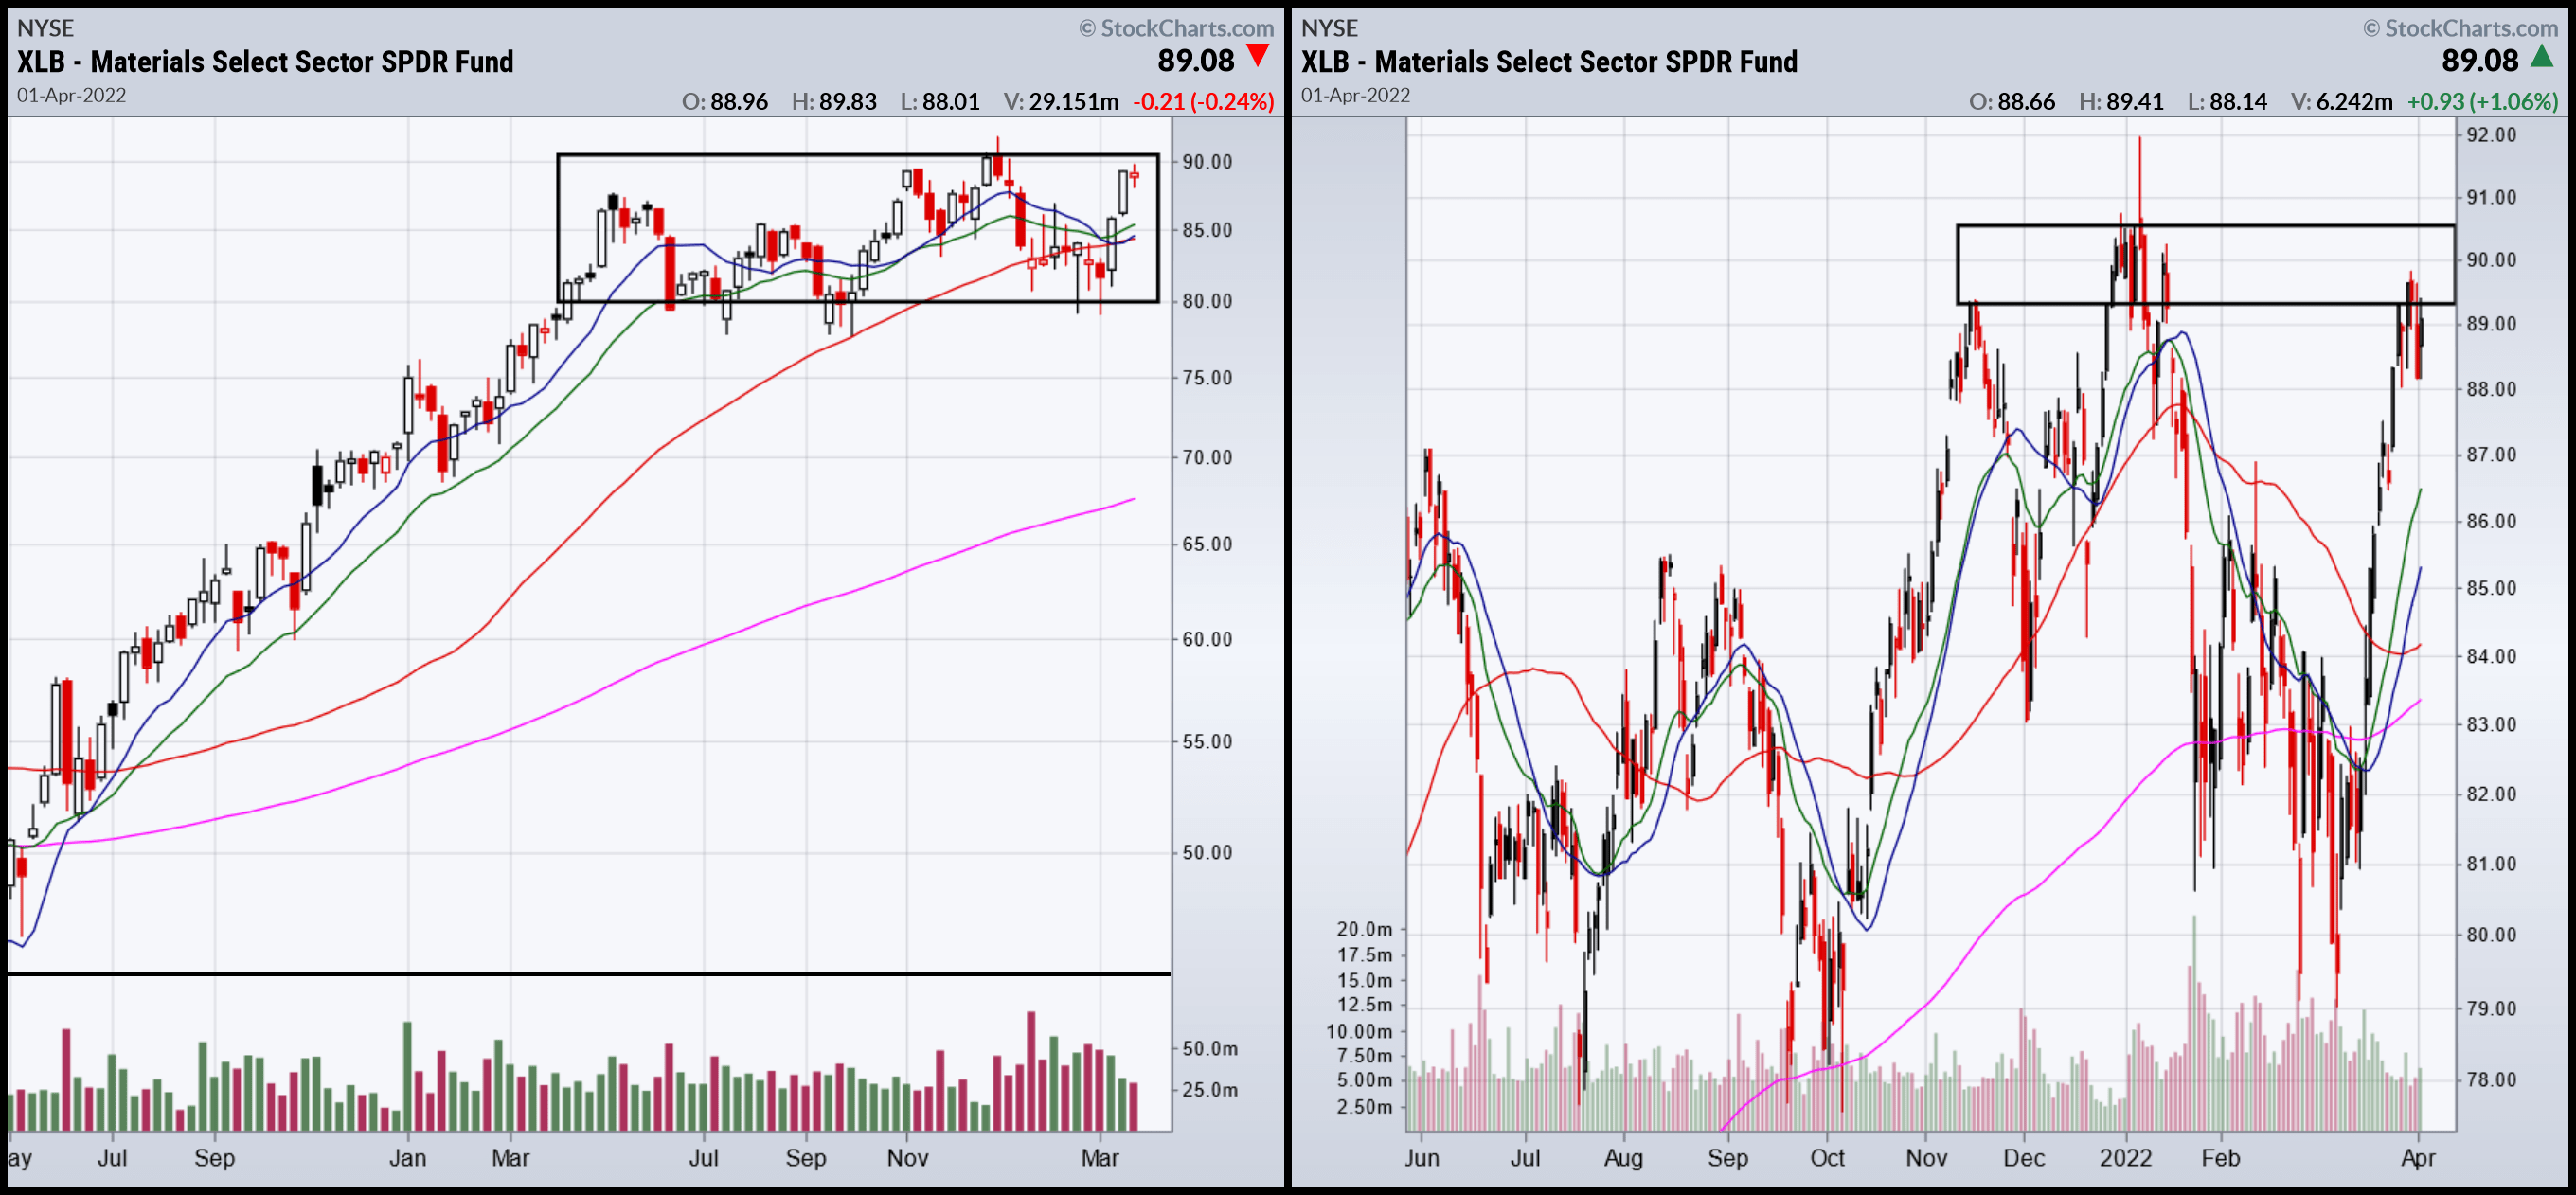
The XLB is trading at the top of a trading range which is shown on both the weekly (left) and daily (right) charts.
The XLB is a hold: while the macroeconomic data is positive, the RRG and price charts indicate the XLB is likely at a short-term peak. We can reasonably expect it to return to the lower 80s in the next 2-4 months.
Be the first to comment