


vitranc
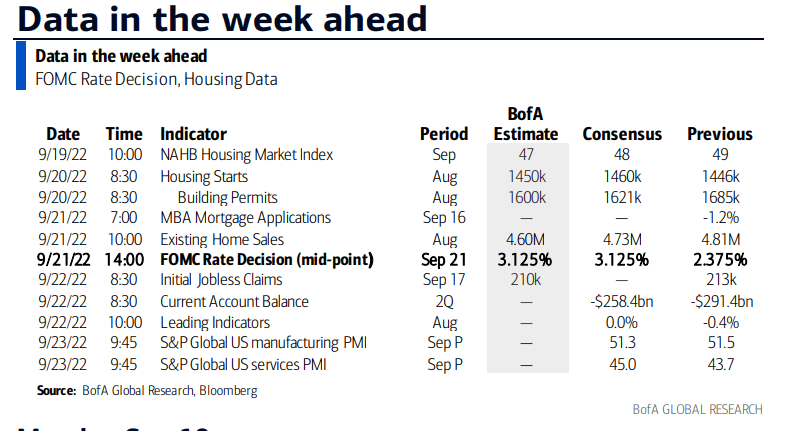
This is a big week for housing. While the Fed captures the spotlight on Wednesday, there will be a host of housing data points in advance of the FOMC announcement.
Stacked Housing Data Deck
BofA Global Research
Kicking things off on Monday, we’ll get the National Association of Home Builders Market Index gauge, a September snapshot, at 10 am ET. Housing Starts along with Building Permits numbers come out Tuesday morning. Finally, Existing Home Sales figures from the National Association of Realtors for August come Wednesday during the trading day.
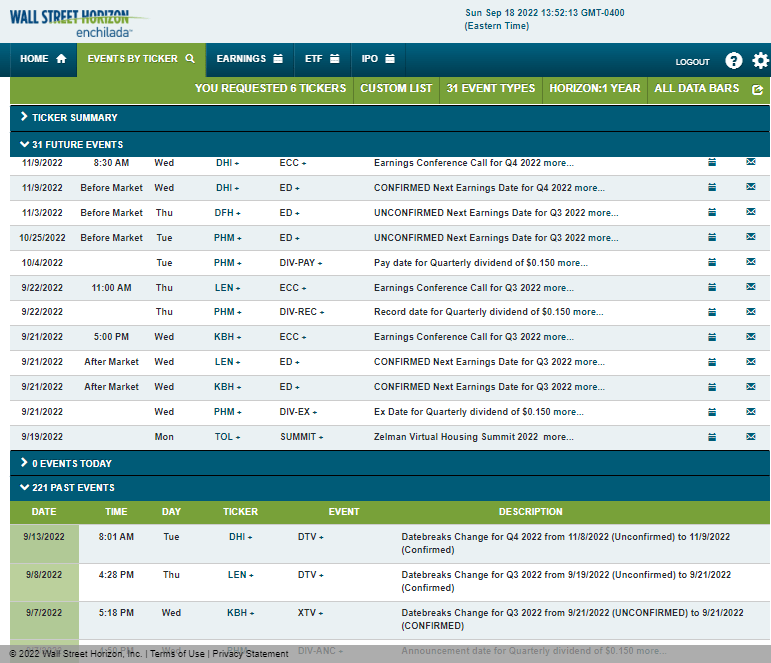
Moreover, a pair of key homebuilder companies report quarterly results this week: KB Home (KBH) and Lennar Corp. (LEN). The corporate event calendar from Wall Street Horizon also shows potential market-moving news via the Zelman Virtual Housing Summit 2022 conference from Sept. 19 to 23 at which Toll Brothers, Inc. (TOL) management is expected to speak.
Two Industry Earnings Reports On Tap
Wall Street Horizon
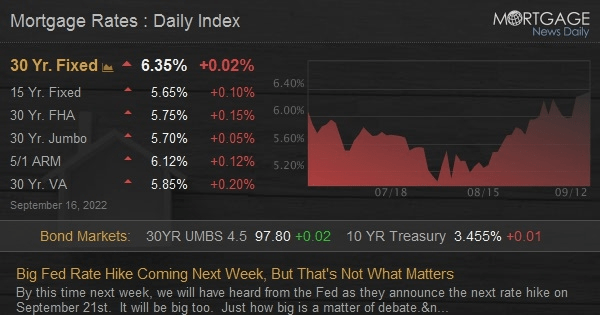
It was just last week when the average 30-year fixed rate mortgage notched fresh 14-year highs above 6.3%, according to Mortgage News Daily.
Sky High Mortgage Rates
Mortgage News Daily
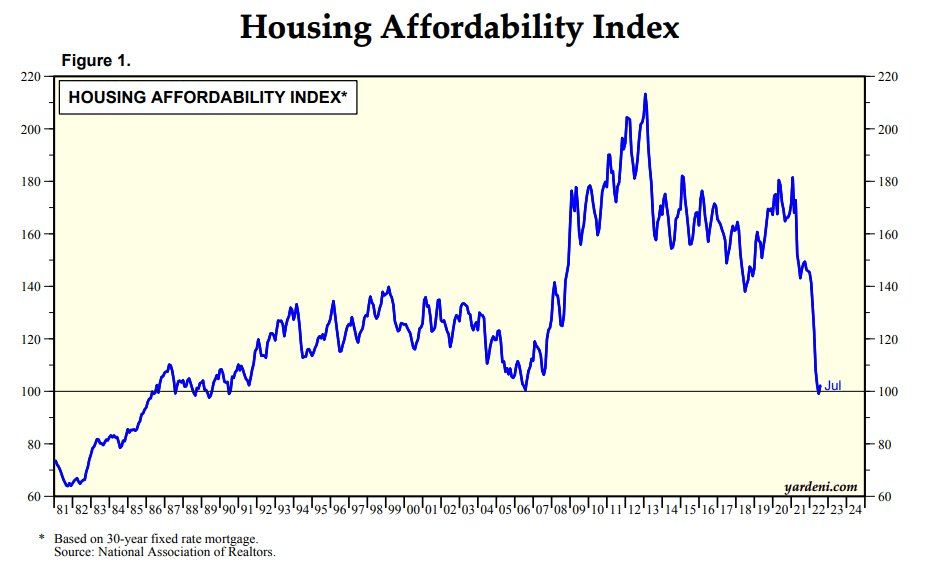
Higher rates and still rising home values have led to a crushing trend in Housing Affordability. The National Association of Realtors reports for July that buying a home, for the typical American family, is near the most out of reach it has been since 1990, though the barometer did bounce up a fraction for the most recent month. Mortgage applications have been falling since January and are now tracking below 2019 levels, per BofA.
Housing “Unaffordability” Index
Yardeni Research
Let’s home in on one of the bellwether niches of the domestic equity market: homebuilders. The SPDR Homebuilders ETF (NYSEARCA:XHB) is down by nearly a third so far in 2022 as pessimism around higher interest rates gained steam following frustrating supply chain issues earlier this year.
Year-to-Date ETF Performance Heat Map: XHB Among the Biggest Losers
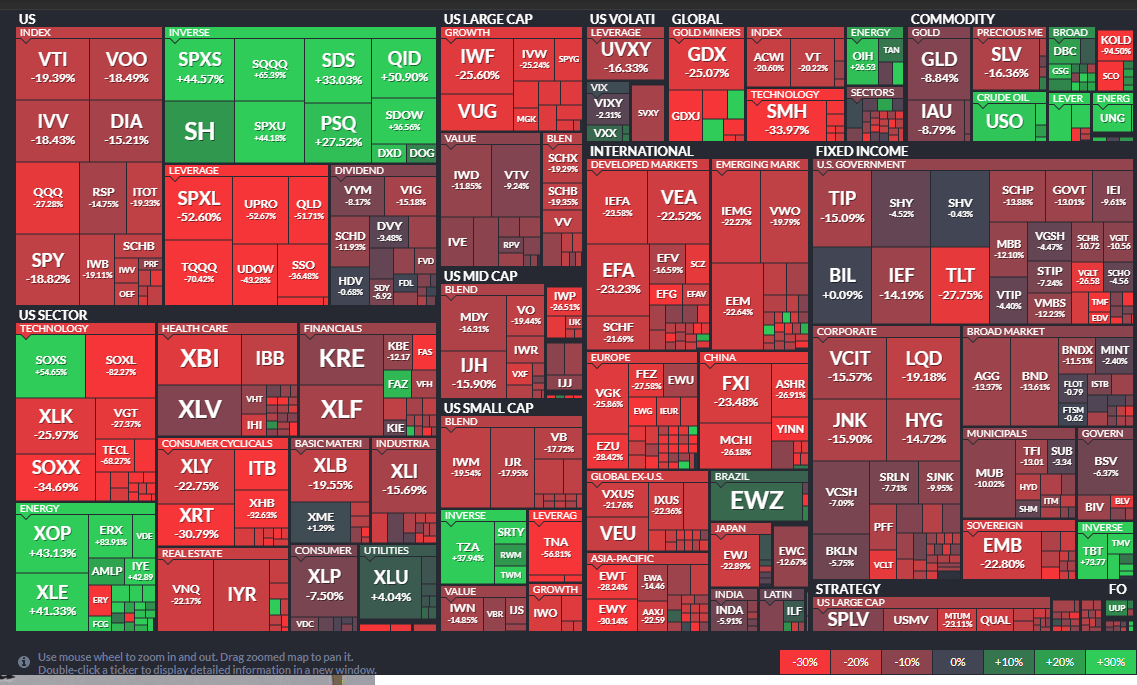
Finviz
According to SSGA Funds, XHB seeks to track a modified equal-weighted index which provides the potential for unconcentrated industry exposure across large-, mid-, and small-cap stocks. XHB has a weighted average market cap of $26.4 billion compared to rival fund, the iShares U.S. Home Construction ETF’s (ITB) $31.6 billion average size.
XHB has just 35 positions, and the fund’s trailing 12-month price-to-earnings ratio is just 8.7 while the P/E using forward earnings estimates is 7.8. Considering projected EPS growth of more than 15%, the resulting PEG ratio appears very attractive to value investors.
The problem is a dire outlook for companies exposed to a severely slowing real estate market. Bank of America Global Research expects the group’s gross margins to peak this year and compress through at least 2024 – that will undoubtedly hurt profits.
Homebuilder Margin Compression Expected
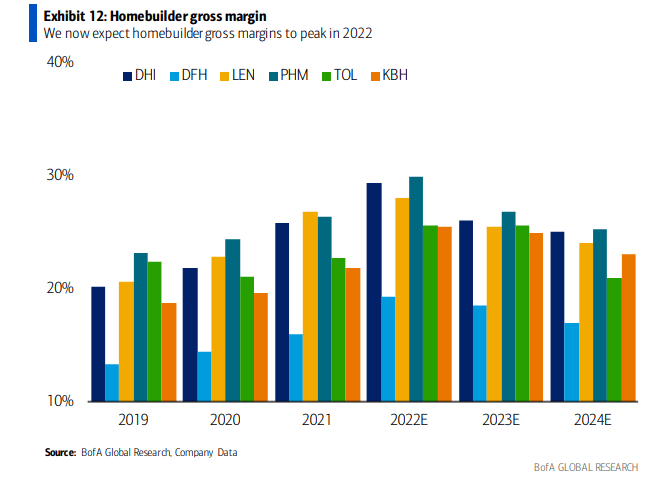
BofA Global Research
The Technical Take
With an uncertain valuation given high earnings skepticism but a low P/E, what does the chart say about XHB? I see it in no man’s land right now.
Notice how the ETF peaked in February 2020 just short of $50. Following a more than 50% plunge during the Covid Crash, shares surged to all-time highs above $86 late last year.
It’s been a rough ride since then, though. XHB cratered 40% to a low in June but then failed to climb above resistance at $69 during the summer rally. Then just last week, the fund printed a bearish engulfing pattern, as so many indices did.
I would hold off on buying XHB until we get back to the low $50s. A long position there with a stop under $49 would make sense. On the upside, a breakout above $69 would be a bullish sign that new highs could be in play.
XHB: A Retest In Play?
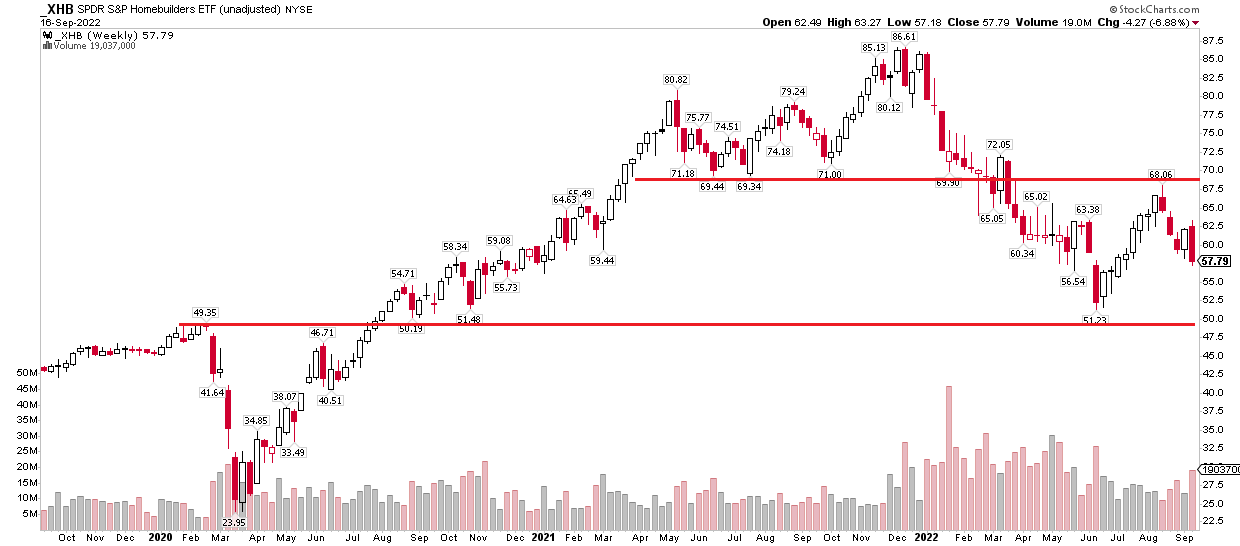
StockCharts
The Bottom Line
Expect more volatility this week as a slew of housing data crosses the wires and we hear quarterly results from two major U.S. home building companies. The XHB homebuilders ETF might look to retest the June lows after pulling back from resistance in August.
Be the first to comment