

Solskin
Investment Summary
As we continue to look towards the new year and reposition for the future, we’ve revisited all of our healthcare longs in order to gauge price visibility looking ahead. Here we turned to Xenon Pharmaceuticals Inc. (NASDAQ:NASDAQ:XENE), a long-term compounder that’s survived the last 5-years of trade as a high-Sharpe, low-vol generator within equity portfolios.
After adding to our XENE position extensively throughout 2020 and 2021, we had been right to lay patiently for the bulk of this year. Still, whilst the broad indices are down anywhere from 9-20% in FY22, XENE has swum upstream against the tide and continued adding to its equity gains.
The question now turns to whether the stock can continue its now 5-year rally, where it’s climbed over 1,252% in that time. After its latest set of numbers we were a little cautious when XENE missed consensus estimates at the top and bottom lines; hence, I’m back here today to reveal our latest technical findings on the stock, to guide investors on positioning in XENE looking ahead. We’ll run through a series of charts, outlaying the technical side to the XENE investment debate in doing so. Net-net, we continue to rate XENE a buy, seeking technically derived price objectives to $48.50.
Exhibit 1. XENE price evolution since FY17. Note the long-term ascending base formed over this time, with constant test-retest at support, pulling away to the upside each time.
Key observations from long-term charting:
- Each impulse in price swing with less depth/spike
- Plenty of wiggle room before price action pulls back to long-term support
- Moving averages remain bullish
- Relative strength at all-time highs.
Data: Updata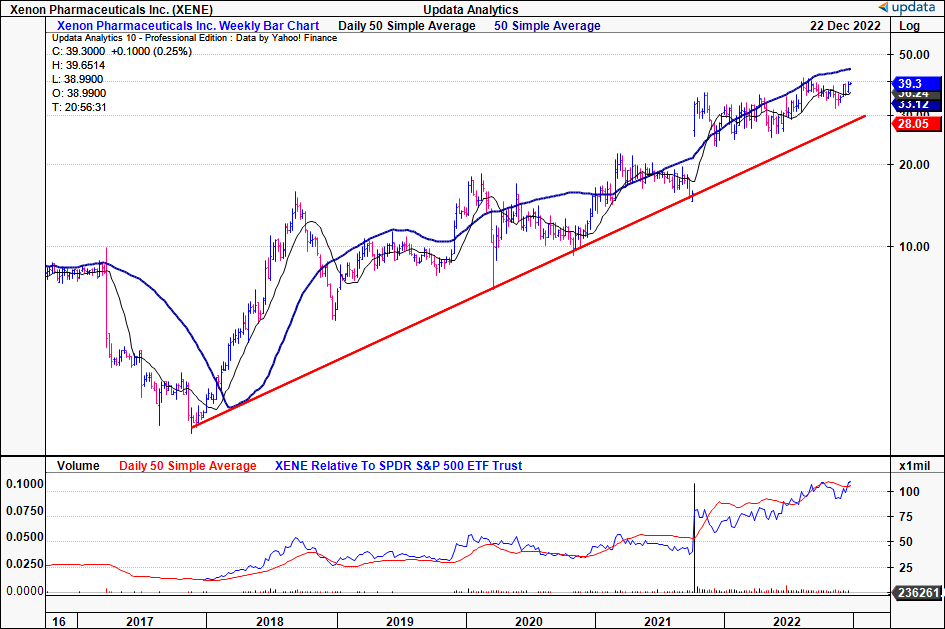
Relevant market data
In order to establish the backdrop of XENE’s price visibility down the line, it’s essential to grasp the broad macro-drivers currently underlining returns of risk assets.
Chief amongst these is the unhappy triad of central bank tightening/rates, the unwind of risk-assets, and the distribution of probabilities for the global economy pointing to an economic recession.
With respect to rates, yields at the long end of the curve continue to remain at lofty levels, with the 10-year holding its 3.7%-4% handle since September/October.
Longer-duration treasuries had caught a bid in October alongside the broad equity market rally, although this exhausted fairly quick and has reversed in recent weeks. In fact, the move has been equally as hurtful to the latest relief rally in equities.
Perhaps a little more alarming, is that the stock-bond correlation has begun to roll over to the downside [seen in the bottom frame in Exhibit 2], yet, the selloff in stocks/bonds is still led by the upshift in yields.
Exhibit 2. Yields continue to remain elevated whilst stock-bond correlations roll over back to 2021 levels.
At the same time, the selloff in broad equities continues.
Data: Updata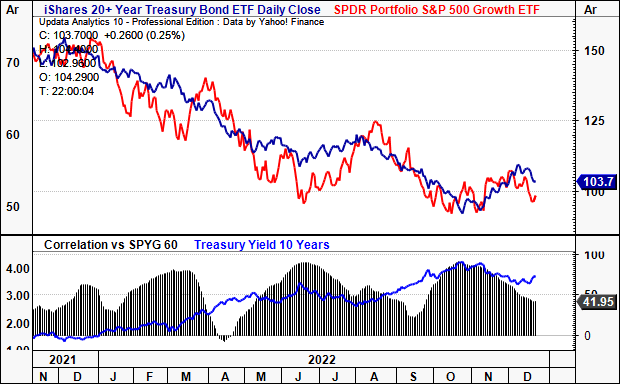
More interestingly, the flight to quality in the USD has also reversed in November/December, closing the divergence that had emerged in mid-2022. What this says about the sentiment for risk assets, we aren’t so sure, however, it does potentially indicate that investors are either rolling cash to the money markets [USD 3-month bill yield has spiked to ~4.25% from 0.07% a year ago]. You can see this co-movement in Exhibit 4.
Exhibit 3. DXY and S&P 500 converging, closing spread from early FY22. Has the gap in risk aversion to loss aversion begun to tighten?
Data: Updata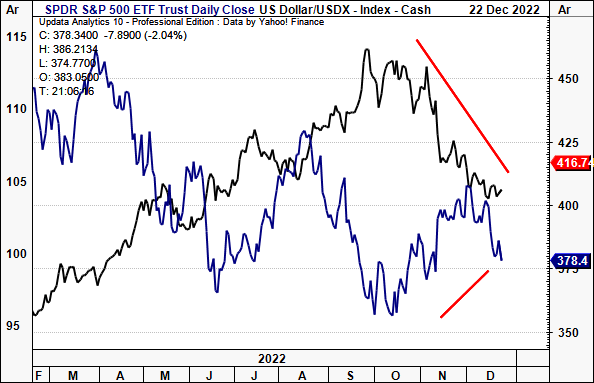
Exhibit 4. Or have investors simply rotated out of an exhausted USD trade, into short-term duration [< 12-month maturity]?
Data: Updata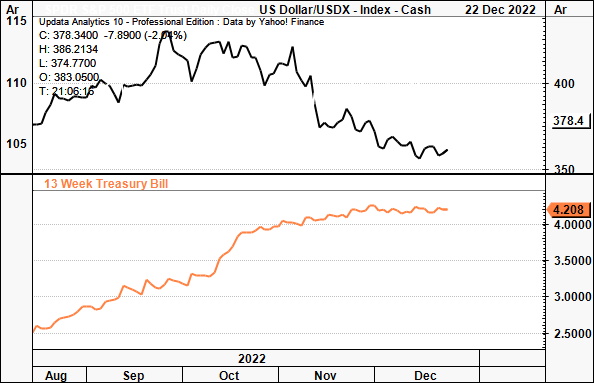
Naturally, the question turns to what this means for equities. We can look at this in terms of factors, especially seeing the lack of fundamental drivers of XENE’s share price. Value has retained a positive spread over growth factors for the entirety of 2022 [Exhibit 5], with the difference widening since November.
Looking ahead, there’s good reason to believe that factors of value will remain in favour, especially for investors seeking to add a note of resiliency into the equity risk budget. In that vein, low-beta, high quality names are the standouts, those trading below their estimated price objectives. We believe this is conducive to XENE in the forward looking regime.
Exhibit 5. Value-growth spread remains at wide breadth with the divergence widening in November/December FY22′.
Data: Updata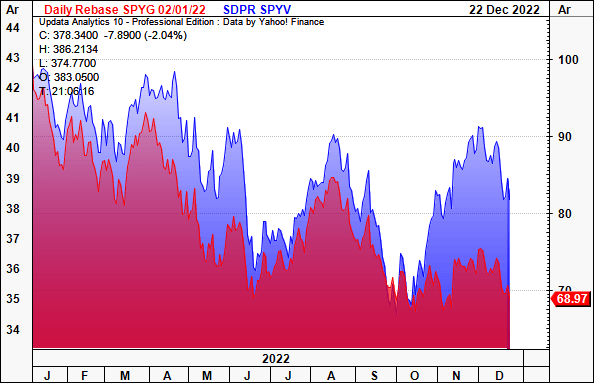
One reason we estimate XENE to fit the mould here is its downshifting covariance structure to the benchmark. Importantly, the stock has continued its upside in spite of its equity beta shifting down rapidly to 0.54 in FY22′ [Exhibit 6]. This serves as important data looking ahead.
First, in the event of a large sigma event in the S&P 500, this data implies XENE may be resilient and not incur a large selloff simply from its autocorrelation the benchmark index alone. It also tells us that investors are rewarding the stock with capital allocation irrespective of what the broad equity market has been up to. In other words, idiosyncratic/company-specific risk premia. These kind of high-alpha, low-beta plays are incredibly attractive in the current investment climate, and we believe positioning against the same is an effective way to provide a liquid immuniser to portfolio volatility.
Exhibit 6. XENE downshifting covariance structure a net positive for adding a tactical, liquid stabiliser to equity volatility in cross-asset portfolios.
Data: Updata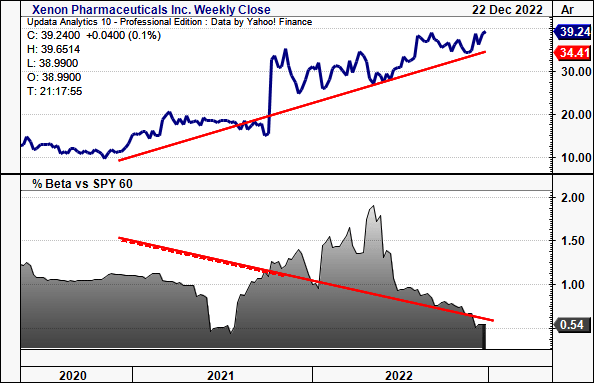
XENE – the technical picture
You’ll see in the chart below that XENE continues to ascend off its long-term base and has recently turned back towards its 2-year high.
After a recent breakout in August this year, the stock consolidated the move, before reclaiming some territory off a snapback rally for the past 5-weeks. This was crucial in our eyes as it had tested this resistance ceiling 2x previously, and the breakout and recovery are evidence of buying support in our estimation.
Moreover, we see the stock trading off its 50DMA and pushing towards the 250DMA. As you may observe, periods in where XENE has traded above both these MAs have been prosperous for shareholders.
Exhibit 7. XENE breakout above resistance level in continuation of longer-term uptrend. Tight weekly closes, before breakout above 50DMA for last 3-4 weeks.
Data: Updata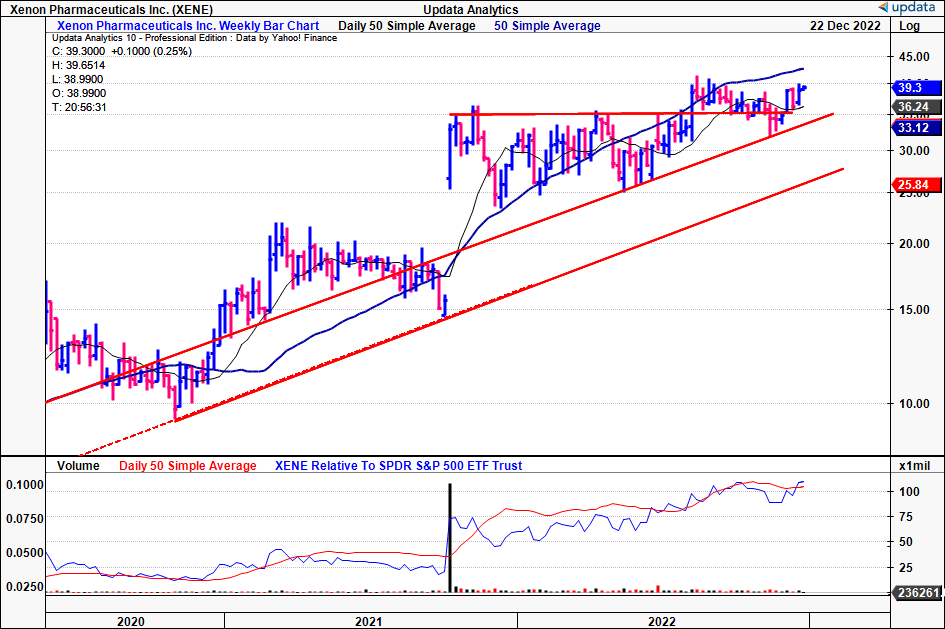
Adding further validity to our thesis on the bullish trend continuing, we see shares trading above cloud support, with the lag line well above as well. This would tell us that current price action is therefore bullish. In support of this view, we noted that on balance volume has continued in its longer-term uptrend, indicating sustained accumulation of shares, whilst momentum has accelerated back to the upside in November.
In our opinion, these indicators demonstrate there are plenty of participants staking the order book on the buy side, and that further upside is warranted.
Exhibit 8. Trading above cloud support with additional confluence from on-balance volume and momentum studies.
Data: Updata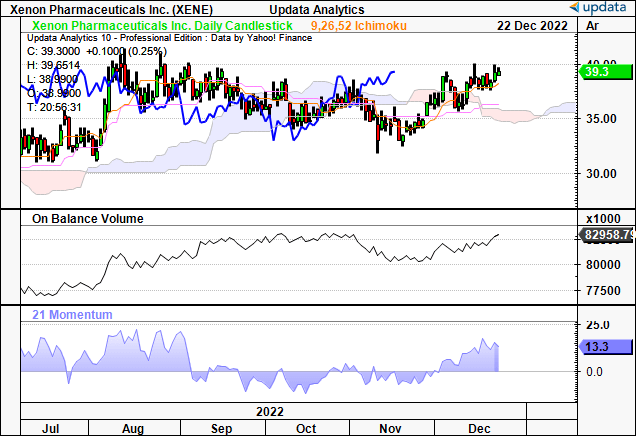
With that, we have upside targets on XENE to $48.5, which corresponds to an all-time high. The stock has broken above short-term resistance lines shown, and remains well within its extended rally. The presence of this bullish target also folds into our buy thesis on the stock from its technical studies.
Exhibit 9. Upside targets to $48.5, as price action looks to bounce away from support and push to this level.
Data: Updata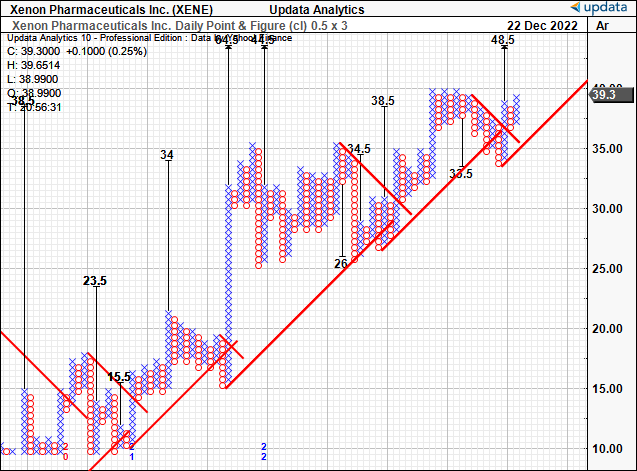
Portfolio positioning
As part of our analysis, we also ran XENE through a series of backtests across model and existing portfolios to observe its impact at different weighting schedules.
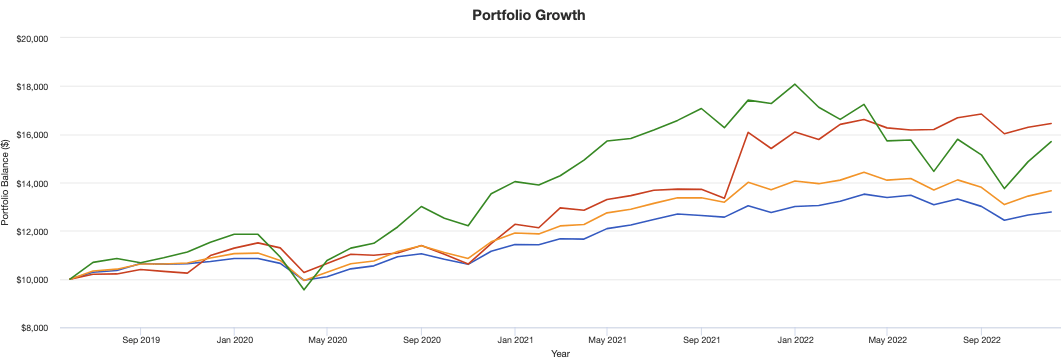
We noted that, in a horizon of 2019 to date, inclusion of XENE in the equity risk budget at a double-digit allocation was conducive to outsized portfolio returns versus the S&P 500. We tested XENE against a balanced portfolio with an weighting to alternatives. We examined this at weightings of 20% [portfolio 2, red line in chart below] down to 2% [portfolio 3] and found the higher XENE’s contribution in the equity budget [up to 20%], the better.
You’ll see it retained a high-Sharpe and high-Sortino stream of returns, with a Sharpe and Sortino ratio of 0.92 and 2.07 respectively. Meanwhile, equity beta remained low at 0.63. Each of these factors are supportive of XENE’s inclusion into cross-asset and equity-focused portfolios.
Exhibit 10. Testing XENE’s inclusion into the equity risk budget of a cross-asset, balanced portfolio yields statistically meaningful outsized returns versus both benchmarks.
Data: HBI Estimates, Portfoliovizualiser Data: HBI Estimates, Portfoliovizualiser Data: HBI Estimates, Portfoliovizualiser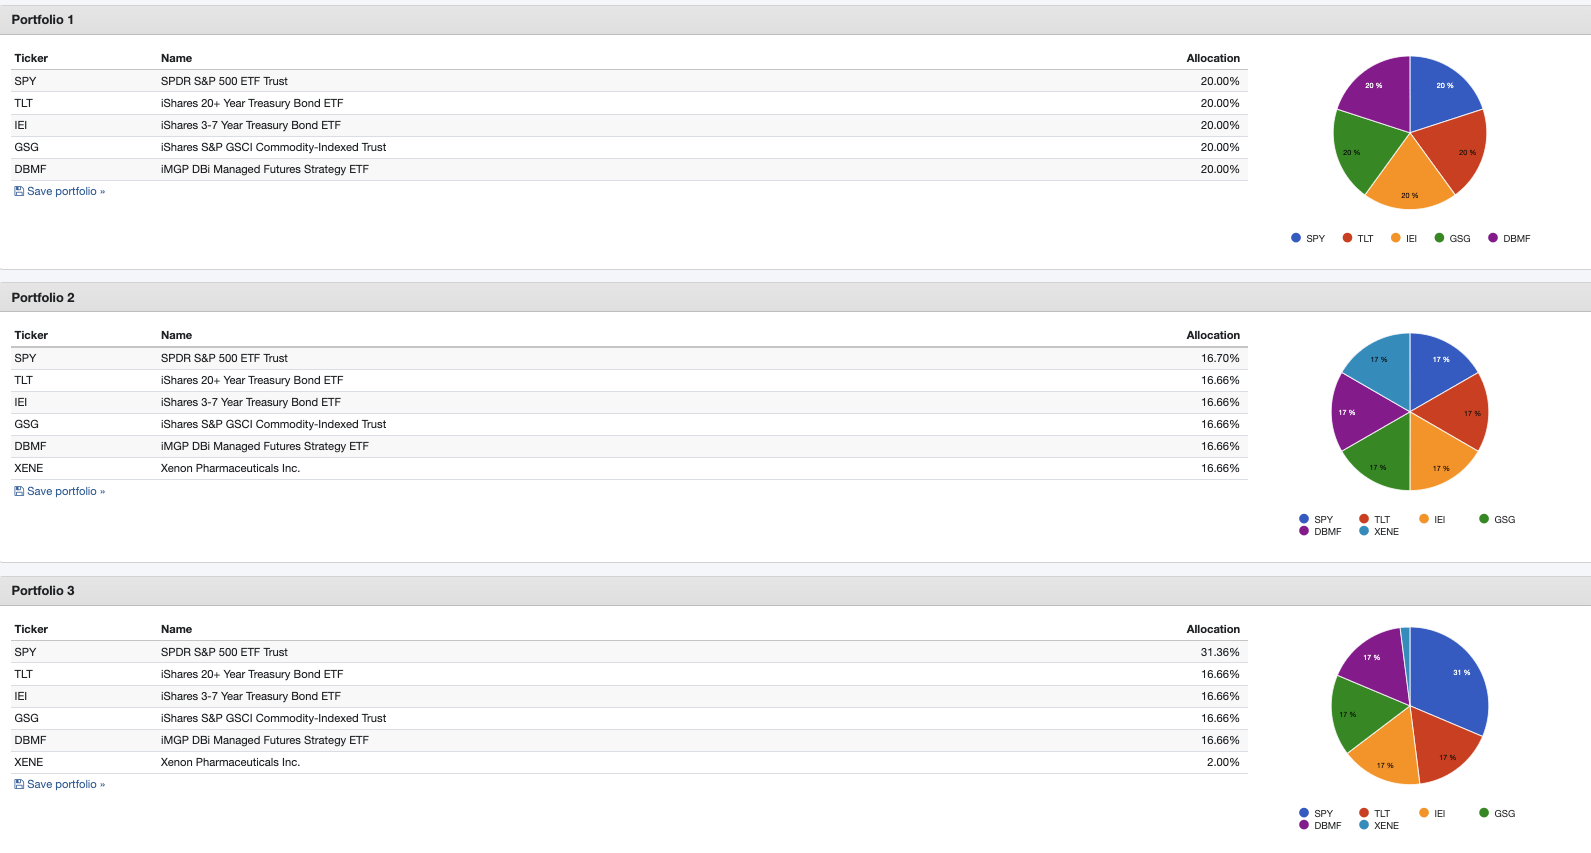

Market positioning and conclusion
We also examined investor positioning in the stock from observations on the order book, and gauged it further by observing the options chain for contracts of January 2023 expiry. As you’ll see below [Exhibit 11], the distribution of open contracts is skewed to the call side with strikes ranging from $20 to as high as $55.
Most of the interest is focused around $40-$45, in tandem with previous findings. This tells us that investors are expecting XENE to perform and have positioned in a bullish manner without necessarily owning the underlying security. Nonetheless, with options data educating us on the market’s perception for January 2023, we’d say this supports our bullish view as well.
Exhibit 11. Options chain skewed to the call side with strikes up to $55, distributed around $40-$45.
Data: Seeking Alpha, XENE quote page, see: “Options”.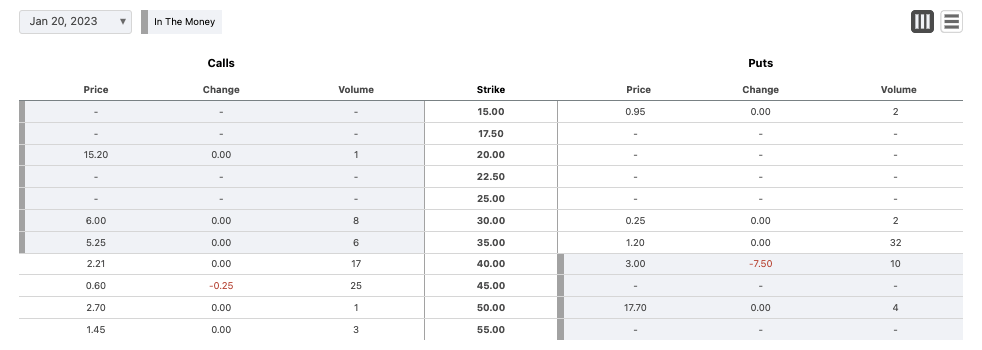
Even still, Seeking Alpha’s factor grading has the stock rated poorly in terms of valuation, growth and earnings revisions. This is a large factor to consider in the investment debate. These objective estimates culminate a large portion of data in order to make informed appraisals across the factors noted below. Alas, this could be a key risk looking ahead.
Exhibit 12. XENE Seeking Alpha factor grading
Data: Seeking Alpha factor grading, XENE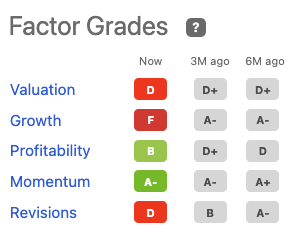
Net-net, there is ample technical data to suggest further upside is warranted for XENE looking ahead. The benefit of this rigorous charting analysis is that it helps gauge our position sizing, and nullifies our questions around organizing a potential exit from the stock. On closer inspection, the combination of market data, XENE’s technical studies, and market positioning tells us that we should looking at a price objective to $48.50, where again we will revise our stance on the company and investment. Rate buy.
Be the first to comment