

Key Talking Points:
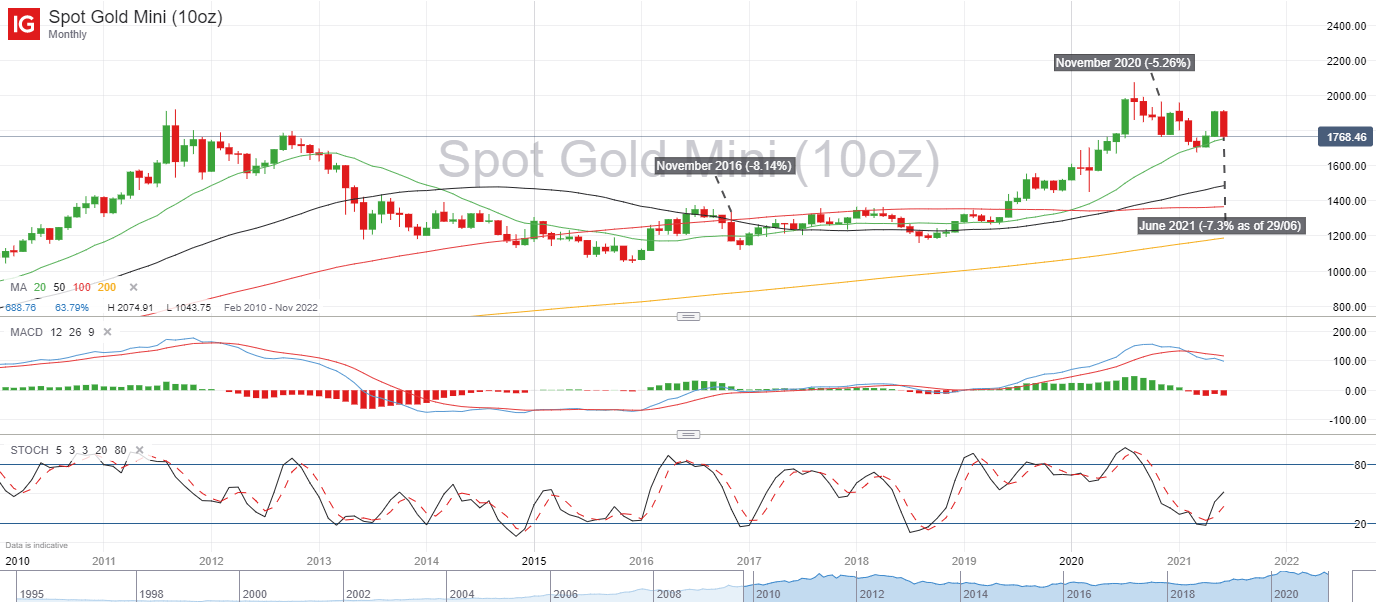
- Gold looks set to end the month over 7% lower, its worst performance since November 2016
- Fed guidance to condition XAU/USD in coming months
The price of gold (XAU/USD) is resting on a key Fibonacci level (50% at 1,762) as buyers failed to bring the price higher from the selloff seen after the Federal Reserve sent a more hawkish message. As I’ve mentioned before, gold has been a good hedge against central bank inaction when it comes to adapting monetary policy to increasing price pressures, so a more hawkish Fed in June is causing gold prices to face their worst monthly performance since November 2016.
XAU/USD Monthly chart
That said, gold prices have been running hot since the end of 2019, intensified by the Covid-19 pandemic, so the current pullback to more sustainable levels is not that unusual. The current price is fluctuating around the highs seen in 2011 and 2012, at which point a multi-year downtrend started, bringing XAU/USD close to the $1,000 mark where consolidation took over. So far the moves seen in gold have been pretty strong in both directions when looked at on a monthly basis, so we haven’t actually had a period of consolidation since the Covid-19 outbreak as of yet.
There is likely to be more volatility on the horizon for gold prices as central banks remain the key focus of market participants. Worldwide, policymakers are stuck at a crossroad between adapting their monetary policy to recent price pressures or hold out until the economic data is showing a robust economy in order to avoid acting too prematurely. The decisions of the Federal Reserve over the coming months will ultimately be the main driver of XAU/USD as investors position themselves on either side of the spectrum.
XAU/USD Daily chart
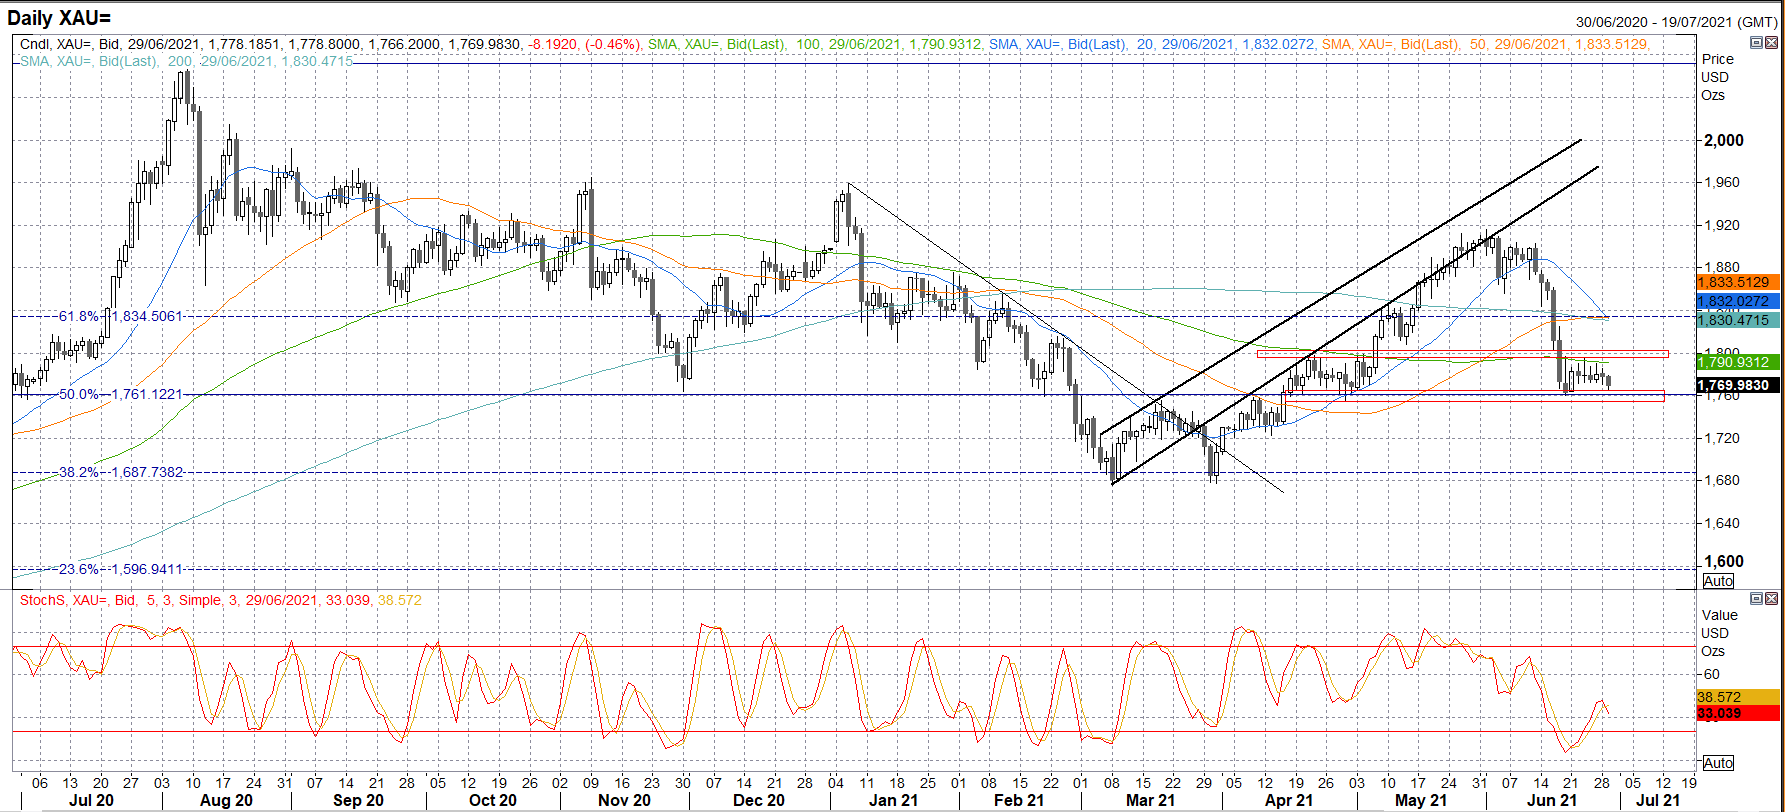
Chart created on Refinitiv
On the Daily chart we can see that XAU/USD has returned to the range it started back in April, fluctuating between 1,800 and 1,760. I wouldn’t be surprised if gold stays between these bounds in the next few days as we head into NFP Friday, when I suspect most of the volatility will arise. This is a good opportunity to make the most out of range trading as momentum builds towards the end of the week. Watch out for the key levels on either side of the range for a possible breakout.
Fibonacci Confluence on FX Pairs
Learn more about the stock market basics here or download our free trading guides.
Traders of all levels and abilities will find something to help them make more informed decisions in the new and improved DailyFX Trading Education Centre
— Written by Daniela Sabin Hathorn, Market Analyst
Follow Daniela on Twitter @HathornSabin
Be the first to comment