

PM Images
Written by Nick Ackerman, co-produced by Stanford Chemist. This article was originally published to members of the CEF/ETF Income Laboratory on December 7th, 2022.
It hasn’t been too long since we last touched on XAI Octagon Floating Rate & Alternative Income Term Trust (NYSE:XFLT). However, with the fund’s latest annual report, there was more good news to share. As we expected, the net investment income has continued to grow. This bodes well for the current distribution rate that investors are collecting.
It still isn’t entirely 100% covered, but with rates continuing to rise, it could keep heading in that direction. Regardless, at a 13.60% distribution yield for shareholders, the higher coverage we are seeing is impressive. This is a testament to how much yields are rising and how what was seen as extremely high a year ago is no longer that unusual.
The Basics
- 1-Year Z-score: -1.16
- Discount: -0.31%
- Distribution Yield: 14.02%
- Expense Ratio: 3.81%
- Leverage: 41.35%
- Managed Assets: $392.35 million
- Structure: Term (anticipated liquidation date Dec. 31, 2029)
XFLT’s objective is to “seek attractive total return with an emphasis on income generation across multiple stages of the credit cycle.”
They will do this through “a dynamically managed portfolio of floating-rate credit instruments and other structured credit investments within the private markets. Under normal market conditions, the Trust will invest at least 80% of managed assets in senior secured loans, CLO debt and equity.”
The expense ratio here might look incredibly high, which would be a fair criticism. However, compared to the other CLO-related funds, this is lower. One of the reasons is that they don’t have incentive fees, which would help provide better performance over the long run for investors. The leverage expenses are also a large part of the equation.
XFLT Expenses (XA Investments)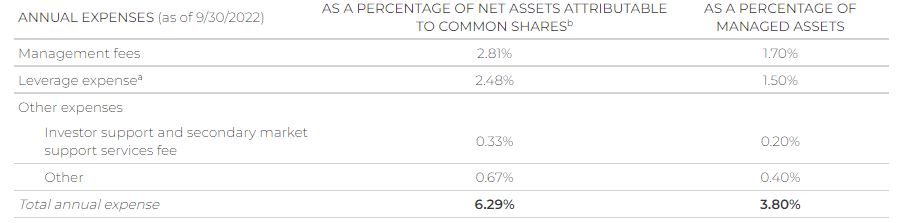
One of their sources of funding is the publicly traded 6.5% Series 2026 Term Preferred Shares (XFLT.PA). There are also the 6% Series 2029 Convertible Preferred Shares; these were sold to institutional investors. These are a fixed rate preferred. Meaning that as interest rates rise, there will not be an impact on the costs here. Having a meaningful portion of borrowings based on a fixed rate is a positive in this environment.
That’s unlike the credit facilities, which will see higher interest expenses. Their credit facility had borrowings of $113.15 million at the end of the fiscal year. That’s up slightly from the end of June, when it was at $110.65 million. However, that is still down from the $124.15 million at the end of March 2022. The interest rate for the credit facility is based on SOFR plus 1.45%.
Performance – Attractive Discount
Since the last time we covered the fund, the discount has contracted a touch. We are now sitting pretty close to parity with the NAV per share. That’s rather unusual for CEFs, in general, but it happens occasionally. This still suggests that it is relatively attractive, considering the fund’s tendency to trade at premium levels.
Ycharts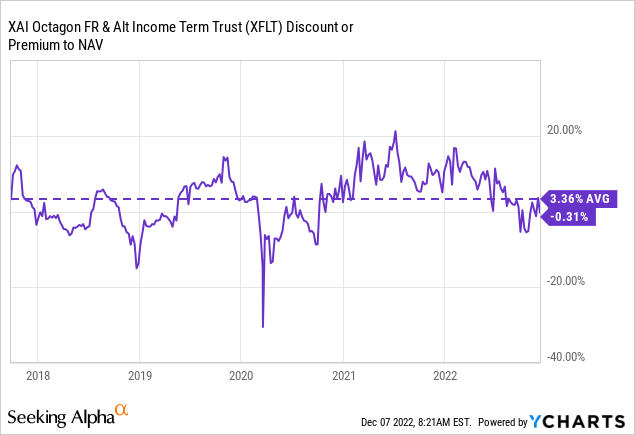
For the annualized performance of the fund, it would be hard to paint a pretty picture. It has been down quite tremendously, but that’s primarily where another opportunity is. It also isn’t as if the underlying benchmark is outperforming excessively. It is the S&P/LSTA U.S. Leveraged Loan 100 Index, a non-leveraged index when XFLT is leveraged. When things are going down, that is going to be amplified. However, the upside can also be amplified.
XFLT Annualized Returns (XA Investments)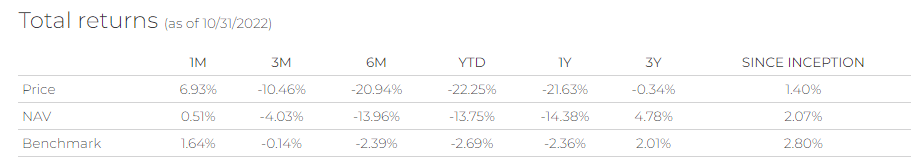
As interest rates rise, that pushes down fixed-income prices. Of course, we also shouldn’t ignore the credit risks. Some of the declines in the prices of the underlying portfolio are due to the expectation for defaults to pick up. Most analysts and economists suggest that 2023 could see a recession.
For these reasons, the underlying portfolio for XFLT is also trading at a discount. At the end of October, it was last reported that the average bond price as a percentage of par was 82.39%.
Distribution – Coverage Improves
During COVID, XFLT trimmed its distribution but quickly restored it when things started to recover. Since then, they’ve held to the same $0.073 per month. Given the latest coverage improving due to their underlying portfolio of floating rate exposure, the current rate seems fairly secure.
XFLT Distribution History (CEFConnect)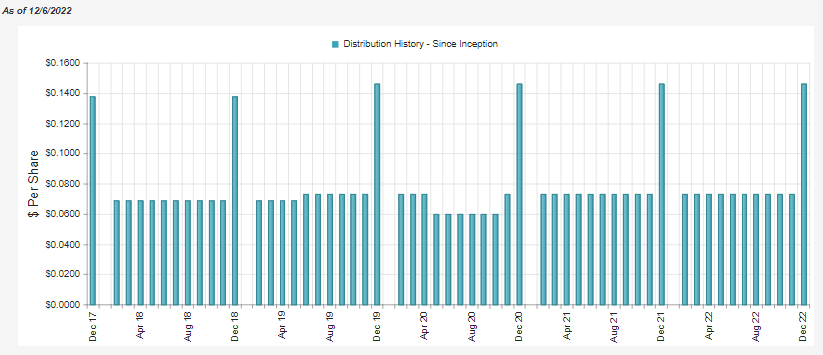
It would be much more comfortable if NII coverage were over 100%. However, it has been heading in the right direction, as was expected. It could even be there already.
In this case, increased income can come from the additional capital they’ve invested through the proceeds of the sale of common shares and the DRIP. Additional outstanding shares mean more income generation but also more distributions to pay. NII coverage in the latest period was 88.8% from 87.8%.
Not a massive increase, but interest rate increases weren’t fully reflected by June 2022 either. Senior loans have a floor to breach first, which was likely only hit after the first couple of raises in most of these investments. With subsequent increases, the income generation should start rolling in.
Another way to look at this to reflect the dilution of added shares would be looking at NII per share in the financial highlights. In that case, we see an NII of $0.58 for the nine months compared to the prior fiscal year 2021 of $0.76. If we annualized out that latest figure, we would come out to $0.7733. Again, reflecting that the income generation wasn’t overly accretive at this point, but it should start ramping up in subsequent reports.
Important wording here is “should start ramping up in subsequent reports.” With the annual report available now, we know that NII has increased. In terms of the absolute NII, that came in at over $26 million. Such a big jump year-over-year because more shares are now outstanding after issuing additional shares. When done at a premium, this is beneficial as it is accretive.
That’s against the ~$28 million in distributions paid, working out to a 93% NII coverage. I’d say that qualifies as starting to see the “ramping up” in coverage.
XFLT Annual Report (XA Investments)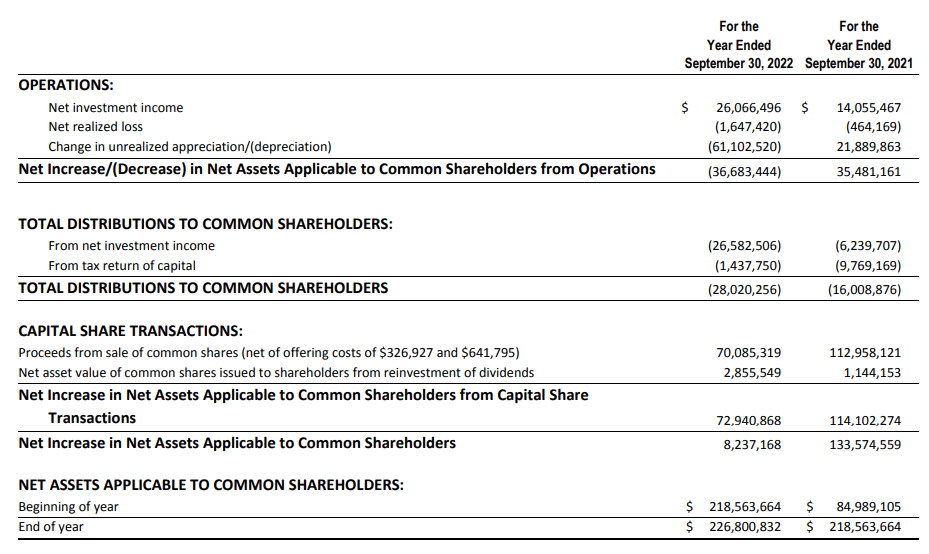
Bearing in mind this now reflects the entire fiscal year of 12 months, which is important to note. The quarterly report showing a nine-month period we looked at the last time showed the NII at $0.58 per share. That means that those nine months are being reflected in this 12-month period we are looking at now. Since that was for a nine-month period, it worked out to an annualized $0.7733.
XFLT Annual Report (XA Investments)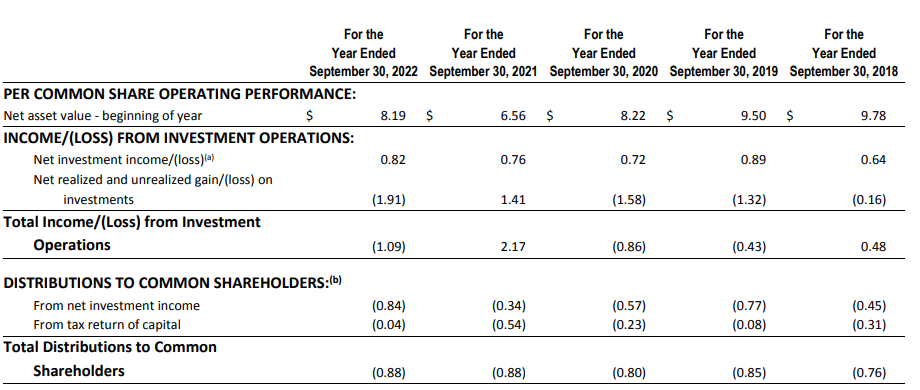
With the full fiscal year, we see that NII per share came in at $0.82. This is important because it lets us know that the last quarter of the fiscal year ramped up meaningfully. Said another way, the $0.7733 represented a $0.0133 NII increase from the previous fiscal year.
When looking at the per-share figures, it isn’t necessarily that easy to visualize. So, in terms of percentages, that works out to an increase of 1.75% over the prior year. The full fiscal year-over-year increase was $0.06, or an increase of 7.9%.
To sum up, NII improved as expected. We aren’t at 100% coverage being reported just yet, but there is a good chance we are close, given the significant ramp-up in income generation due to higher interest rates. Assuming the world doesn’t fall apart next year, that bodes well for the sustainability of this fund. A fund that is currently paying a 14.02% distribution yield with a similar NAV distribution rate of 13.88% is a compelling investment choice.
Quick Update On XFLT’s Portfolio
As mentioned above, it hasn’t been too long since we looked at the fund, so the portfolio hasn’t changed drastically. We noted the average bond price as a percentage of par, being 82.39%. That’s a small decrease from the 85.96% they previously reported at the end of August 2022.
XFLT Fund Characteristics (XA Investments)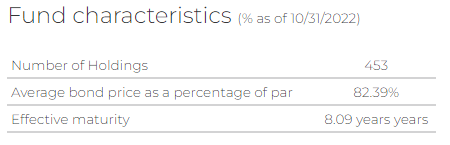
Currently, the total number of positions is 453 vs. 455 last another metric reflecting the limited changes since our last look. Senior secured first-lien loans remain the largest allocation, inching up only slightly from the 45.51% allocation previously.
XFLT Asset Exposure (XA Investments)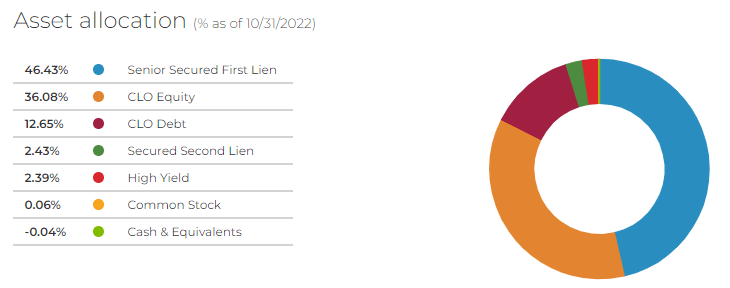
The rest remains essentially flat as well, with cash & equivalents being the largest relative change as it stood at a 0.42% weighting previously. Not necessarily a huge shift. On the other hand, bumping up the leverage in the latest quarter and putting this cash to work could generate some more NII for the fund going forward.
Conclusion
With the latest annual report, we see confirmation of what was expected. That was that NII improved materially. It was specifically in their fiscal year’s latter portion. Since then, interest rates have only gone higher. They are also expected to keep going higher, too. That means we can still expect XFLT’s distribution coverage to hit 100% if they aren’t already there. Barring a fairly bad recession in 2023, that bodes well for investors looking at XFLT as an income play. It should mean that the current distribution remains attractive and sustainable.
Be the first to comment